Energy Flow and Biogeochemical Cycles - Bio 1108
1/36
There's no tags or description
Looks like no tags are added yet.
Name | Mastery | Learn | Test | Matching | Spaced | Call with Kai |
|---|
No analytics yet
Send a link to your students to track their progress
37 Terms
ecosystem
community of living organisms and their interactions with their abiotic (nonliving) environment.
equilibrium
steady state of an ecosystem where all organisms are in balance with their environment and with each other
resistance
the ability of an ecosystem to remain at equilibrium in spite of disturbances
resilience
the speed at which an ecosystem recovers equilibrium after being disturbed
food chain
A linear sequence of organisms through which nutrients and energy pass
trophic level
each of several hierarchical levels in an ecosystem, comprising organisms that share the same function in the food chain and the same nutritional relationship to the primary sources of energy.
primary producer
the bottom of the food chain, usually photosynthetic organisms (plants
and/or phytoplankton)
primary consumer
consumes the primary producer
secondary consumer
usually carnivores that eat the primary consumers
apex consumer
highest-level consumer in the ecosystem
decomposer
feed on dead/decaying organisms
producers
(plants, algae, cyanobacteria) capture light energy and CO2 to produce sugars through photosynthesis
consumers
gain chemical energy and nutrients from producers
decomposers
recycle nutrients by breaking down organic matter (cellulose, etc.) and releasing carbon and other nutrients back to environment
food web
graphic representation of a holistic, nonlinear web of primary producers, primary consumers, and higher-level consumers used to describe ecosystem structure and dynamics
holistic ecosystem model
this model attempts to quantify the composition, interaction, and dynamics of entire ecosystems; it is the most representative of the ecosystem in its natural state.
mesocosm
a simulated outdoor ecosystem used for scientific research, bridging the gap between laboratory experiments and field studies
microcosm
simplified, artificial, or natural ecosystem that is small enough to be studied in a controlled environment like a laboratory, or a miniature replica of a larger, more complex ecosystem
conceptual model
this model consists of flow charts to show interactions of different compartments of the living and nonliving components of the ecosystem
analytical model
this model uses simple mathematical formulas to predict the effects of changes on ecosystem structure and dynamics
simulation model
this model uses complex computer algorithms to model ecosystems and to predict the effects of changes
photoautotrophs
such as plants, algae, and photosynthetic bacteria, serve as the energy source for a majority of the world’s ecosystems
chemoautotrophs
synthesize complex organic molecules, such as glucose, for their own energy; usually they do this without sunlight and rather use other sources of energy
heterotrophs
acquire energy from digesting living or previously living organisms
biomass
the total mass, in a unit area at the time of measurement, of living or previously living organisms within a trophic level
Gross primary productivity
The rate at which photosynthetic primary producers incorporate energy from the sun
net primary productivity
the energy that remains in the primary producers after accounting for the organisms’ respiration and heat loss. The net productivity is then available
to the primary consumers at the next trophic level
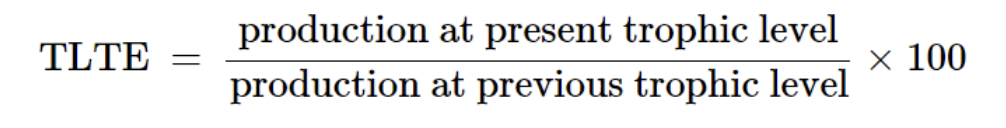
Trophic level transfer efficiency (TLTE)
The measurement of energy transfer efficiency between two successive trophic levels
10%
Average TLTE
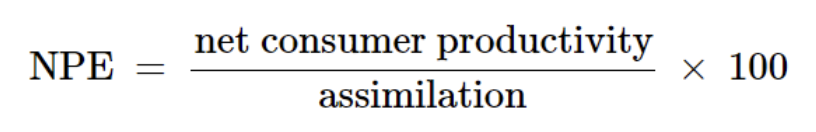
Net production efficiency (NPE)
allows ecologists to quantify how efficiently organisms of a particular trophic level incorporate the energy they receive into biomass
Varies with species (large mammals are more efficient at producing biomass than smaller mammals because of their lower surface area:volume; also more efficient in ectotherms)
Ecological pyramid
diagrams that depict the biomass, number of organisms, and energy at each trophic level
biomagnification
the increasing concentration of persistent toxic substances in organisms at each trophic level
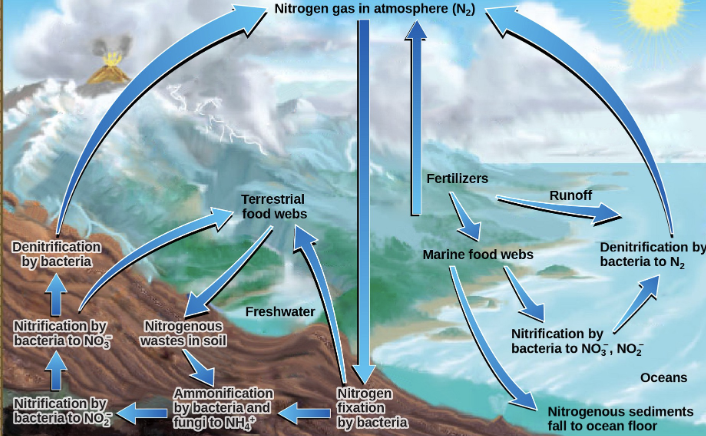
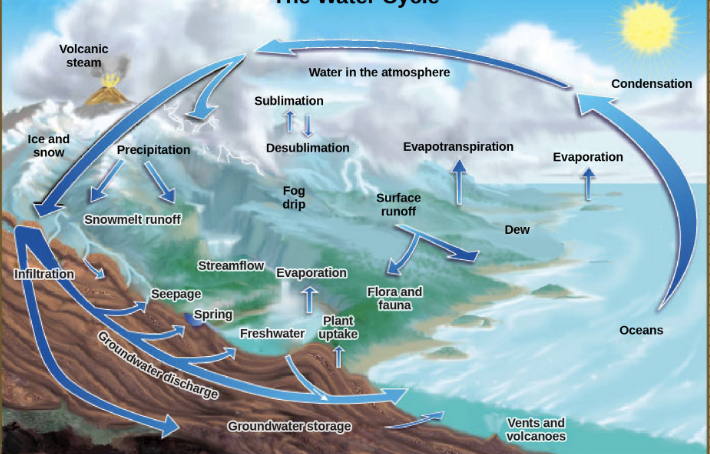
biogeochemical cycles
this diagram depicts the recycling of inorganic matter between living organisms and either environment (C, H, N, O, S, P)
2.5%
percent of fresh water on Earth
Water cycle
What cycle is shown here?
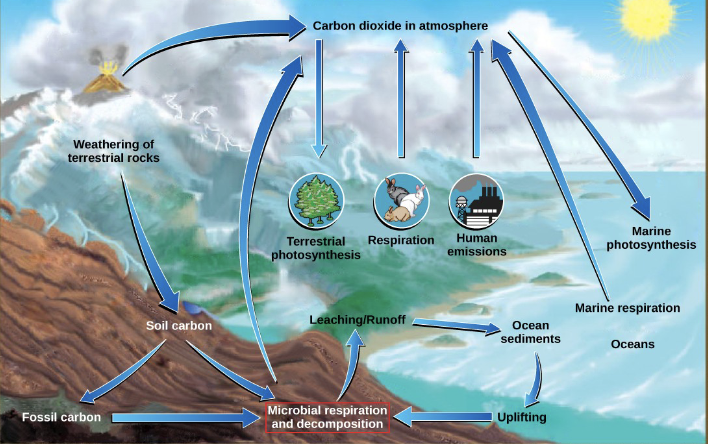
Carbon Cycle
What cycle is shown here?
Nitrogen Cycle
What cycle is shown here?