Stats 201 notes
1/137
There's no tags or description
Looks like no tags are added yet.
Name | Mastery | Learn | Test | Matching | Spaced | Call with Kai |
|---|
No analytics yet
Send a link to your students to track their progress
138 Terms
What is Statistics?
The art and science of designing studies and anlayazing data
Data analysis
The process of organizing, displaying, summarizing, and asking questions about data
Steps of data analysis
step 1: pose a question that can be answered by data
step 2: determine a plan to collect the data
step 3: summarize the data with graphs and numerical summaries
step 4: answer the question pposed in step 1 using the sata and summaries
What is data?
The information we gather with experiments and surveys. That is, data are numbers with a context.
What are the 3 components of statistics
1) design
2) Description
3) Infernence
What is design?
Planning how to obtain data to answer the question of interest
What is descriptive?/Descriptive Statistics
summarizing and analyzing the data obtained. can use numbbers or graphs
What is inference?/Statistical Inference
Making decisions/conclusions and predictions based on the data to answer the statistical questions
Individuals (the who)
objects (people, animals, things) described by a set of data
Variables (the what)
any characteristics of an individual. A variable can take different values for different individuals. They are 2 types
What are the 2 types of variables in stats?
categorical/qualitative and quantitative
Categorical/Qualitative variable
places individuals into one or several groups oe categories
Numerical/ Quantitative variable
Takes numerical values for which arithmetic operations such as addition and averaging make sense
Population
a group of subjects or people we wish to study. ALL is the keyword
Sample
A collection/ subset/ part of objects or people taken from the population of interest
Census
a survey that measures every member of a population
Statistic
a numerical measure/ vaule that characterizes/ describes some aspect of the sample
Description of a population, sample, parameter, a statistic
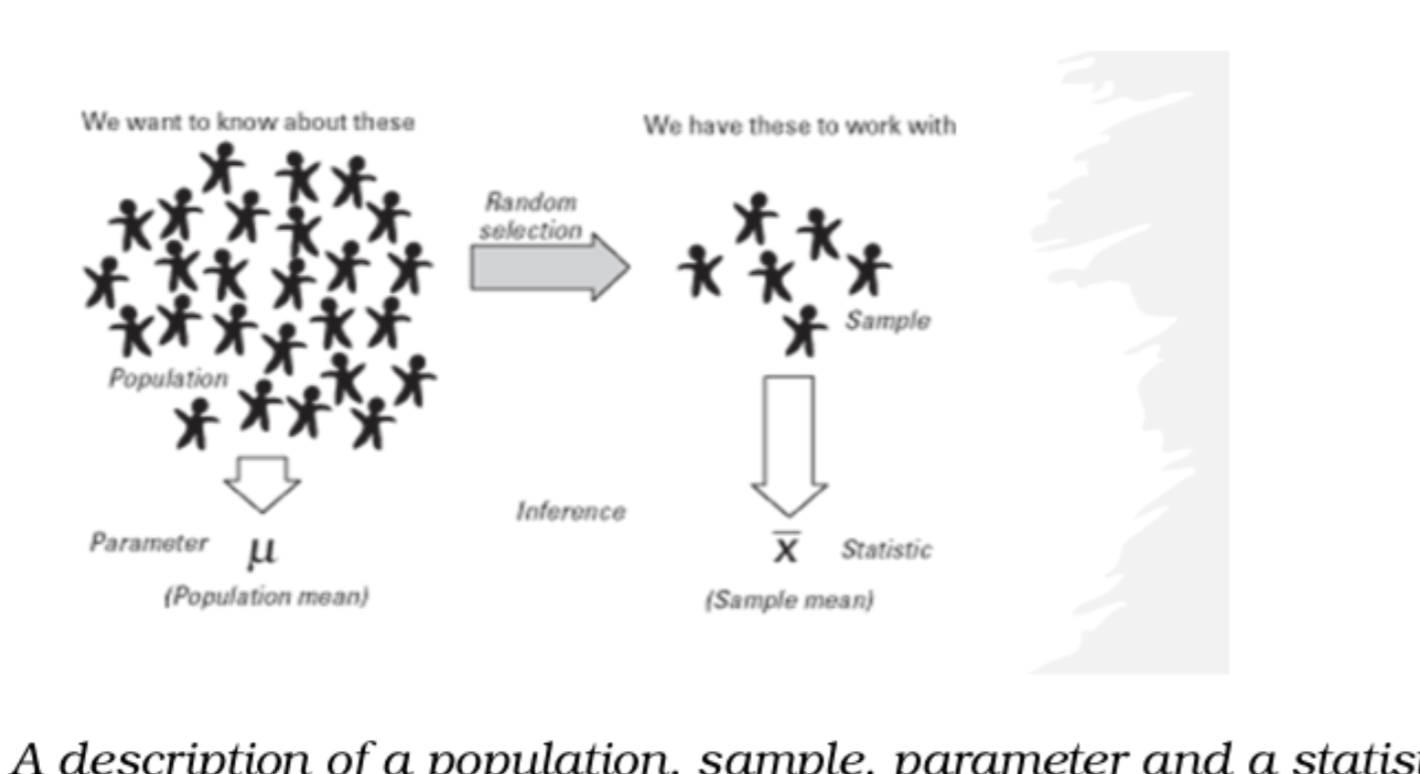
We use sample statistics to what?
estimate population parameter vaules
A polling agency takes a sample of 1500 American citizens and asks them if they are lactose intolerant. 12% say yes. This is interesting, since it has been shown that 15% of the population is lactose intolerant.
What is the population
all american citizens
A polling agency takes a sample of 1500 American citizens and asks them if they are lactose intolerant. 12% say yes. This is interesting, since it has been shown that 15% of the population is lactose intolerant.
What is the sample
1500 American citizens surveyed
A polling agency takes a sample of 1500 American citizens and asks them if they are lactose intolerant. 12% say yes. This is interesting, since it has been shown that 15% of the population is lactose intolerant.
what is the individuals of the survey
American citizens
A polling agency takes a sample of 1500 American citizens and asks them if they are lactose intolerant. 12% say yes. This is interesting, since it has been shown that 15% of the population is lactose intolerant.
what is the variable
lactose intolerance
A polling agency takes a sample of 1500 American citizens and asks them if they are lactose intolerant. 12% say yes. This is interesting, since it has been shown that 15% of the population is lactose intolerant.
is the variable qualitative (categorical) or quantitative (numerical)
catergorical
A polling agency takes a sample of 1500 American citizens and asks them if they are lactose intolerant. 12% say yes. This is interesting, since it has been shown that 15% of the population is lactose intolerant.
What is the parameter
15%
A polling agency takes a sample of 1500 American citizens and asks them if they are lactose intolerant. 12% say yes. This is interesting, since it has been shown that 15% of the population is lactose intolerant.
What is the statistic
12%
Descriptive statistics
involves methods of organizing. picturing and summarizing information from samples or populations
-graphs and numbers such as averages and percentages
-reduces data to simple summaries without distorting or losing much information
Inferential statistics
Methods of making decisions or predictions about a population, based on data obtained from a sample of that population
-used when data are available from a sample only, but we want to make a decision or prediction about the entire population
Randomness in stats
refers to the inherent uncertainty in the outcome of a process, even when the process is well understood
-Individual outcomes are unpredictable
-long-run patterns may still be stable
Examples of randomness in stats
tossing a coin, daily number of er vists selecting a random sample etc.
Varaibility in stats
describes how much data values differ from one another
-measures the spread in a dataset
-exists even when data are collected carefully
Randomness in a proces leads to
variability in observed data
Observations
data values observed for a variable
In a graph variables are on
the columns (vertically)
In a graph, observations are on
rows (horizontally)
Two Types of variables/data
categorical and quantitative
Categorical
data/variable that places an individual into one or several categories
Quantitative
data/variable takes numerical values for which arithmetic operations such as adding and averaging make sense.
To determine if a variable is categorical or quantitative
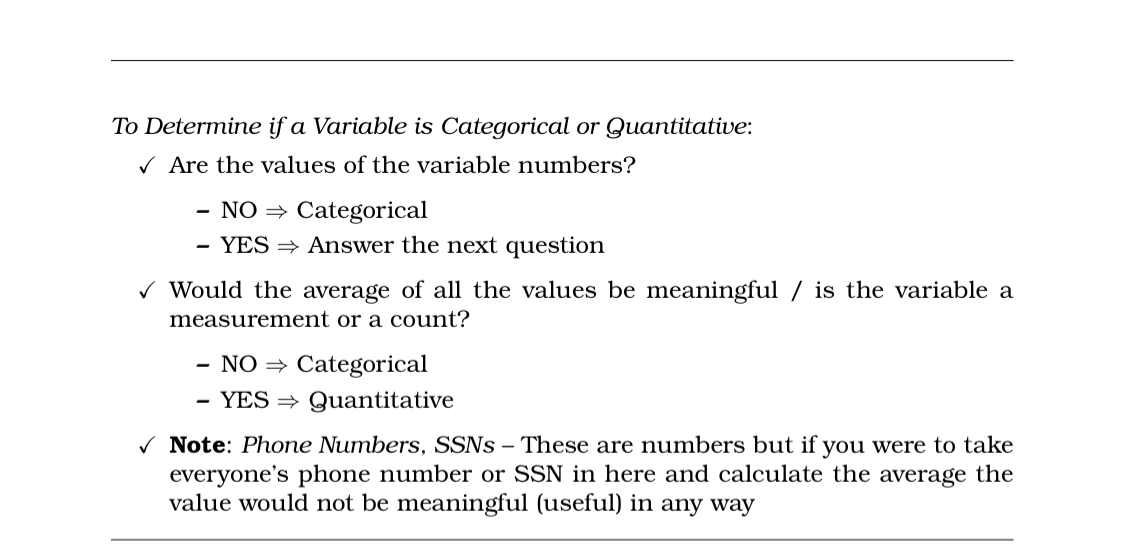
Two types of quantitative variables are
discrete and continuous
Discrete
those quantitative variables where possible values form a set of separate numbers. key phrase “the number of “
-outcomes are counts (for example 0,1,2,3)
-no decimals allowed
-finite(not infinite) number of possible values
Examples of discrete
number of pets
number of siblings
number of friends
Continuous
those quantitative variables where possible values form an interval
-outcomes are measurements
-Decimals are allowed but not required
-infinite number of possible values
Examples of continuous
Hieght, weight age, time taken to complete an exam
Two types of catergorical variables
nominal and ordinal
Nominal
a categorical variable that has two or more categories, but there is no intrinsic ordering to the categories
Examples of nominal
hair color, gender , country
Ordinal
A categorical variable that has a clear ordering of the variables
Example of ordinal
Economic status (low, medium, and high)
level of education (elementary, high, and college, etc.)
Financial happiness (very happy, happy, neutral, unhappy, very unhappy)
What is ditribution of a variable?
A distribution that tells us what values it takes and how often it takes these values
What to look for with quantitative variables
shape
center
spread
Shape
do observation cluster in certain intervals and / or are they spread thin in other areas
Center
where does a typical observation falll
Spread or variability
how tightly are the observatuiobs clustering around the center
Explortaory data analysis
statistical tools (such as graphs to display a variable) and ideas to examine the data in order to describe their main features
What are the types of display for categorical data / variables?
1) Frequency table
2) Bar charts and pie charts
3) Paerto chart
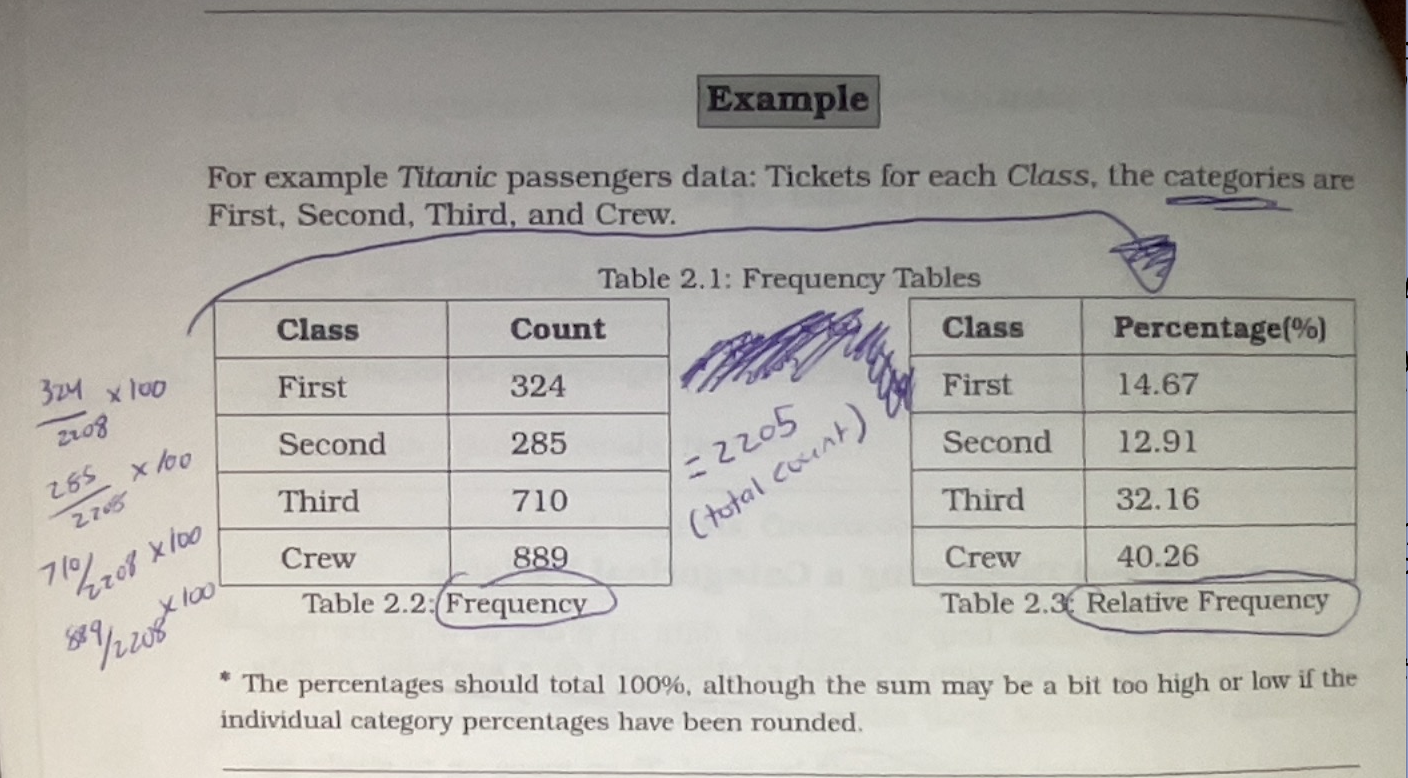
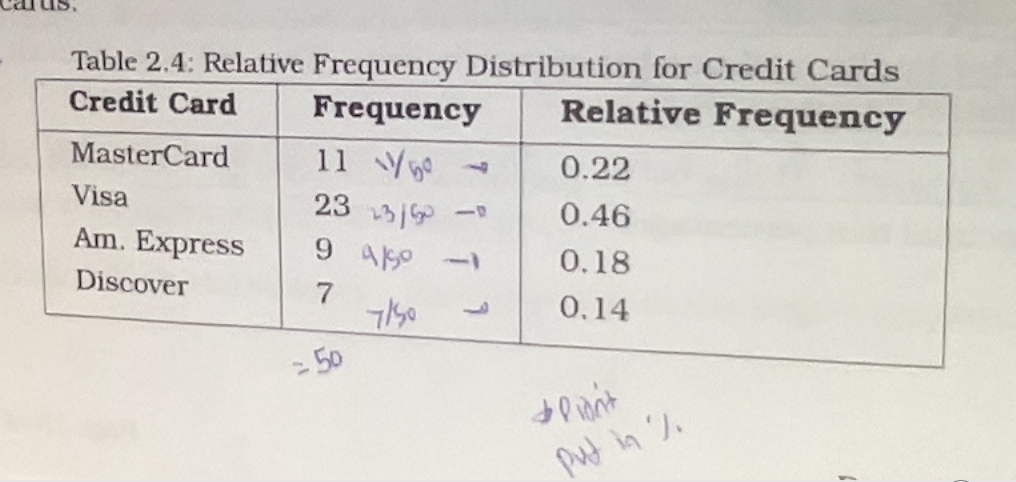
Frequency Table
A table that lists the number of cases in each category along with its name.
Frequency
Number of observations for each value, the counts
Relative Frequency (R.F.) / Proportion
number of observation in each category divided by the total number of observations
Percent proportion
proportion multiplied by 100 ( changing the decimal to a percentage)
Example of a frequency table
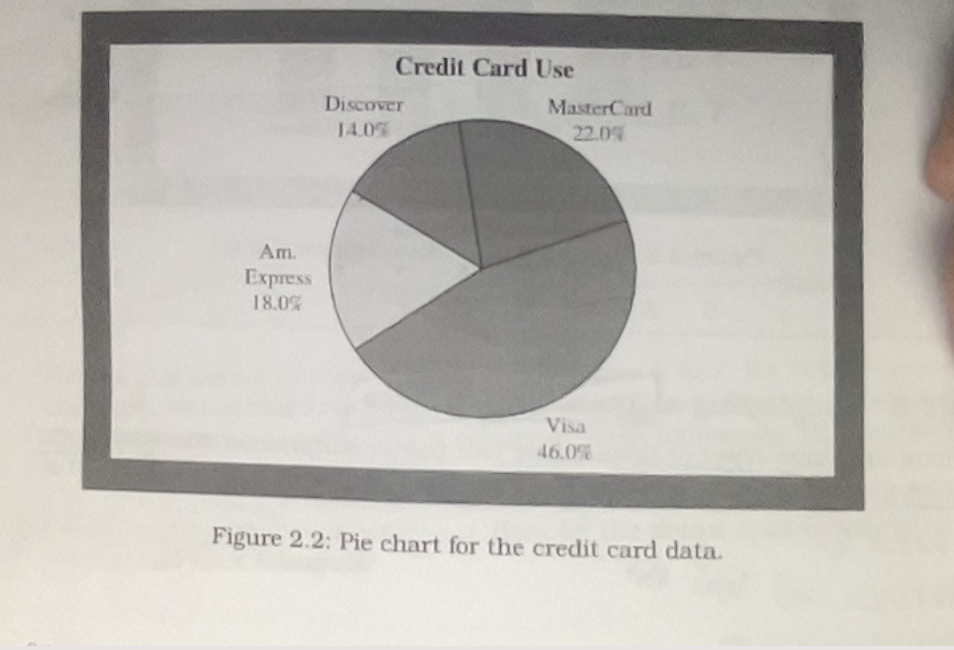
Pie chart
A circle having a slice of the pie for each category. Wherethe size of slice corresponds to the percetnage of observation in the category
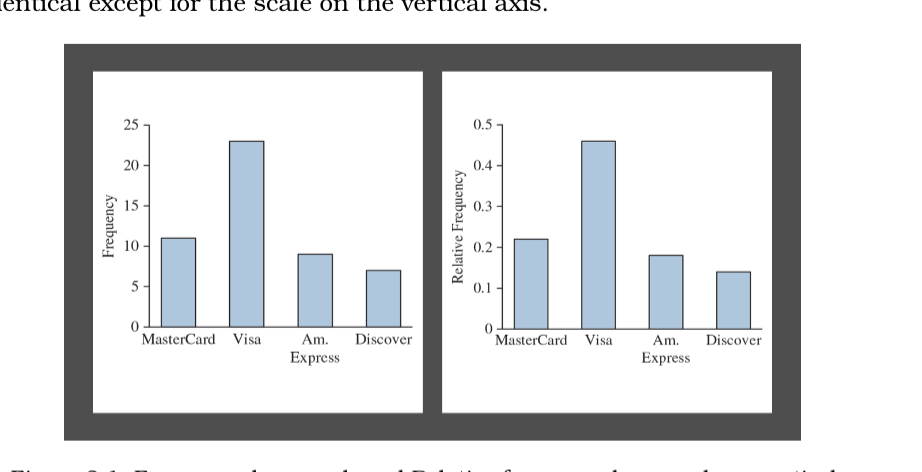
Bar chart
Displays a vertical bar for each category. The height of the bar shows the percentage of observations in the category. Usually each bar is apart
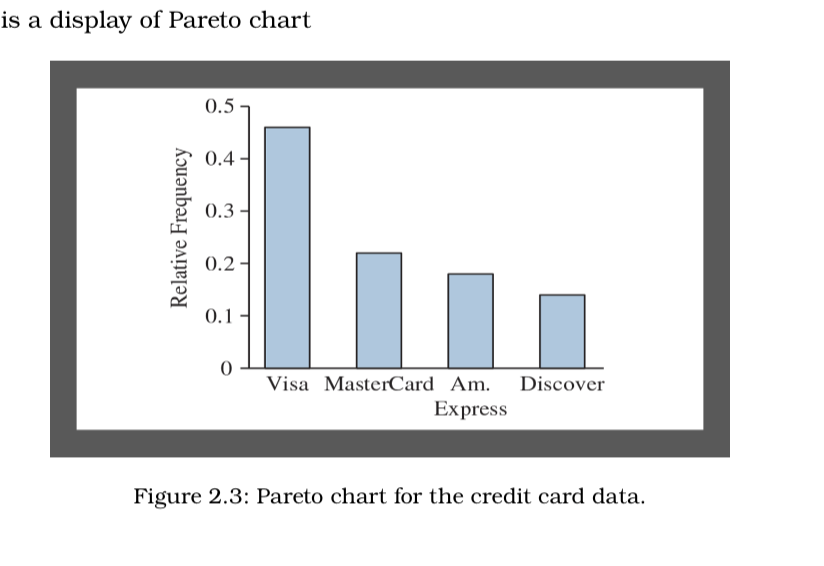
Pareto chart
A bar chart in order from largest to smallest frequency or relative frequency
What are the types of display for quantitative data / variables?
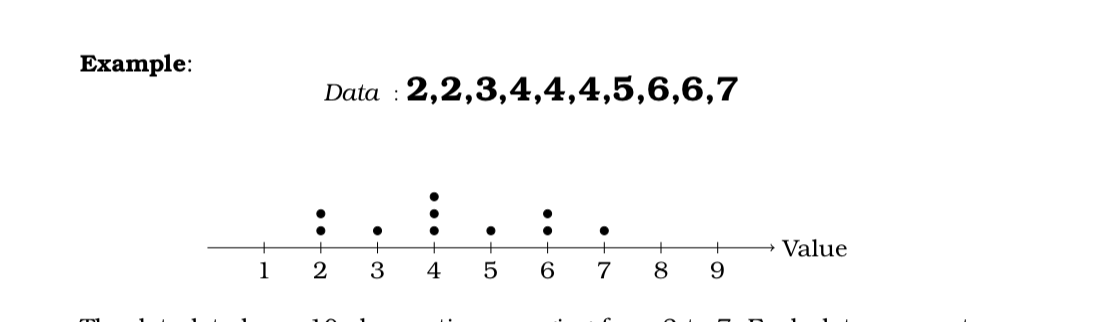
1) Dot plot
2) Stem and leaf plot
3) Historgram
Dot plot
Shows a dot for each observation, placed just above the value on a number line for that observation.
-each dot represents one observation
-stacked dots indicated repeated values
-best for small to moderate-sized datasets
What do dot plot show
center (typical value)
spread (range, clustering)
shape (skewness, symmetry)'
outliers
Dot plot advanatges
simple and easy to interpret
preserves individual data values
Stem and leaf plot
organizes numerical data by separating each value into a stem (leading digit(s)) and a leaf (final digit
-stems are listed vertically
-leaves are listed horizontally in ascending order
-original data values can be reconstructed
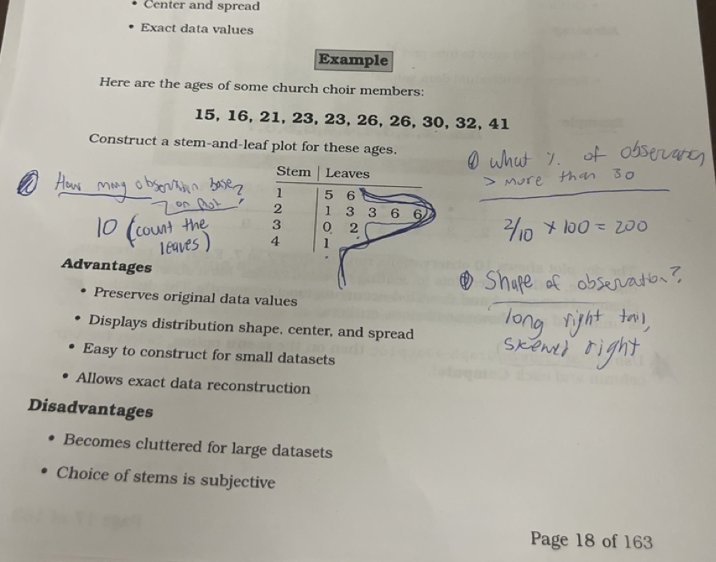
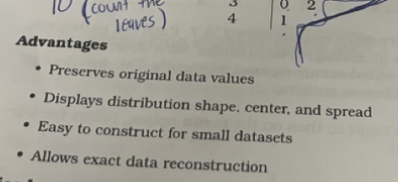
Stem and leaf plot advantages
Steaf and leaf plot disadvantages
not suitable for data with wide ranges or many digits
difficult to compare multiple data sets
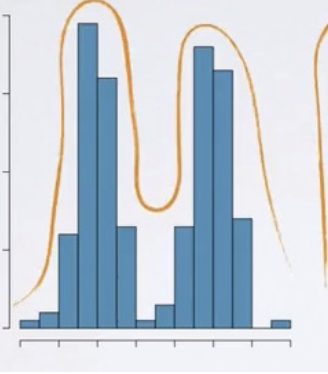
Histogram
A graph that uses bars to represent the frequencies or the relative frequencies of the possible outcomes for a quantitative variable. Most common graph.
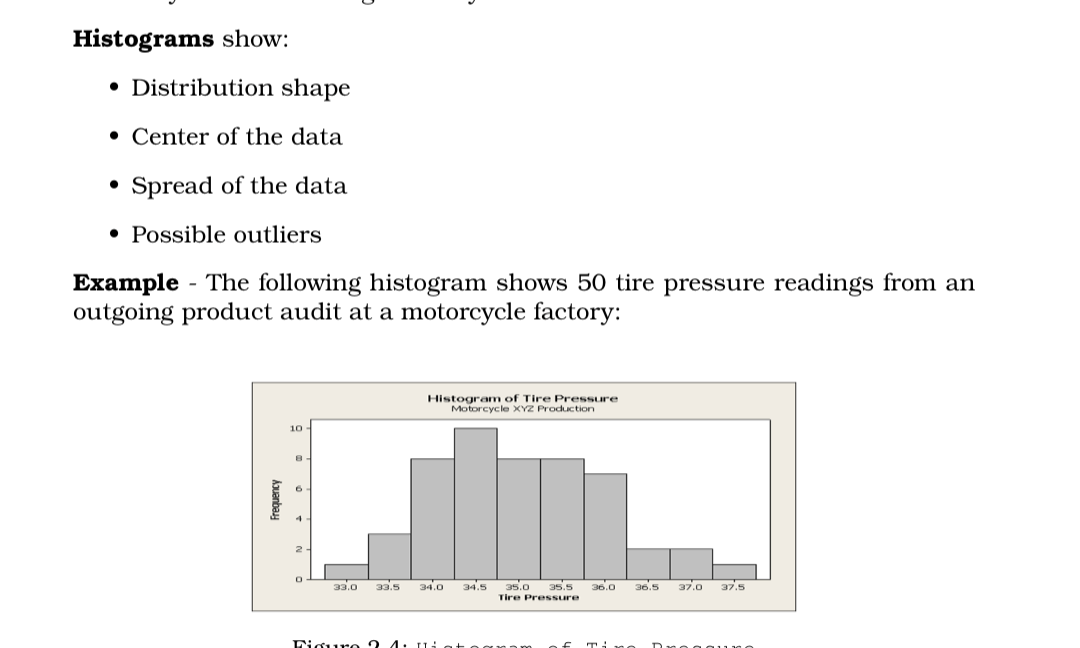
*The bars touch, and exact data are not visible. however effective for large datasets
you can describe the overall pattern of a histogram by its shape, center, and variability
How is the shape of a distribution described for a historgram?
by its number of peaks and possession of symmetry (skew or not)
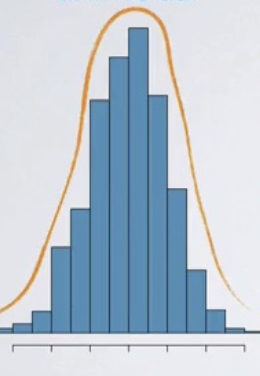
Symmetric distribution
A bell-shaped, a distribution where the right and left sides of the histogram are approximately mirror images of each other
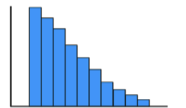
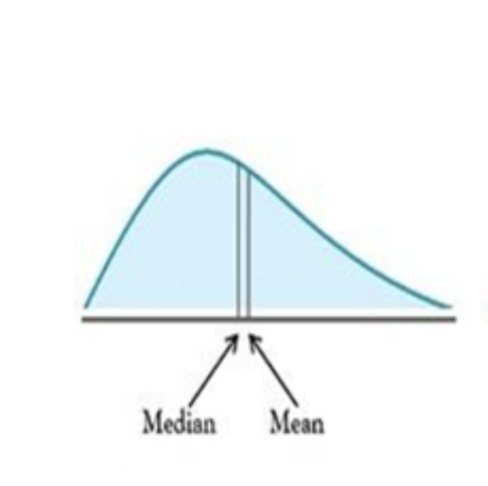
Skewed right / positive skew
a distribution where the right side extends farther out than the left side
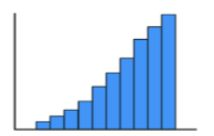
skewed left / negative skew
a distribution where the left side extends farther out than the right side
Mode
most common value in a data set
unimodal
one peak in the data
Bimodal
two peak in the data
measures of the center of a quantitative data
1) mean
2)median
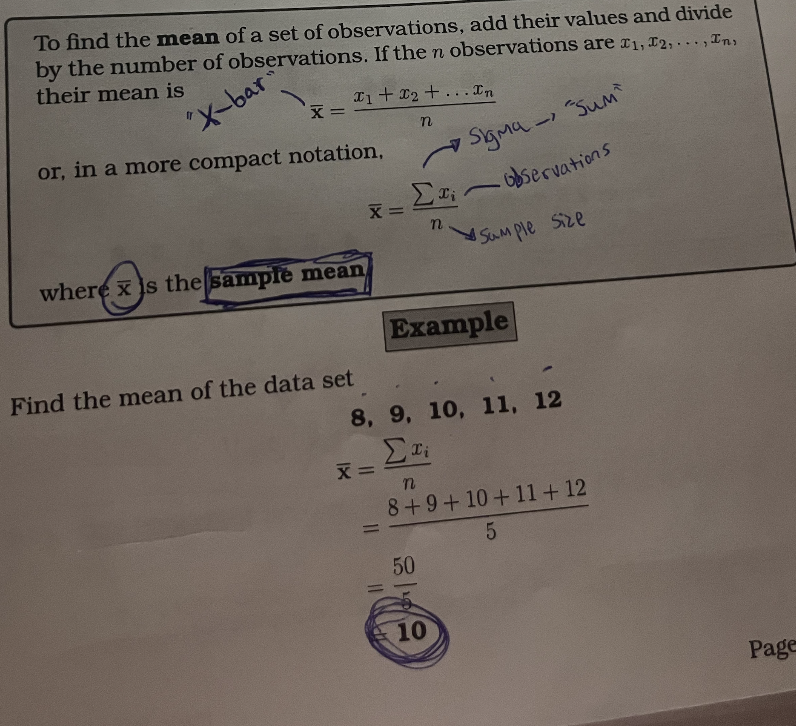
1) Mean
The average of the data. The most commonly known and frequently used measure of center.
To find the mean, divide the sum of observed values by the number of observations
Sample mean (mean of a sample) symbol
Population mean symbol
Basic properties of the mean
-also known as the balancing point
-If the collection consists of values of a variable measured in specified units, then the mean has the same units too
-Usually, the mean is not equal to any value that was observed in the sample
-for skewed distributions, the mean is pulled in the direction of the longer tail
-MEAN IS SENSITIVE TO OUTLIERS (unusaully large or unusaully small observation)
2) Median
The midpoint (middle) of a distribution from smallest to largest
*If there is one center observation, the median is the center observation in terms of the ordered list
*If there are two center observations, the median is the average of the two center observation
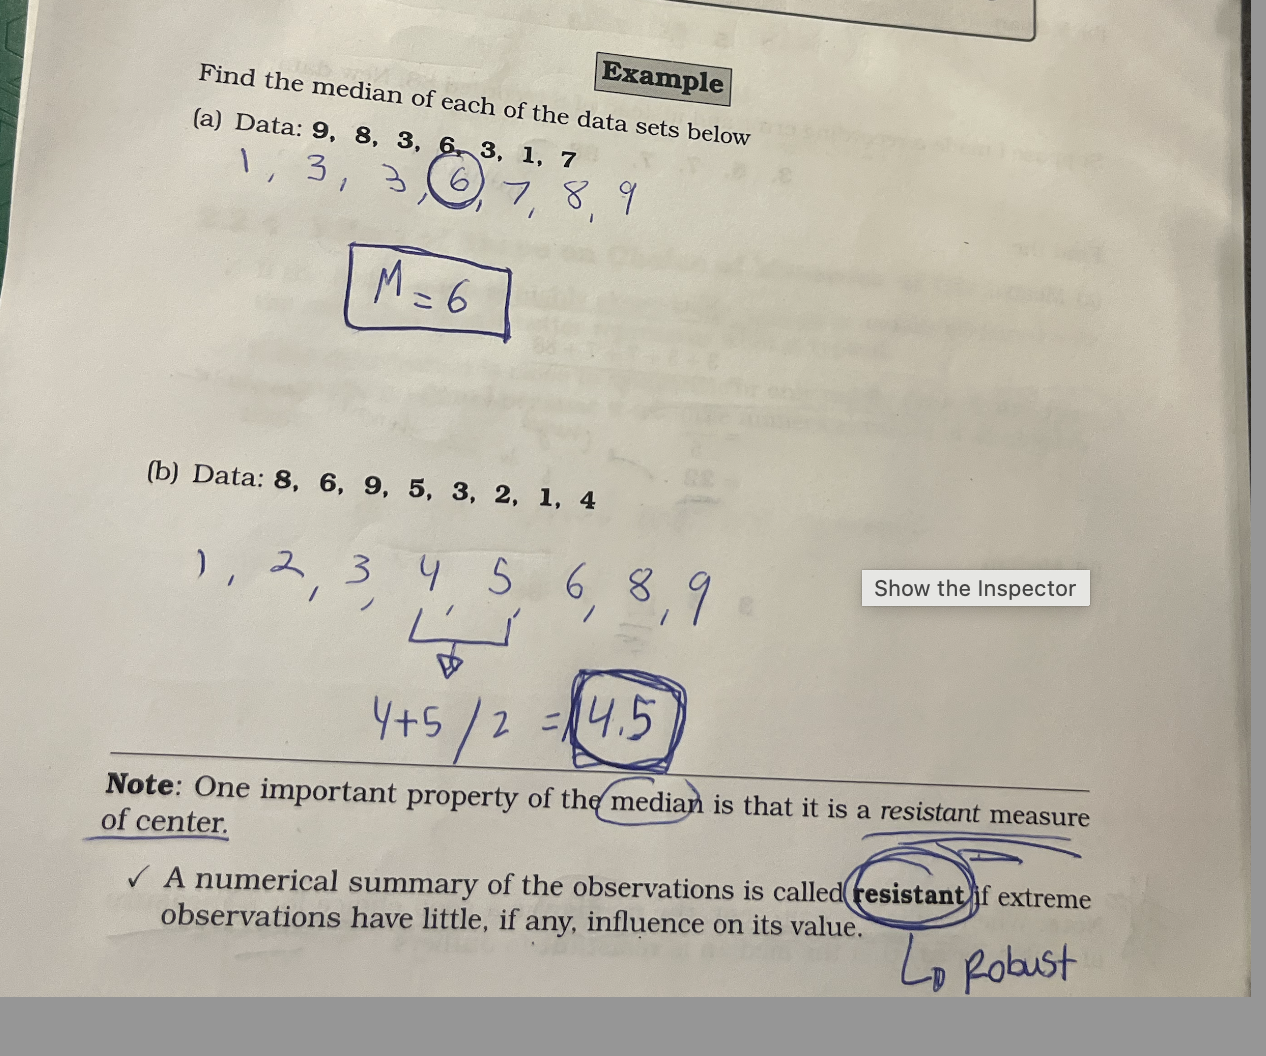
Property of median
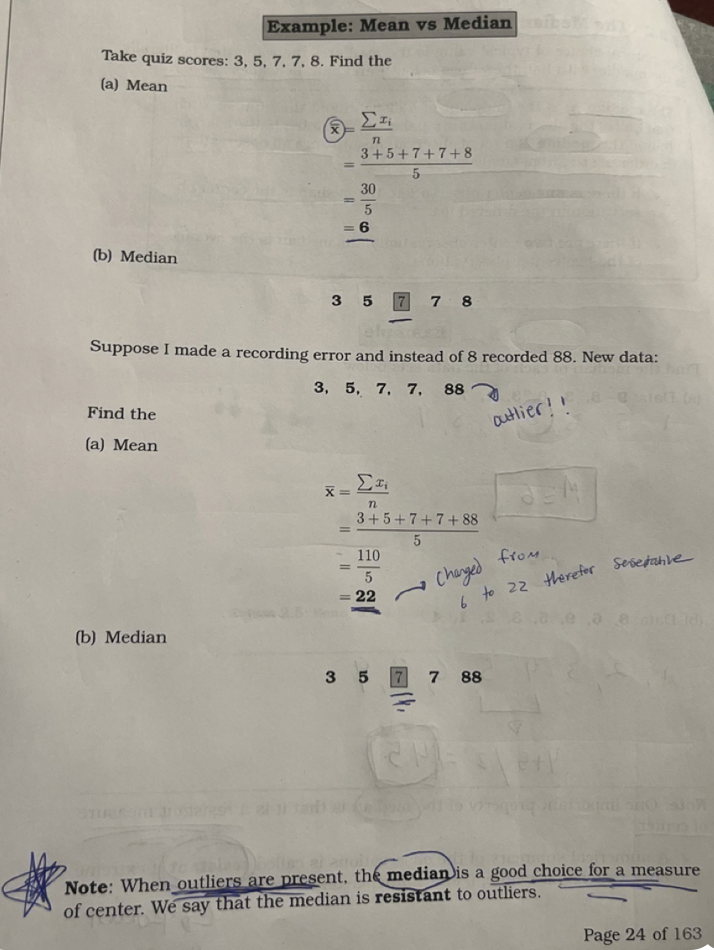
It is a resistant measure of center. It is resistant (robust) to extreme observation, which has little, if any, influence on its value, such as outliers.
good choice of measure of center when outliers are present
Mean vs Median example
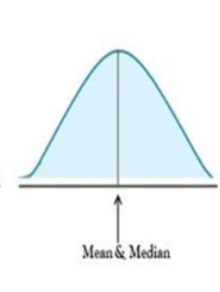
If a distribution shape is perfectly symmetric, the mean and median are?
The mean equals the median
If a distribution shape is skewed to the left,the mean and median are?
The mean is less than the median
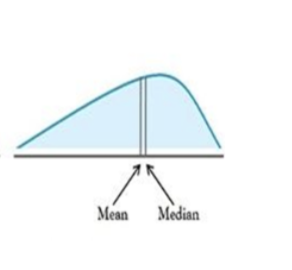
If a distribution shape is skewed to the right, the mean and median are?
The mean is greater than the median
Which choice of measure of center is best if the distribution is highly skewed
The median
Which choice of measure of center is best if the distribution is symmetric or one midly skewed
The mean
Which choice of measure of center is best if comparing a distribution that is one symmetric and one skewed
Median
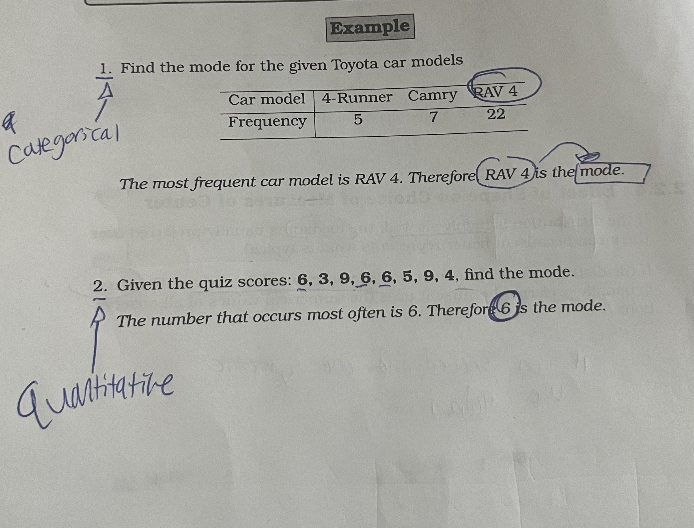
Mode
The value that occurs most frequently
*for categorical data, it is the category with the highest frequency
*for discrete quantitative data, the value that occurs most often
*continuous quantitative data, usually not meaningful to look for the mode because there can be multiple modes or no mode at all
Example of mode
Measure of variability of quantitative data
1) Range
2) Standard deviation
3) variance
4) IQR
Variability
describes how far apart data points lie from each other and from the center of a distrubution
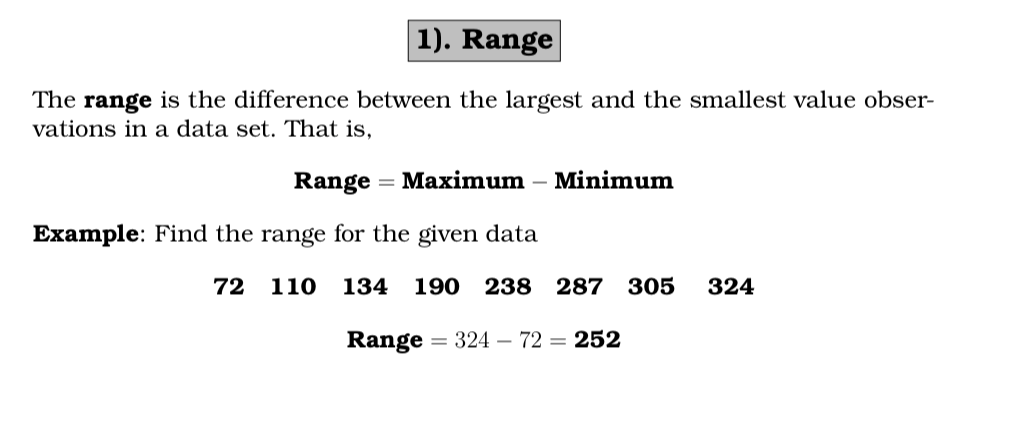
Range
The difference between the largest and the smallest value observations in a data set.
*however not a good measure of spread because it ignores other values in the data set, and it is affected by outliers-that is, range is not a resistant statistic
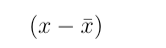
Deviation of an observation x from the mean x-bar is …
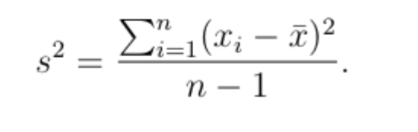
Sample Variance
The average squared deviation