data science
1/66
There's no tags or description
Looks like no tags are added yet.
Name | Mastery | Learn | Test | Matching | Spaced | Call with Kai |
|---|
No study sessions yet.
67 Terms
population
set of all possible observations of interest to problem at hand
sample
subset of population containing objects or outcomes that have actually been observed
parameter
describes a population (mean, standard deviation)
statistic
describes a sample
probability sampling
random selection
non probability
based on convenience
sampling with replacement
each data unit in the population can reappear in the sample
sampling without replacement
each data unit in population appears once in the sample
simple random sampling
equal chance
stratified
divide into homogenous groups, sample each
cluster
divide into heterogenous clusters then sample clusters
why sampling is important
generalise population
prevent bias
reduce computation cost
cross validation
a sampling technique used during assessment phase to assess how well the model generalises to unseen data
how a cross validation works
split into k fold
train on k-1 folds
validate on remaining folds
repeat k times
average performance
aspects of data quality
accuracy, completeness, consistency, timeliness, validity, uniqueness
variance
{(n-mean)² + (n1-mean)² …}/ n-1
standard deviation
square root of variance
histogram
displays the frequency with which values occur in data
Lq
n+3/4 if odd
n+2/4 if even
Q1
X(Lq) if lq is integer
{X(Lq-0.5)+X(Lq+0.5)} / 2 if Lq is not integer
Q3
If Lq is integer: X(n+1-Lq)
If Lq is not integer:
X{(n+1 - Lq - 0.5)+X(n+1-Lq+0.5)}/2
fences
step = 1.5(Q3-Q1)
UIF = Q3+step
LIF = Q1- step
Outlier formula
(>1.5XIQR from median)
what statistics to use on symmetrical data with no outliers
standard deviation, mean
what to use on skewed data
median, quartiles
sample space
set of all possible outcomes of an experiment
event
sub set of the sample space
product rule
P(A or C) = P(A+C)/P(C)
addition rule
P(A or C)=P(A)+P(C)-P(AandC)
system failure (mutually exclusive)
P(System fail)= P(b1)+P(b2)…
parallel systems(all components must fail)
P(system failure)= P(b1)*P(b2)…
probability density function(PDF)
shows where the variable is most or less likely to fal
cumulative distribution function
probability that the random variable is less than or equal to a certain value
binomial distribution
fixed number of trials
each trial has two possible outcomes
probability of success is equal for each trial
you are counting number of successes
uniform distribution
all outcomes are equally likely
can be discrete or continuous
e.g rolling a die
poisson distribution
measuring number of events that occur within time space or area
events occur independantly
average rate of occurrence is constant
exponential distribution
measuring the time or distance between events
events occur continuously and independently at a constant average rate
always positive values
binomial distribution mean and variance
mean= n*p
variance=n*p(1-p)
me=number of trials
p=probability of success in each trial
uniform distribution mean and variance
mean=(a+b)/2
variance = (b-a+1)²-1/12
if x is uniformly distributed between a and b variance=(b-a)²/12p
Poisson mean and variance
mean and variance = lambda
lambda = average number of events per intervalex
potential mean and variance
mean=1/lambda
variance=1/lambda²
lambda = events per unit time
normal distribution
continuous data
bell shaped curve
values cluster around meann
bayes theorem
P(A∣B)=P(BIA)P(A)/P(B)
probability plots
graphical tool to determine if a set of empirical observations comes from a population
compare CDF calculated for sampled values with the theoretical CDF
scatter plot is made to compare values
estimate the CDF from the data with n observations
F(xi)=P(X<=xi)=number of observations<=xi/n
sign test
non parametric
test for median of a random sample or median of the difference of two random samples
nu
null hypothesis
assumption is correct
p<=0.05
reject null hypothesisp
p>0.05
fail to reject
issues with a small sample
central limit theorem does not apply
standard deviation of the sample is not a good approximation of population standard deviation
solution to small sample size (parametric analysis)
if population is approximately normal, calculation of confidence intervals can be performed using student t distribution
student t distribution
tn-1= √n(X-u)/s
for a 2 sided confidence interval the confidence interval length L=
L=2(tn-1,a/2)s/√n
simple regression model
yi=Bo+B1Xi+Ei
yi=observations of dependent variable
xi= observations of independent
Ei= term error
Bo=y-intercept B1 is slope of true model
how to find one of best fit
using calculus solution is
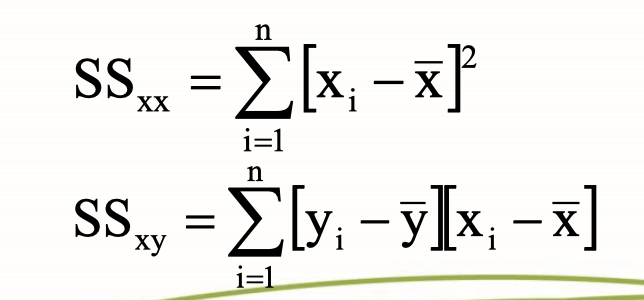
b1=SSxy/SSxx
b0=ȳ-b1x̄
x̄ and ȳ are sample means
SSxx and SSxy
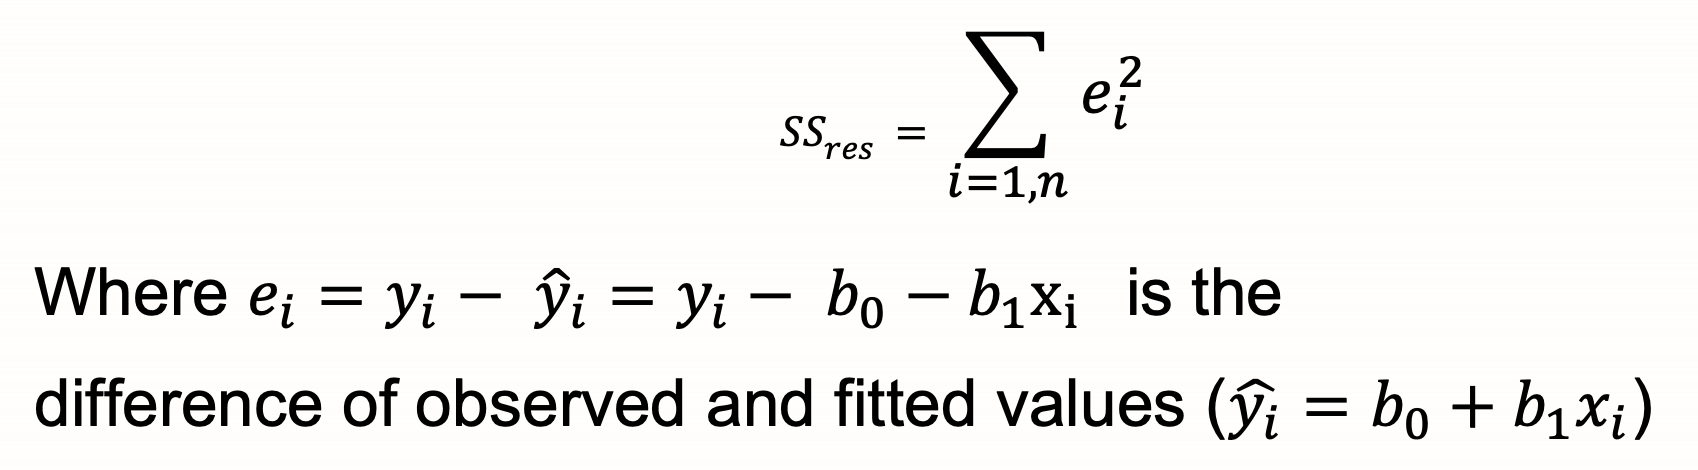
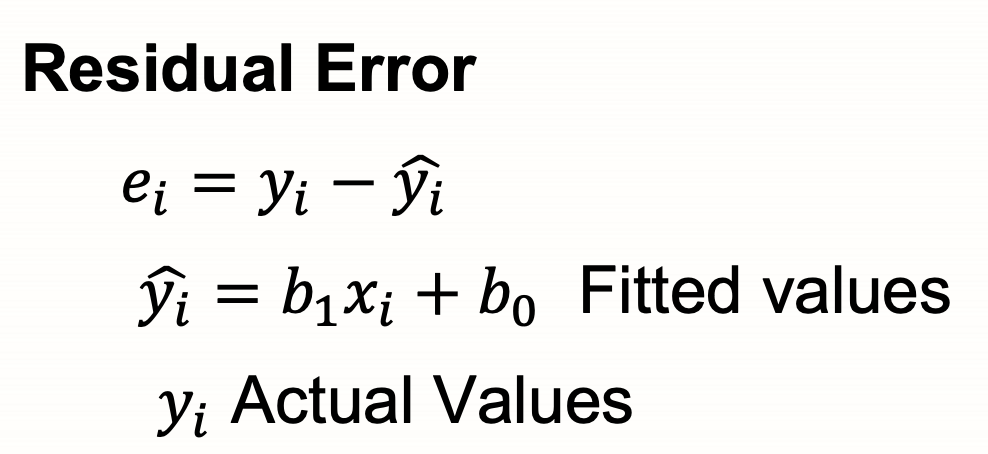
how to measure error
residual error
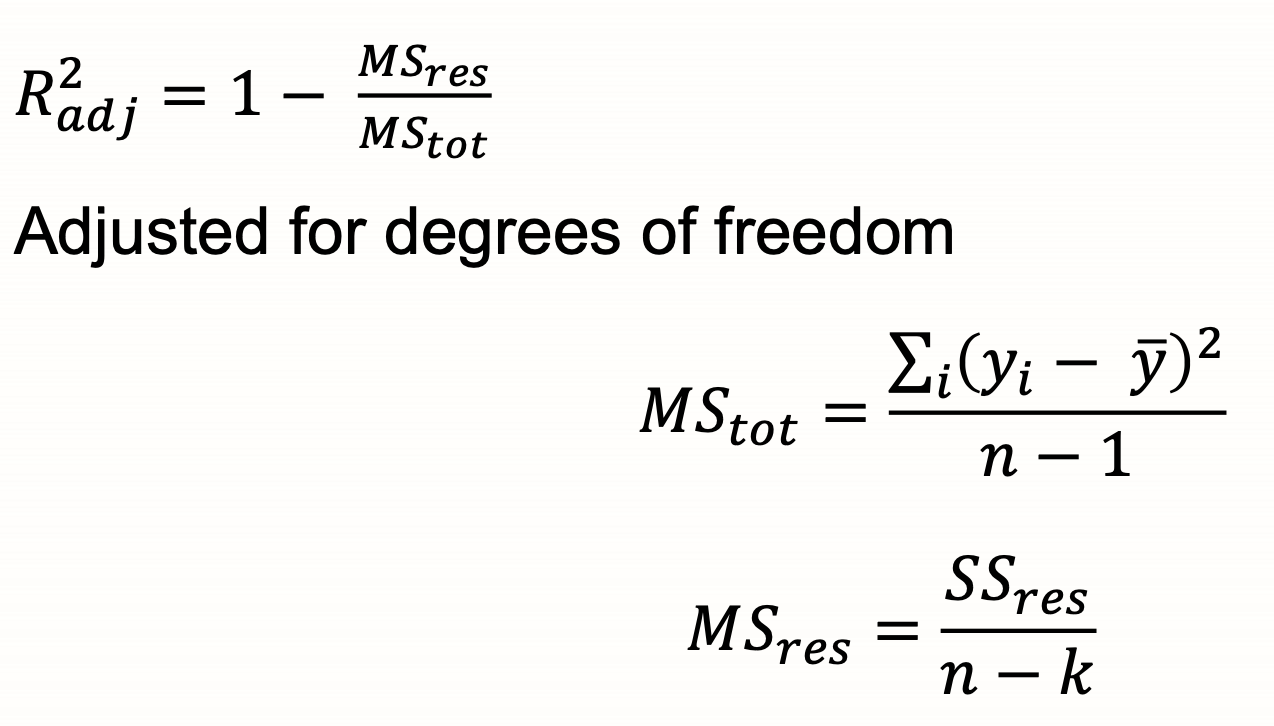
mean squared error MSres
SSres/n-k
n=error degrees of freedom
k=pairs of observations
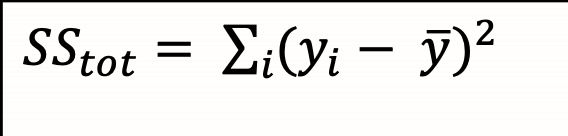
SStot (total sum of squares)
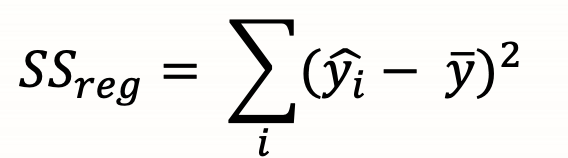
SSreg (Regression sum of squares)
SSres (sum of squared residuals)

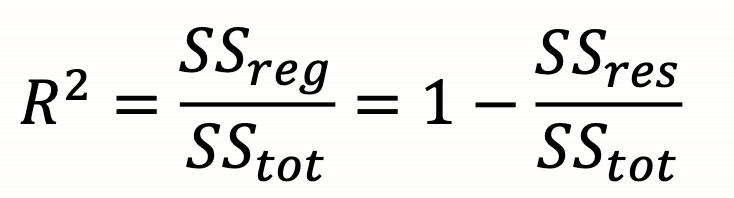
R²(Proportion of total variation in y accounted for by regression line)
Goodness of fit statistics-adjusted coefficient of determination
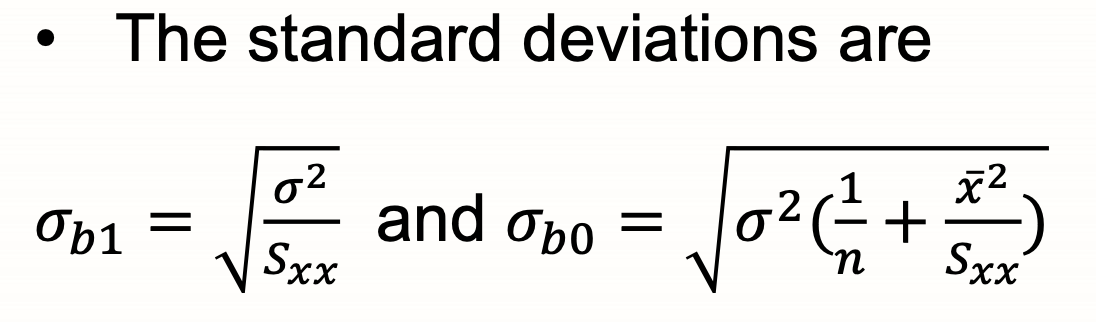
Distributions of parameters
provided the residuals are normally distributed N(0,sigma²) the standard deviations are
confidence intervals of parameters Bo B1
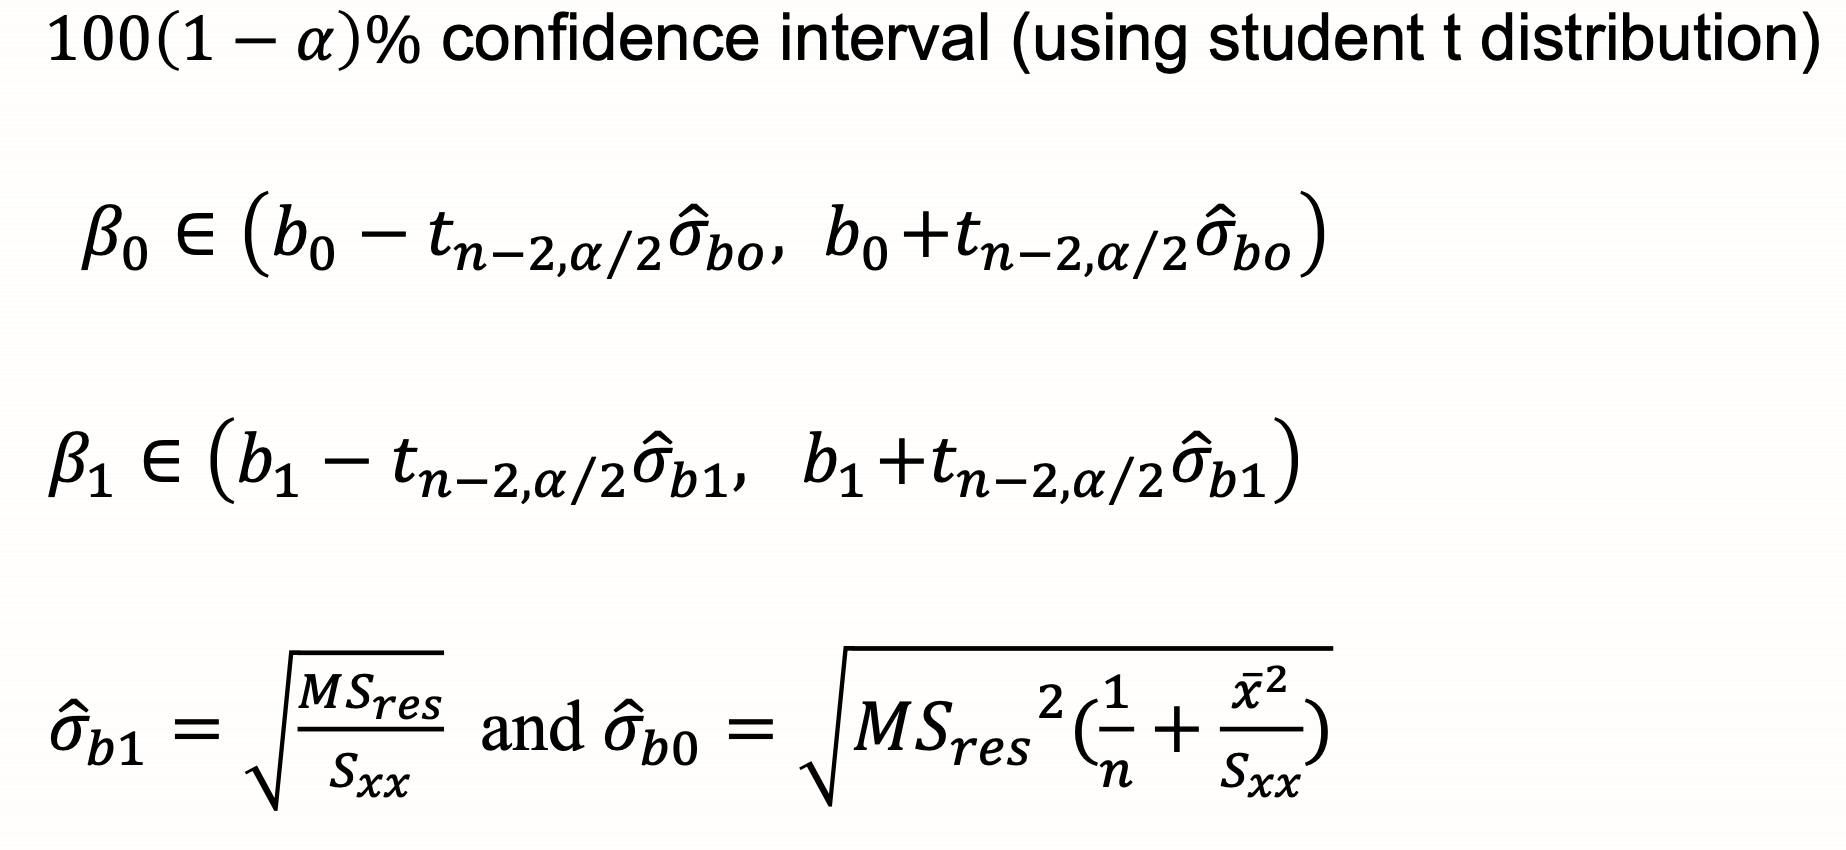
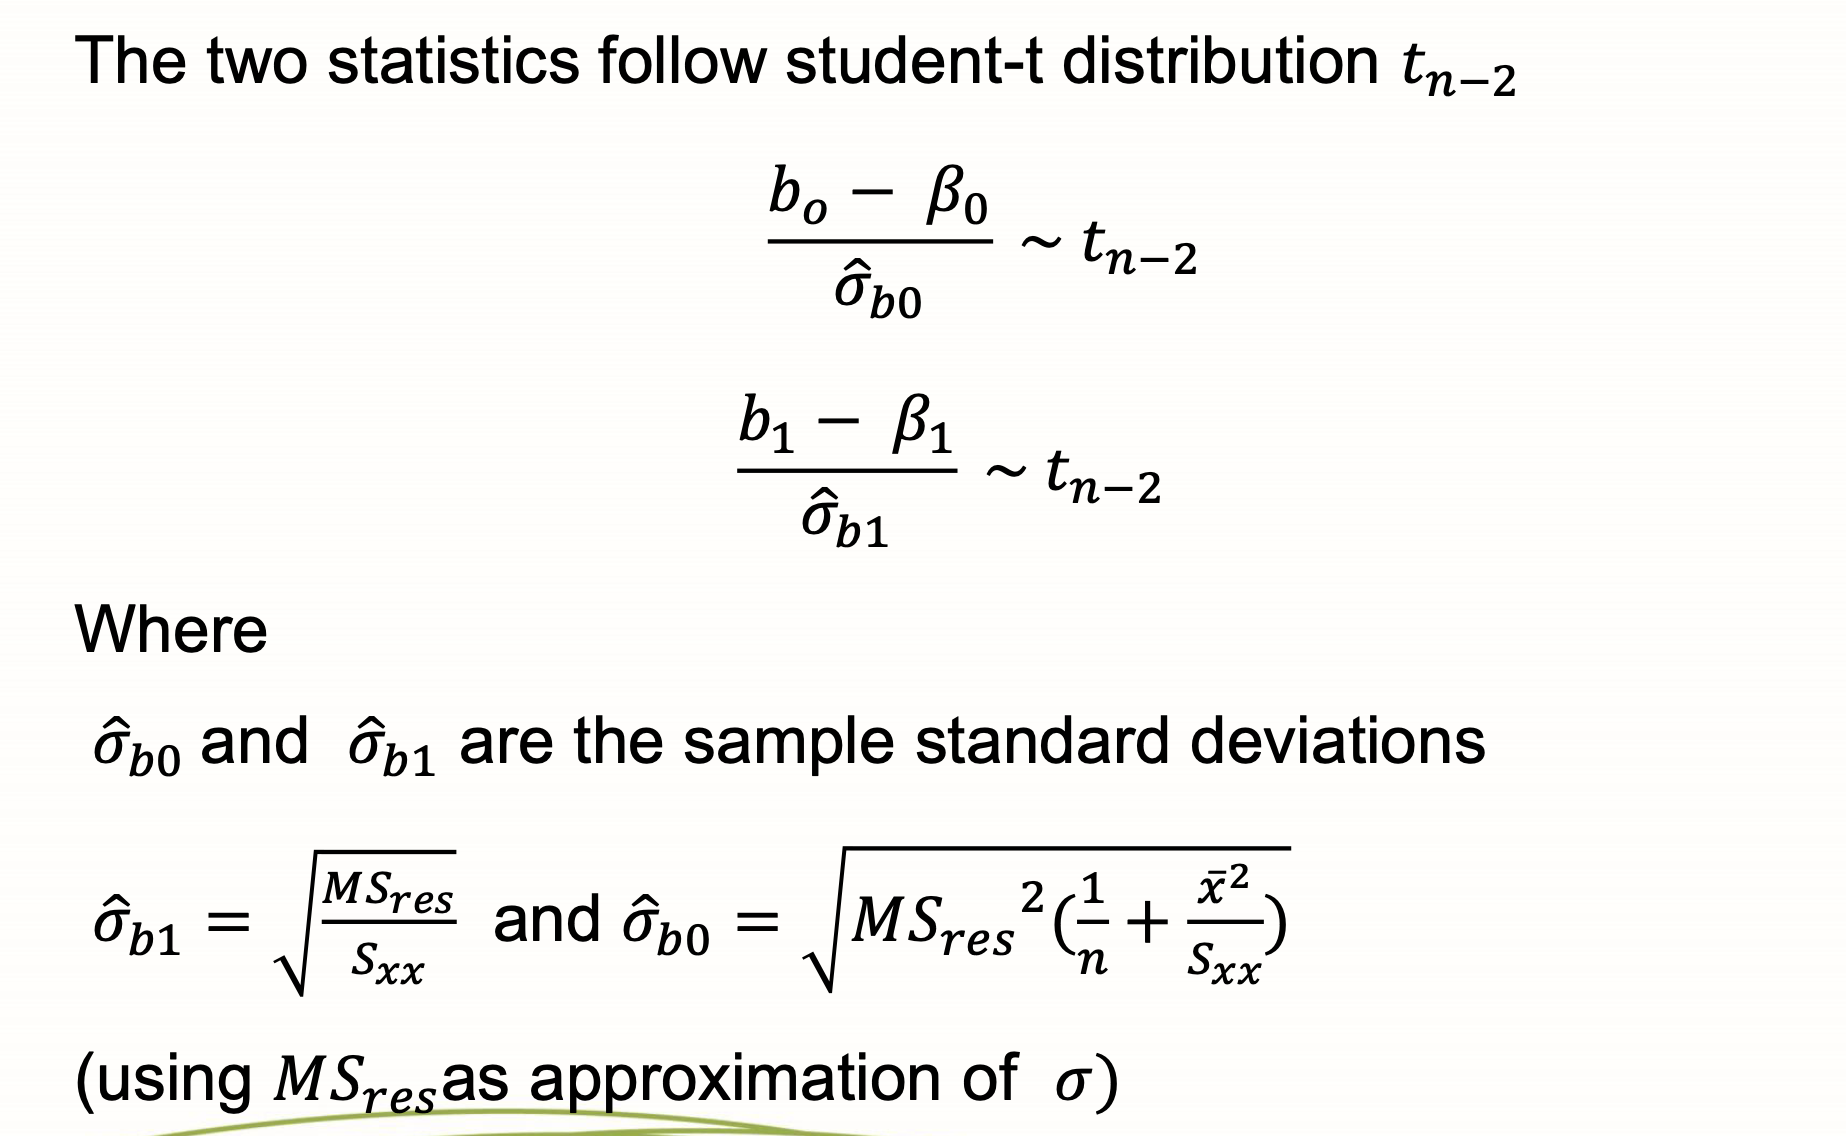
distributions of parameters B0 B1
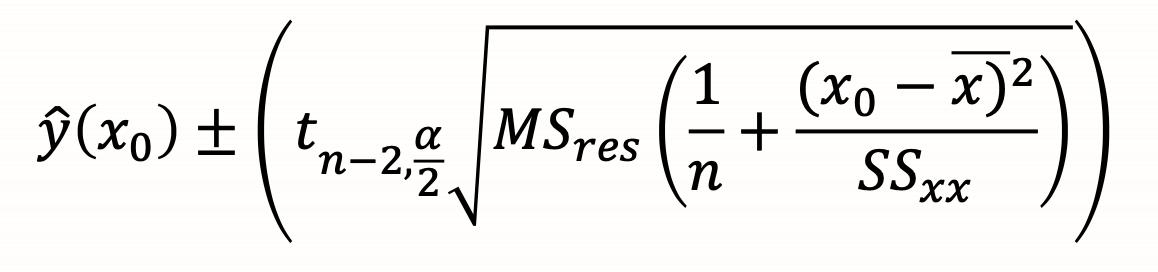
confidence intervals of regression line