Statistical Tests + Maths in biology
1/22
There's no tags or description
Looks like no tags are added yet.
Name | Mastery | Learn | Test | Matching | Spaced | Call with Kai |
|---|
No analytics yet
Send a link to your students to track their progress
23 Terms
What is the standard deviation?
A measure of how spread out all your repeats are from the mean.
What are the advantages of using the SD instead of the range?
SD shows the spread of data around the mean whereas the range only shows the difference between the highest and lowest values.
SD reduces the effect of anomalies, whereas the range includes it.
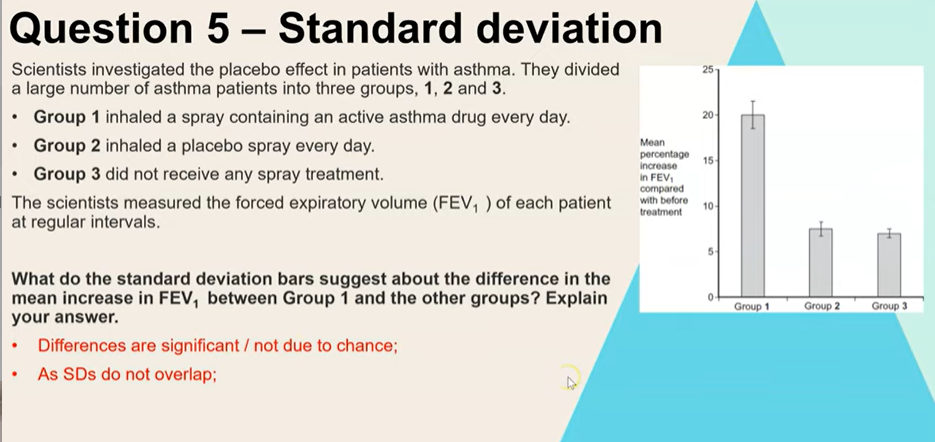
SD can be used to indicate whether a difference between results is significant.
Why would the standard deviation be more useful for a conclusion?
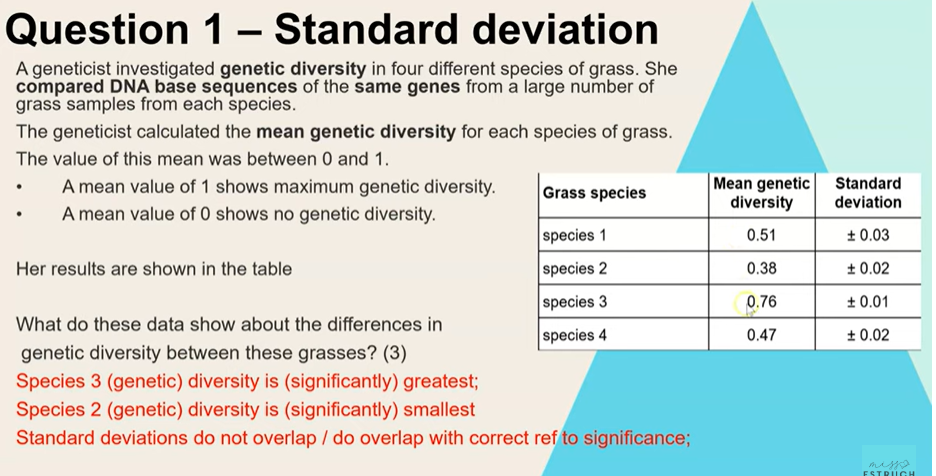
No overlap indicates that it is likely to be a significant difference (can’t be 95% confidence without the use of statistics).
If there is an overlap, that indicates that there is likely not to be a significant difference between these means.
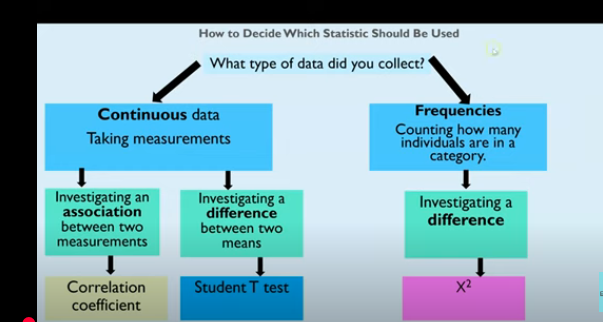
How to decide which stats test should be used?
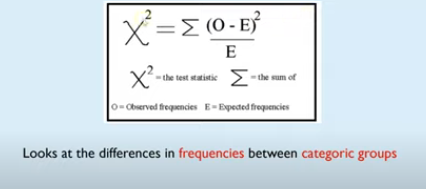
Chi squared
Justify choice of hypothesis
Write a null hypothesis
Write a conclusion
Formula for Chi-squared
What is the p value?
0.05
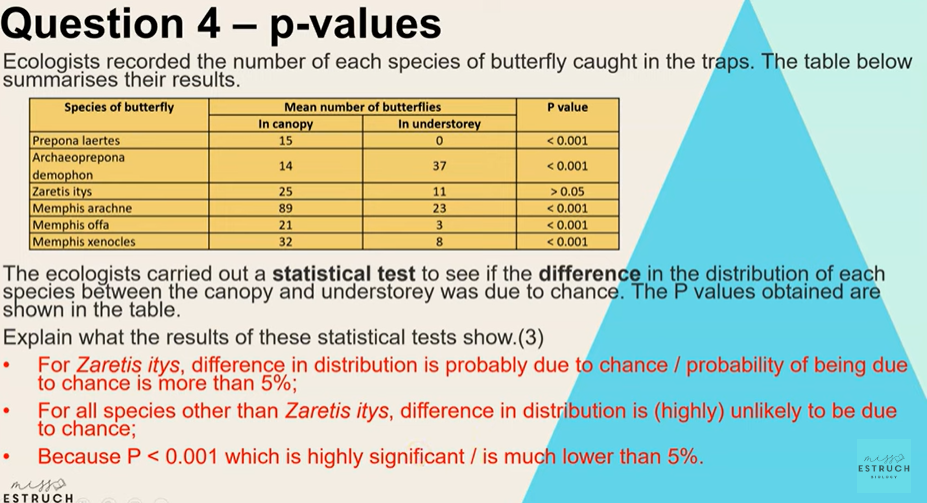
Refers to the less than 5% probability that the results are due to chance.
How to calculate degrees of freedom?
n-1
n is number of categories
look at critical value associated with this and see if calculated value exceeds this.
If it does then there is less than 5% probability that the differences are due to chance → reject null hypothesis.
If not, then there is more than 95% probability that differences are due to chance → accept null hypothesis.
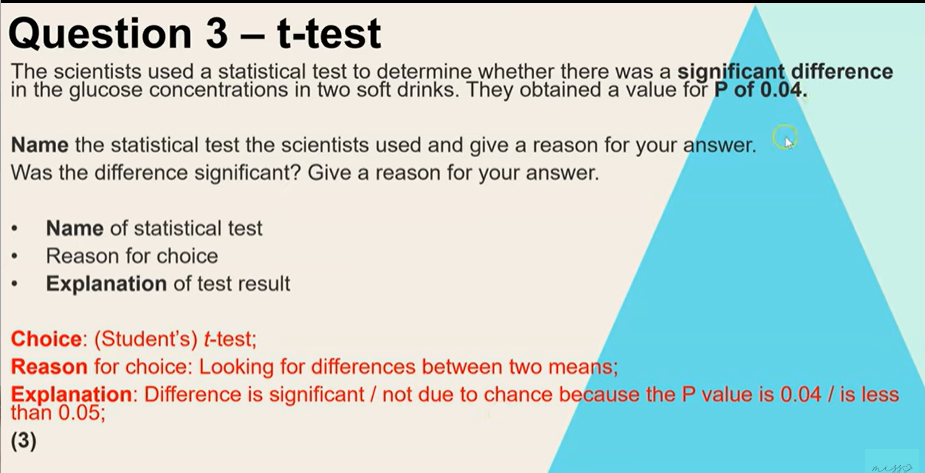
Student T test
Justify a choice of statistic: Compare 2 mean averages
Write a conclusion: less than 0.05= likely to not be due to chance as it shows significant change.

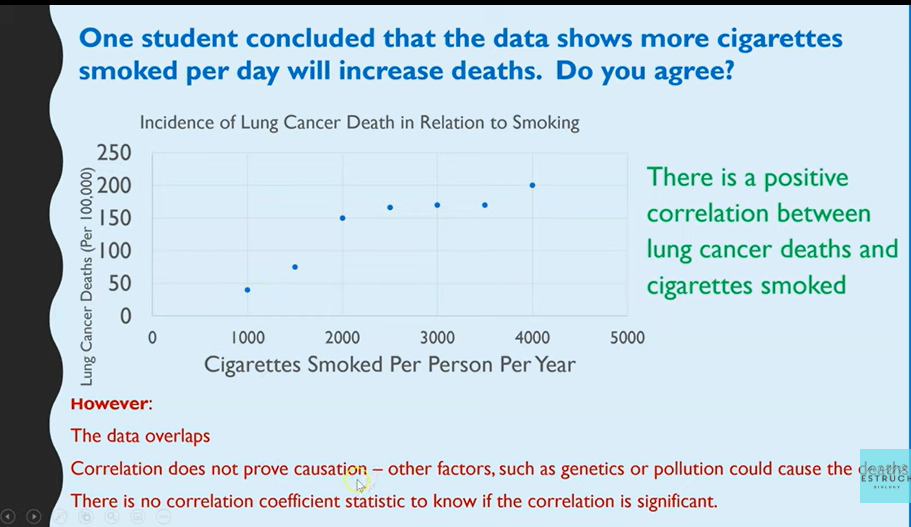
Interpret information risk factors and lung disease
What’s the point of a dilution?
Enables you to make solutions with very low concentrations, without having to measure out very small volumes, this improves accuracy.
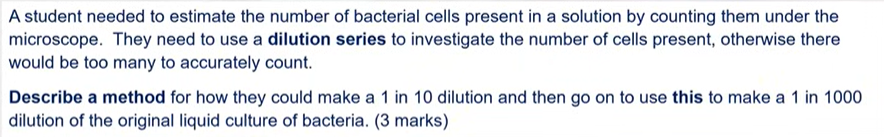
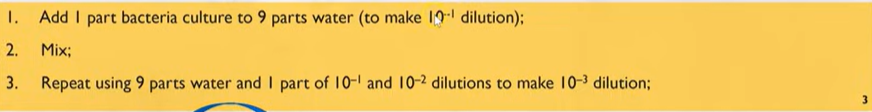
Dilution series calculation

Standard Deviation Question
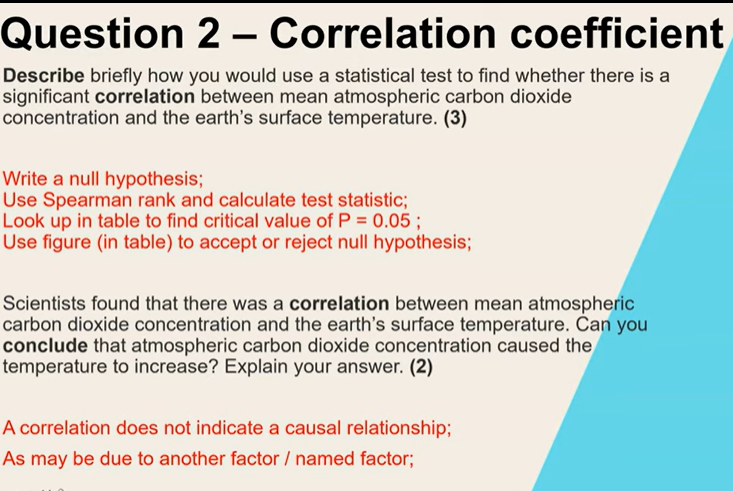
Correlation coefficient Question
T-test Question
P values question
Another standard deviation question
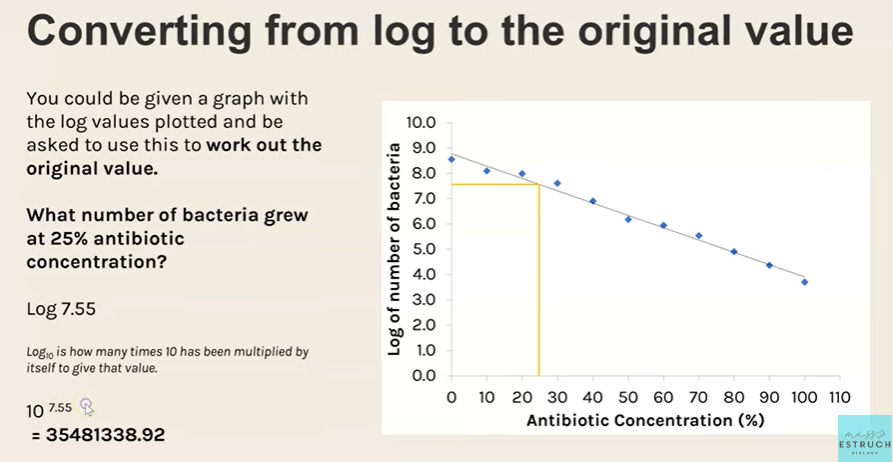
Why are logarithms/log scales used?
To help compare values that have a large range- comparing very small values to very large.
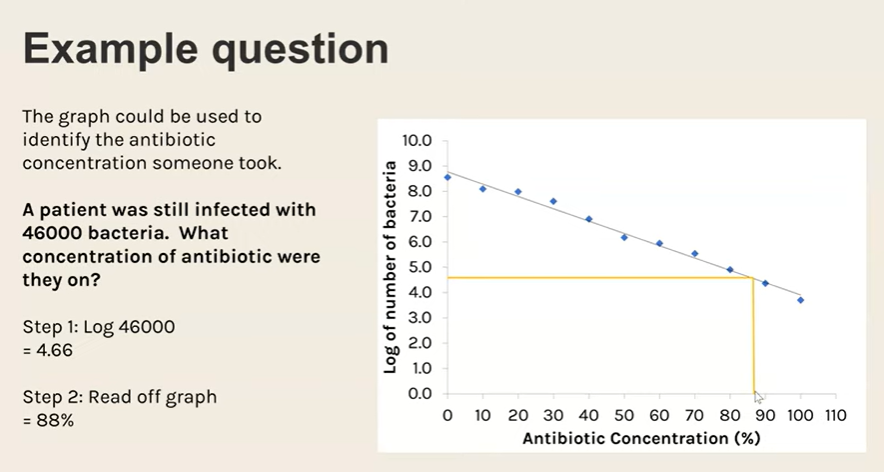
Calculate log 10s
10 to power of log for opposite
How to reduce uncertainty?
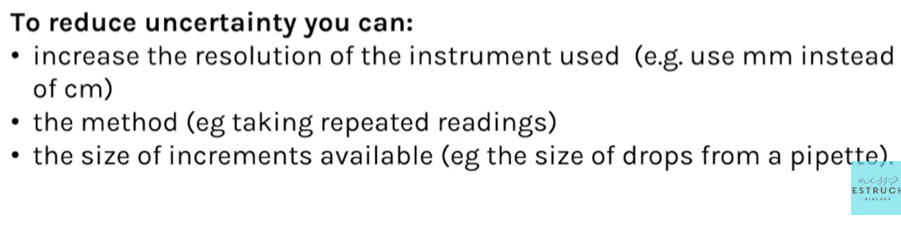
Multiple instances of measurement e.g. pile 10 leaves on top of each other and divide by 10 rather than doing 10 times. Divides uncertainty by 10.
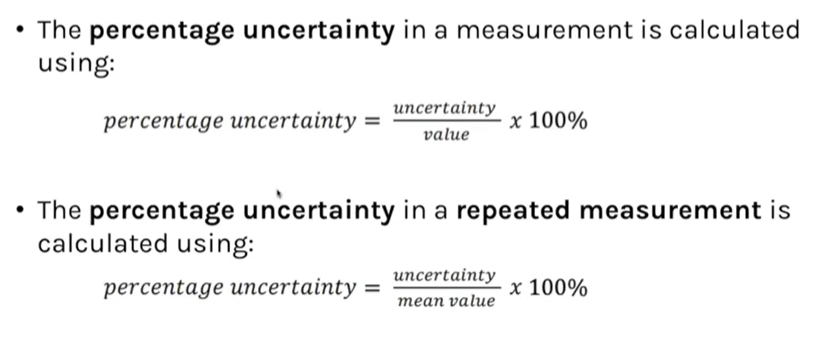
Uncertainty=
Range/2
Percentage uncertainty