AP Statistics 1.0-1.3
1/24
There's no tags or description
Looks like no tags are added yet.
Name | Mastery | Learn | Test | Matching | Spaced | Call with Kai |
|---|
No analytics yet
Send a link to your students to track their progress
25 Terms
Individual
objects described by a set of data. Ie: people, animals, things
Variable
any characteristic of an individual; can take on different values for different individuals
ie: grades, height, gender, salaries
categorical variable
places an individual into one group or category
ie: zip code, shoe size, data set
*bar graphs, dot plots, pie charts
Quantitative variable
takes numerical values for which it makes sense to find an average
*histograms, stem plots, dot plots
discrete
Quantitative data that can be counted
Ex: # of cats
Continuous
quantitative data that can take on any fractional value
Ex: distance, volume, height
marginal frequencies
% of data in a single row/column compared to total
(total of a row or column over the total total)
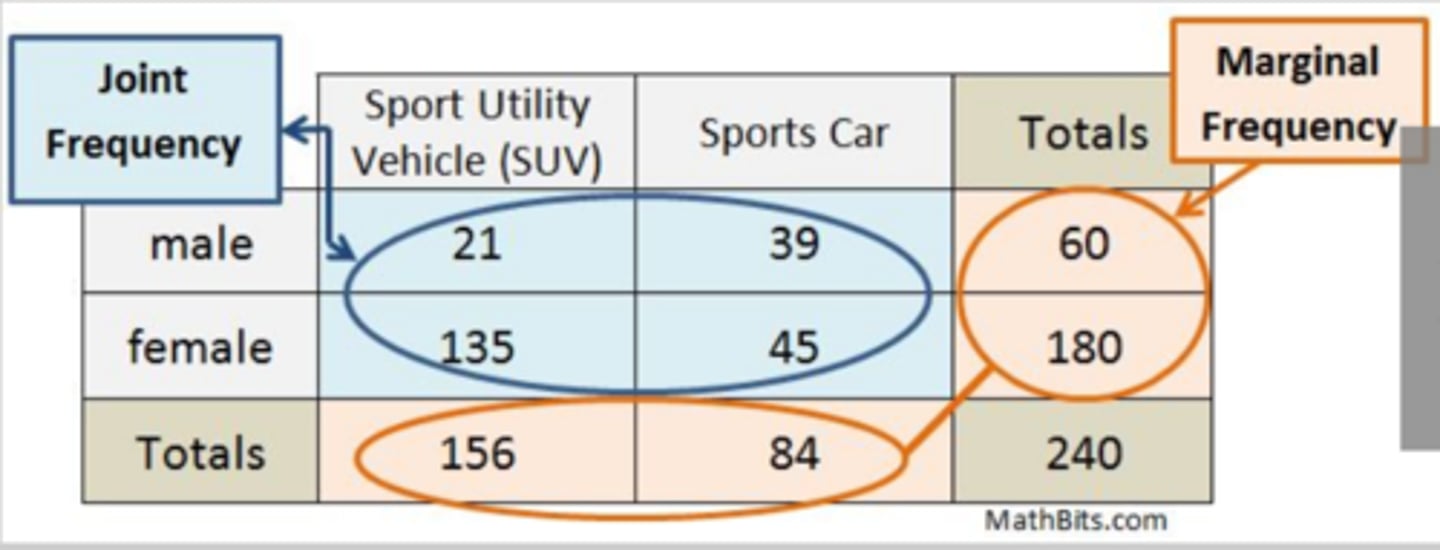
joint frequency
% of data in a single group compared to total
The key word for a joint frequency is AND
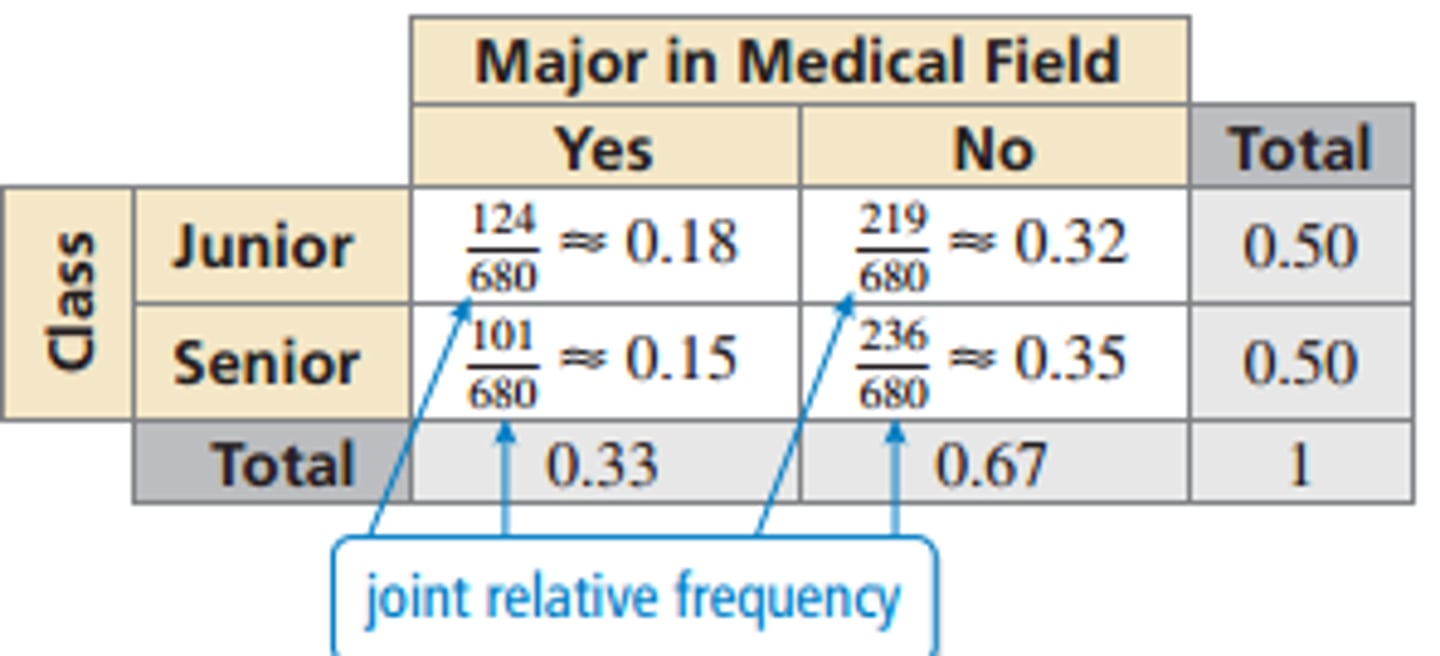
Relative frequency
% of data in a single category GIVEN specific group
Types of graphs for categorical data
pie chart, bar graphs, mosiac
one categorical variable
bar graphs and pie charts
two categorical variables
side-by-side bar graphs, segmented bar graphs
Types of graphs for quantitative data
dot plot, stem plot, box plot, histogram
S
U
C
S
Shape
Unusual Features
Center
Spread
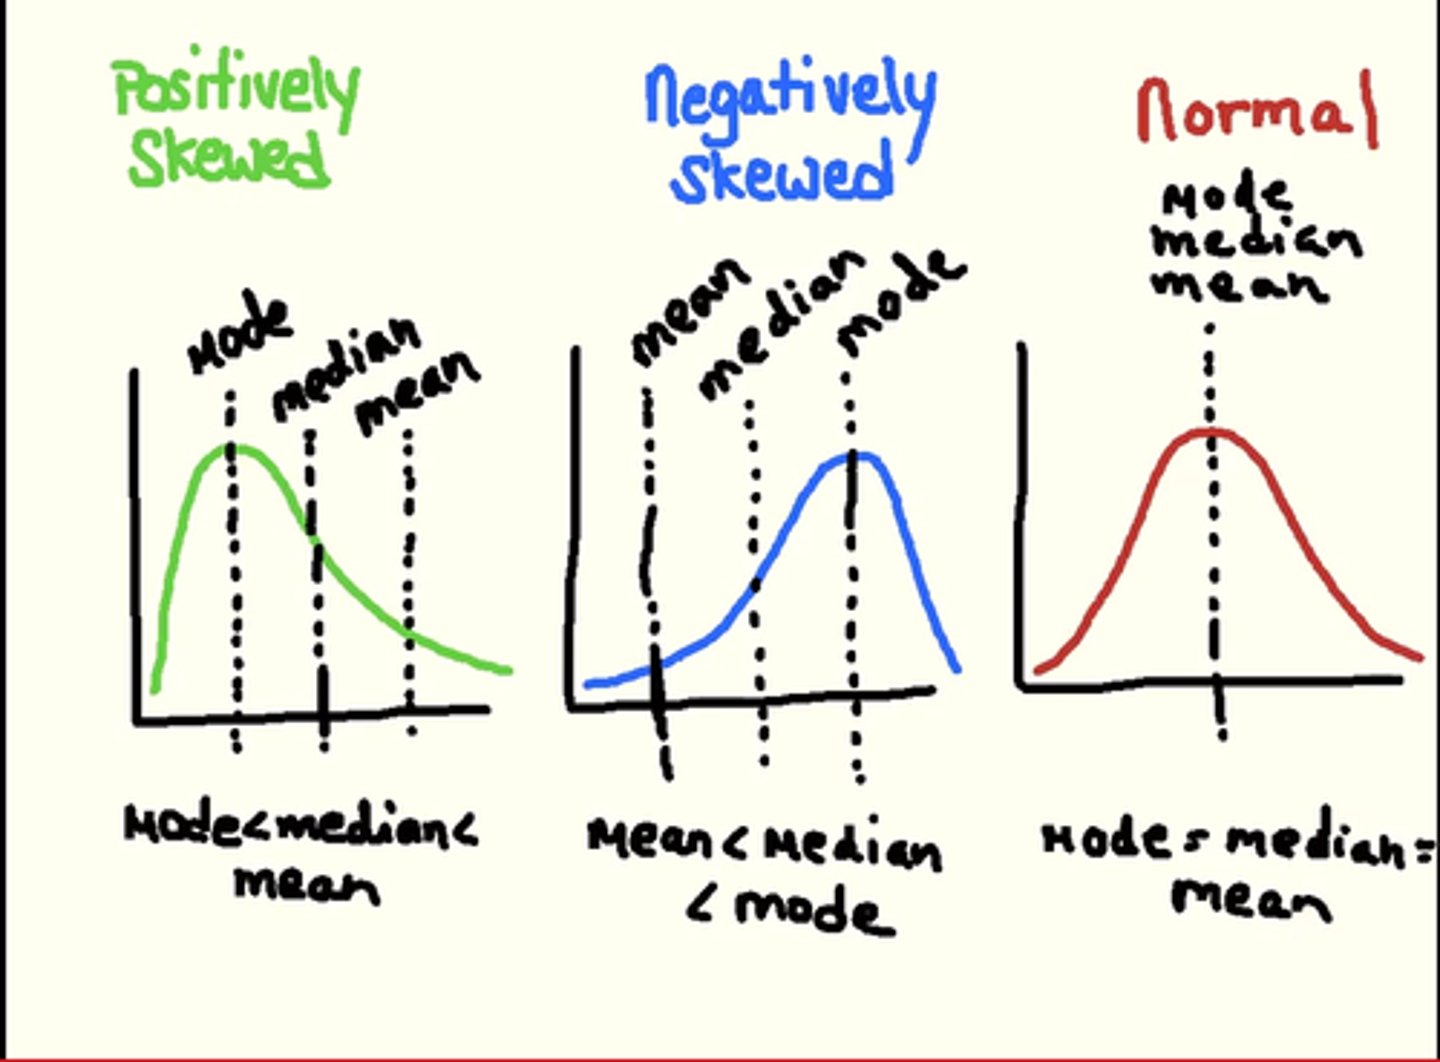
Shape
-Symmetrical
-Skewed left (tail is to the left, mean < median)
-Skewed right (tail is to the right, mean > median)
-Bimodal
Unusual features
outliers, gaps, clusters
Center
symmetric = mean
skewed = median
Spread
range of data, max-min
IQR
Q3-Q1
Interpret SD
The "context " typically varies by SD (with units) from the mean of X-bar/mean (with units)
Variance
SD squared
resitant
The median is not affected much by outliers
Non-resistant
The median and standard deviation are greatly affected by outliers
1.5 IQR Rule
Low outlier < Q1 - 1.5IQR
High outlier > Q3 + 1.5IQR
5 number summary
minimum, Q1, median, Q3, maximum