Class 8 (Unit 2)
1/13
There's no tags or description
Looks like no tags are added yet.
Name | Mastery | Learn | Test | Matching | Spaced | Call with Kai |
|---|
No study sessions yet.
14 Terms
Association vs. Causation (In the apartment example, there was a strong positive linear relationship between the size of an apartment and its monthly rent)
This does not mean that an apartment being larger causes its monthly rent to increase
observational study
study where individuals are simply observed. Thus the observed relationship could be due to one or more lurking variables
For rent for an apartment what are some lurking variables that may effect?
Neighbourhood where an apartment is located may be a lurking variable (maybe apartments in a nicer, more expensive part of the city are larger)
How do we avoid lurking variables?
perform an Experiment rather than an observational study
Experiment
values of the explanatory variable are randomly “assigned” to the sample units, rather than simply being observed prior to the study
Example: Does marijuna use cause teenagers to try illegal drugs?
This does not mean that using marijuna causes teenagers to use illegal drugs (we don’t even know if the teens using marijuna are the same ones who are using illegal drugs!)
There are other possible lurking variables we are not considering
One possible example of a lurking variable is the availability of drugs in different cities: teenagers in cities where illegal drugs are more easily available may be more likely to try them
How would we go about this marijuana experiment?
Gather a large group of teenagers who have never used any drugs (including marijuana) who are willing to volunteer to participate in the study
Randomly assign half of the volunteers to start using marijuana, and the other half would continue not to use it
After a fixed amount of time (e.g. two years), we could determine whether each volunteer subsequently used illegal drugs
If we still see a strong positive association, then we could say that marijuana use does in fact cause illegal drug use in teenagers
What would the outcome of the marijuana experiment be?
we still see a strong positive association, then we can say that marijuana use does in fact cause illegal drug use.
This is because we have diversified away the similarities within the two groups (those who use marijuana, and those who don’t) with respect to all possible lurking variables
For example, some teenagers who live in cities where drugs are easily available will be assigned to use marijuana, while others won’t. The same will be true for teenagers who live in cities where drugs are not easily available.
It is realistic to be able to perform this marijuana experiment?
Goodness no!!!! Ethical issues galore!!!
Are observational studies bad?
realistically, observational studies are often more feasible.
we just need to remember that association does not imply causation!!
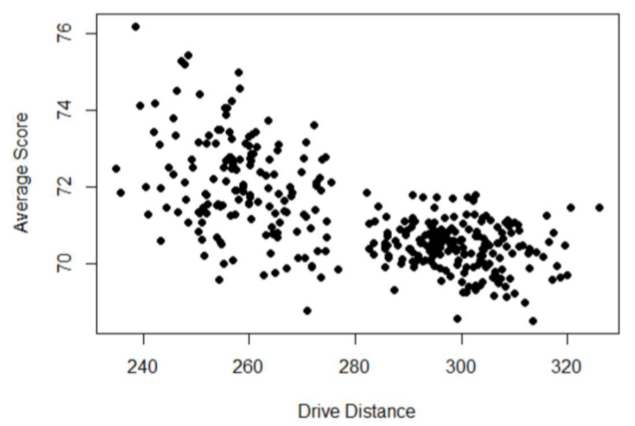
Categorical variables on a scatterplot (WARNING)
Sometimes, a scatterplot may actually be displaying two or more distinct relationships

Does this look linear?
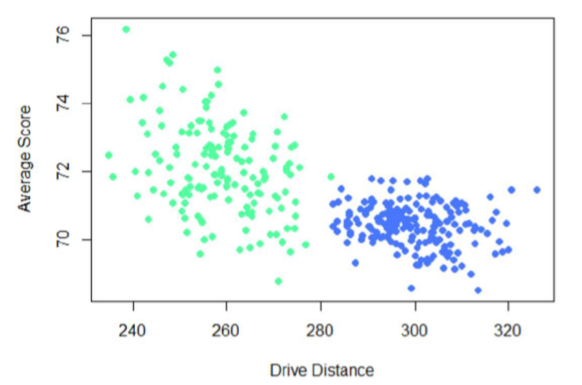
The relationship does not appear to be linear (it looks more exponential), but this scatterplot is actually displaying two distinct linear relationships: one for male golfers, and one for female golfers

Example: The average driving distance X and the average score Y are recorded for a sample of professional golfers (here, a “drive” is a golfers first shot on a golf hole)
Thus there are two di!erent categorical variables on the scatterplot that should be considered seperately (male and female golfers)
Here, a seperate regression line should be fit to the data for the male and female golfers
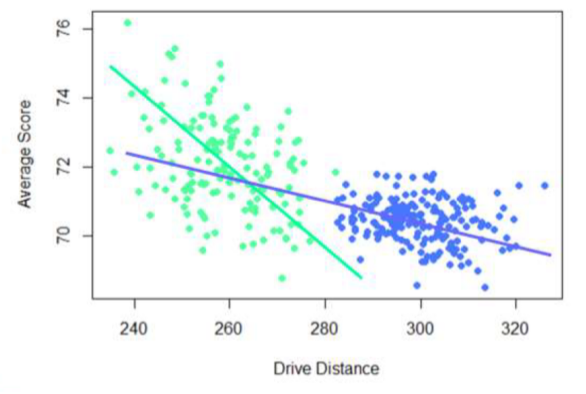
What do we have to be careful of when examining a relationship for scatterplot?
We need to be careful when examining a relationship to make sure that the data belongs to only one population