TOPIC #7: Chance variability (the box model)
1/16
Name | Mastery | Learn | Test | Matching | Spaced |
|---|
No study sessions yet.
17 Terms
Observed value = expected value + chance error, what does this mean?
Every time you perform a chance process, there is chance variability.
What is the law of large numbers/law of averages
the proportion of heads becomes more stable as the length of the simulation increases and approaches a fixed number called the relative frequency. the chance error in the number of heads is likely to be large in absolute size, but small relative to the number of tosses.
what does the box model show and what do you need to know?
it is a simple way to describe many chance processes like the distinct numbers that go in the box (tickets), the number of each kind of tickets, the number of draws from the box
why do we use the box model?
the box is the summary of the population (what is in there and in what proportions), we take draws from the box to create the sample.
what does EV and OV mean?
Expected value and observed value
what is the chance error in terms of ov and ev and what is it modelled by?
OV - EV. it is modelled by the standard error
(SE)
How do you calculate EV and SE
number of draws x mean of the box , root number of draws x SD of the box
the SD of the box is the …
population SD
how do you calculate the SD of the box? (Three ways)
formula: RMS(gaps) = root of the mean of the squared gaps
R: Popsd() with package rafalib
shortcut for simple binary boxes
if a box only contains two different numbers (“big” and “small”) then SD = (big - small)root proportion of big x proportion of small
How do you model the sum/mean of a sample for large number of draws from the box
normal distribution with mean - EV and sd = SE .
what are different types of histograms?
data histogram, probability histogram, simultation histogram
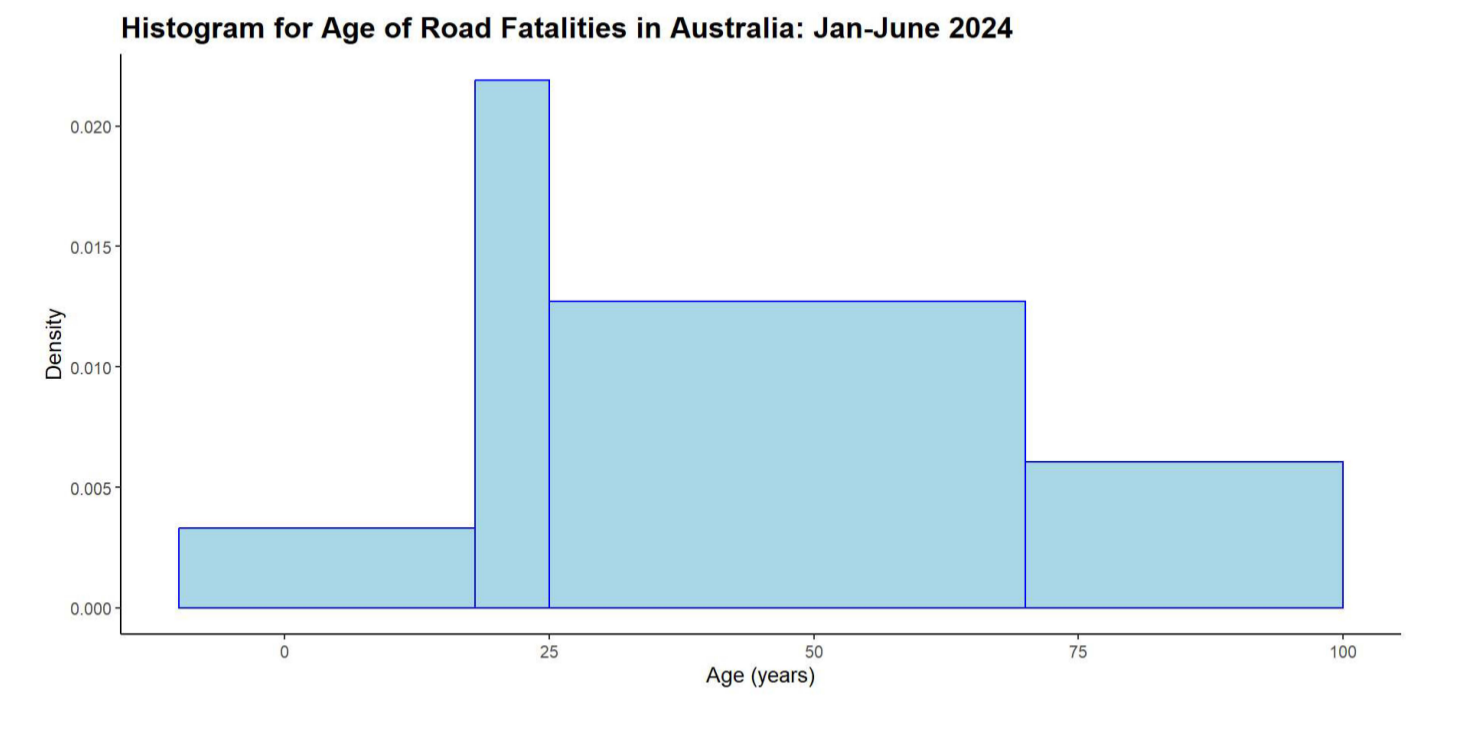
data histogram
represents the amount of data by area
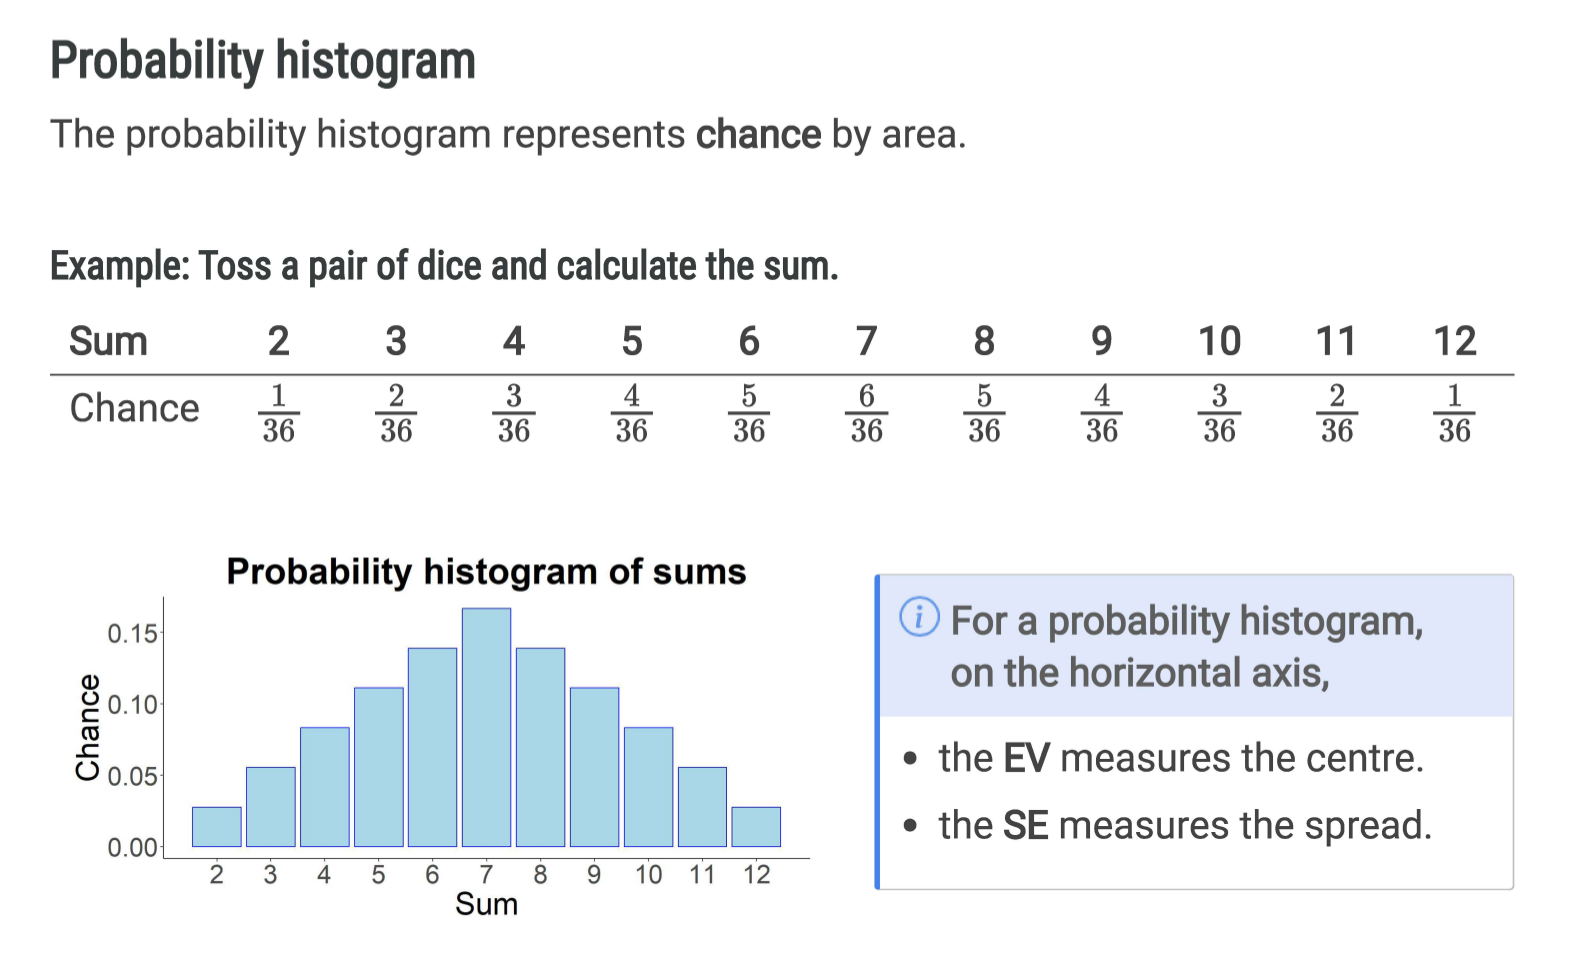
probability histogram
represents chance by area
simulation histogram
represents chance by area, for a simulation of a chance process
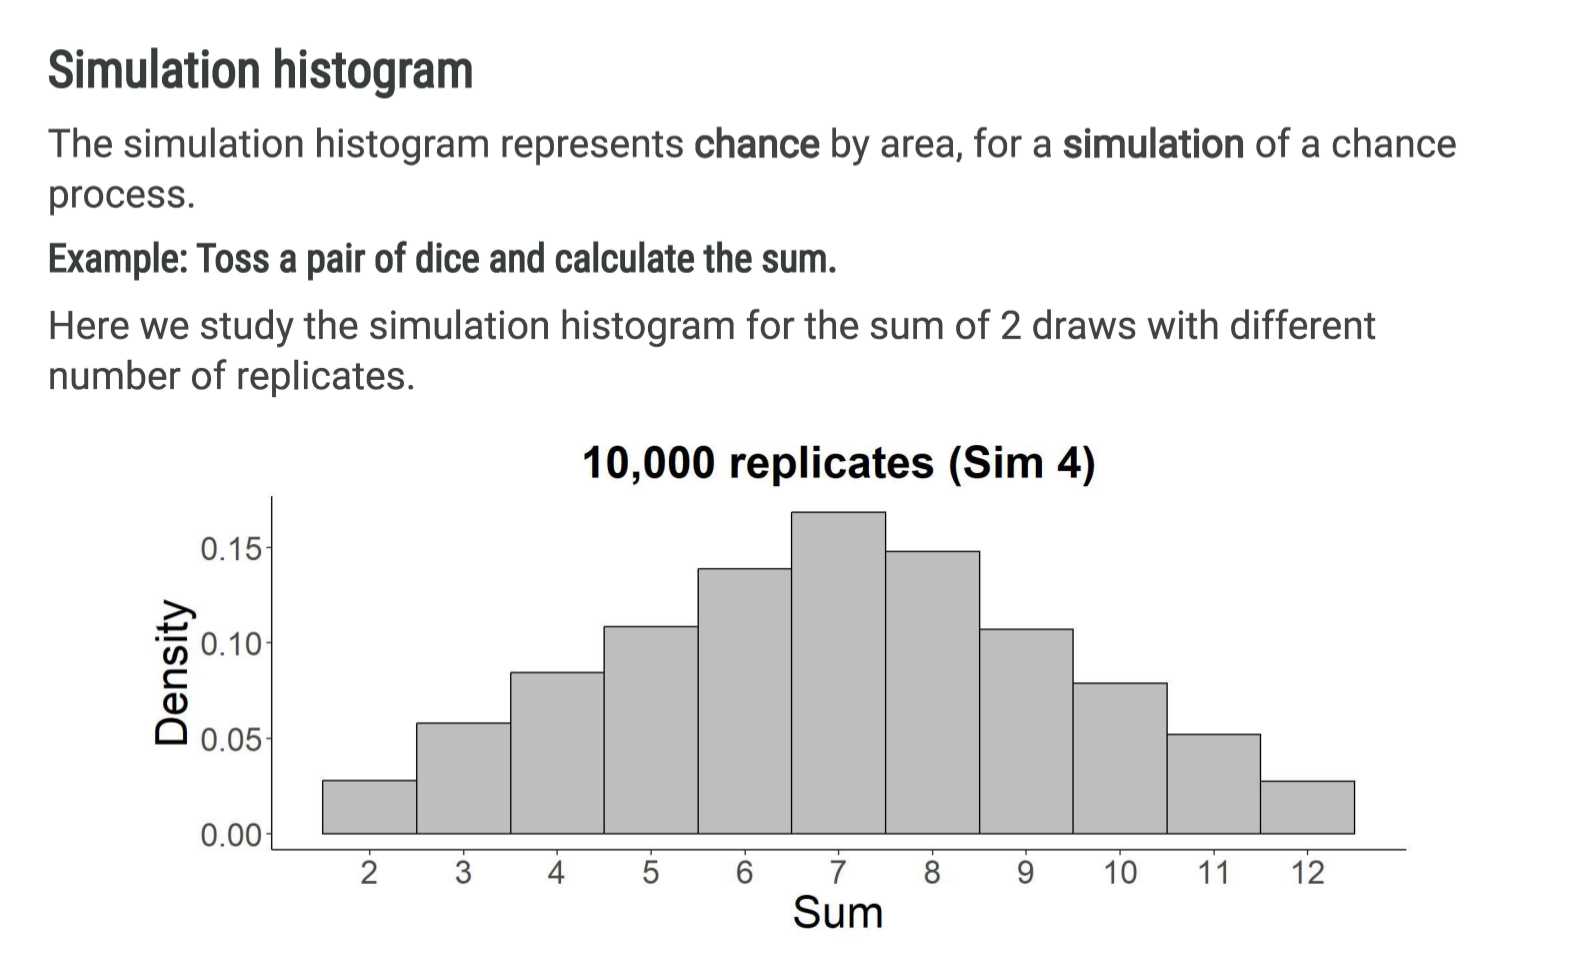
what is the relationship between probability and simulation histograms?
for repeated simulations of a chance process resulting in a sum, the simulation histogram of the observed values converges to the probability histogram
what is the central limit theorem?
when drawing at random with replacement from a box, if the sample size for the sum or average is sufficiently large then the probability histogram or distribution of chance for the sum or average will closely follow the normal curve, even if the contents of the box does not.