ISDS 3115 Woosley Exam 2
1/51
Earn XP
Description and Tags
Intro to Operations Management
Name | Mastery | Learn | Test | Matching | Spaced | Call with Kai |
|---|
No analytics yet
Send a link to your students to track their progress
52 Terms
what is an operation manager's objective?
to build a total quality management system that identifies & satisfies customer needs
quality
totality of features & characteristics of a product or service that bears on its ability to satisfy stated or implied needs
what are the 3 different views of quality and what are their definitions?
1. user based (better performance, more features)
2. manufacturing based (conformance to standards, making it right the 1st time)
3. product based (precise & measurable attributes of the product)
what are the 4 costs of quality?
1. prevention costs - reducing the potential for defects
2. appraisal costs - evaluating products, parts, & services
3. internal failure costs - producing defective parts or service before delivery
4. external failure costs - defects discovered after delivery
total quality management
encompasses entire organization from supplier to customer; stressed a commitment by management to have a continuing companywide drive toward excellence in all aspects of products & services that are important to the customer
continuous improvement
never-ending process; covers people, equipment, suppliers, materials, procedures; every operation can be improved; end goal is perfection, which is never achieved but always sought; TQM & 0 defects also used to describe this
what are the 2 meanings of 6 sigma?
1. in a statistical sense, it describes a process, product, or service with an extremely high capability (std. dev.)
2. a program designed to reduce defects, lower costs, save time, & improve customer satisfaction
quality circles
group of employees who meet regularly to solve problems; trained in group planning, problem solving, & statistical quality control; often led by a facilitator; very effective when done properly
just-in-time (JIT)
'pull' system of production scheduling including supply management; production only when signaled
what is the just-in-time (JIT) relationship to quality?
- cuts the cost of quality
- improves quality
- better quality means less inventory & better, easier to employ JIT system
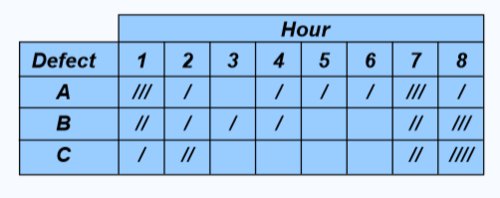
check sheet
an organized method of recording data
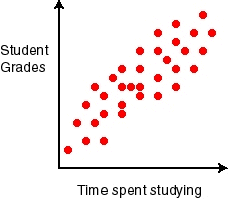
scatter diagram
a graph of the value of 1 variable vs. another variable
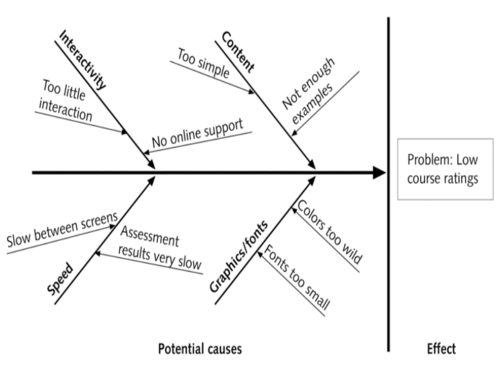
cause-&-effect diagram
a tool that identifies process elements (causes) that may effect an outcome
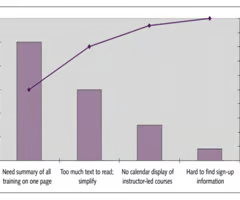
Pareto chart
a graph to identify & plot problems or defects in descending order or frequency (80/20 rule)
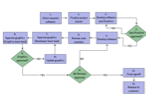
flowchart (process diagram)
a chart that describes the steps in a process
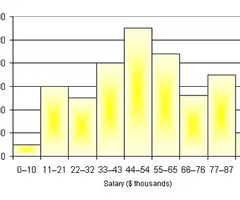
histogram
a distribution showing the frequency of occurrences of a variable
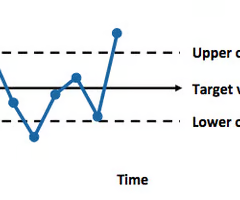
statistical process control chart
a chart with time on the horizontal axis to plot values of a statistic
statistical process control (SPC)
uses statistics & control charts to tell when to take corrective action & to ensure the processes meet standards; drives process improvement
what are the 4 key steps in statistical process control (SPC)?
1. measure process
2. when a change is indicated, find assignable cause
3. eliminate or incorporate cause
4. restart revised process
attributes
items are either good or bad, acceptable or unacceptable; does not address degree of failure
variables
measures dimensions such as weight, speed, height, or strength; falls within an acceptable range
control charts
constructed from historical data; purpose is to help distinguish between natural variations & variations due to assignable causes
variable data
continuous data; infinite possibilities; measured by measuring tape, scale, thermometer, etc.
what are the 2 variable control charts and what do they track?
x-chart - tracks changes in the central tendency
r-chart - indicates a gain or loss of dispersion
attribute data
categorical data (conform/nonconforming, defective/non-defective, good/bad, yes/no, acceptable/unacceptable)
what are the 2 attribute control charts and what do they track?
p-chart: tracks % defective
c-chart: tracks # of defects
what are the z-values for the following desired control limits (%)?
90
95
99.73
90 - 1.65
95 - 1.96
99.73 - 3
process capability
measure of the relationship between the natural variation of the process & the specifications
acceptable quality level (AQL)
poorest level of quality we are willing to accept
lot tolerance % defective (LTPD)
quality level we consider bad; consumer (buyer) does not want to accept lots with more defects than this
producer's risk (type I error - α)
probability of rejecting a good lot; probability of rejecting a lot when the fraction defective is at or above the AQL
consumer's risk (type II error - β)
probability of accepting a bad lot; probability of accepting a lot when fraction defective is below the LTPD
what are the 3 main key success factors (country decision)?
1. political risks, government rules, altitudes, incentives
2. availability of supplies, communications, energy
3. exchange rates & current risks
what are the 4 main key success factors (region/community decision)?
1. attractiveness of region
2. labor availability & costs
3. governmental incentives & fiscal policies
4. proximity to raw materials & customers
what are the 3 main key success factors (site decision)?
1. site size & cost
2. air, rail, highway, & waterway systems
3. zoning restrictions
what is the objective of layout strategy?
to develop an effective & efficient layout that will meet the firm's competitive requirements
process-oriented layout
deals with low-volume, high-variety production (also called job shop or intermittent production)
product-oriented layout
seeks the best personnel & machine utilizations in repetitive or continuous production
what are the advantages/disadvantages of product-oriented layouts?
advantages:
1. low variable cost per unit
2. low material handling cost
3. reduced work-in-process inventories
4. easier training & supervision
5. rapid throughput
disadvantages:
1. high volume is required
2. work stoppage at any point ties up the whole operation
3. lack of flexibility in product or production rates
what is the objective of supply chain management?
to structure the supply chain to maximize its competitive advantage & benefits to the ultimate consumer
make-or-buy decisions
choosing between obtaining products & services externally as opposed to producing them internally
outsourcing
transfer traditional internal activities & resources to outside vendors; efficiency in specialization; focus on core competencies
vertical integration
developing the ability to produce goods or services previously purchased; integration may be forward, towards the customer, or backward, towards suppliers; risky in industries with rapid technological change
what is the difference between forward and backward vertical integration?
forward - towards the customer
backward - towards suppliers
bullwhip effect
occurs when orders are relayed through the supply chain with fluctuations increasing at each step
what are the 3 issues with managing the integrated supply chain?
1. local optimization can magnify fluctuations
2. incentives push merchandise into the supply chain for sales that have not occurred
3. large lots reduce shipping & production costs but increase inventory holding & do not reflect actual sales
logistics management
allows competitive advantage to be gained through reduced costs & improved customer service; a frequent candidate for outsourcing
lean operations
supply the customer with exactly what the customer wants when the customer wants it, without waste, through continuous improvement; driven by "pulling" customer orders; just-in-time (JIT) focuses on continuous forced problem solving
toyota production system (TPS)
emphasizes continuous improvement, respect for people, & standard work practices in an assembly-line environment
what are the 3 fundamental issues for lean operations?
1. eliminate waste
2. remove variability
3. improve throughput
variability
any deviation from the optimum process
postponement
withholds modifications as long as possible (do customization at the very lasts step of the production process)