Lecture 19 - Models in Science
1/14
There's no tags or description
Looks like no tags are added yet.
Name | Mastery | Learn | Test | Matching | Spaced |
|---|
No study sessions yet.
15 Terms
Nature of Science
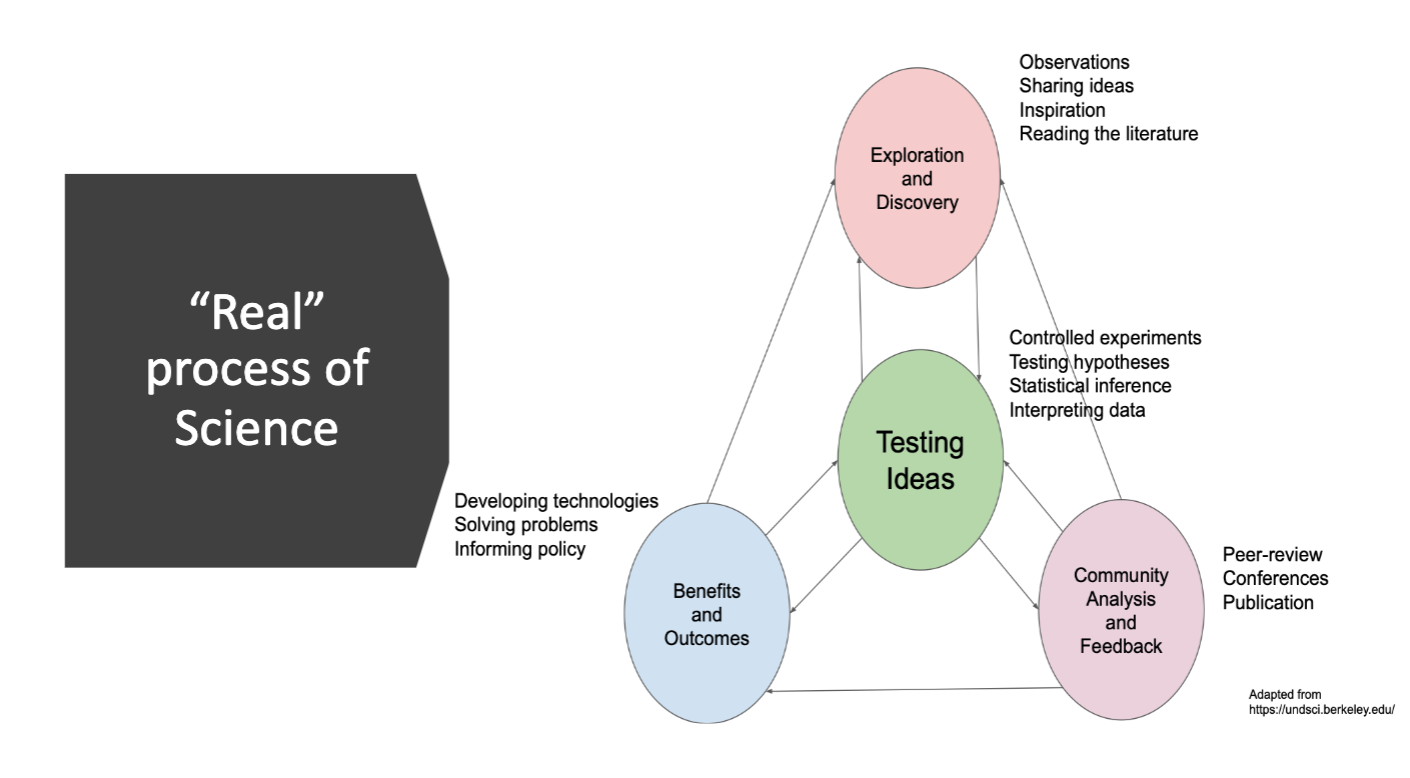
The fundamental principle of science is to find reasonable explanations for observations about the natural world, asking what and how we should explain something. As a process, it is iterative, complex, and messy where it is constantly building upon itself by circling back on past/current ideas and adding new observations to them.
By itself, it is empirical, focusing on the natural world and explanatory, depending on reason, logical, and probabilistic) to test ideas through a continual process
There is no true linear process of the scientific method and typically requires a lot of circling back, addressing stakeholders, having debates & discussions, and so on.
However, all science needs requires empirical testing that can come from controlled experiments or vigorous observations
Uncertainties
Are present in all parts of the world (highly variable outcomes) and must be accountded for in our science. Because of this, we can never assume we know the entire truth and must be open to the idea of being wrong
We can address them with probabilistic reasoning.
Theories
Explanationsof a broad group of natural phenomena that integrates facts, laws, and hypotheses. It is our best explanation (at the time) of how something works and why.
Theories have already bene tested, meaning they are of the highest quality and our most confident product of science (very good approximations)
They don’t indicate doubt, but rahter that it is open to be improved when new observations, evidence, and discoveries and made
Facts
Observations and statements that we can say are generally true
Laws
Factual generalisations that are universally true
Hypotheses
Proposed testable explanations for a set of observations, more limited in scope (if then statements)
Models
Tools that we use to test hypotheses and find evidence that may be useful in backing up a hypothesis. Often generates empirical data to test hypotheses (but empirical data, and therefore models, aren’t always needed to test hypotheses).
We can have forward modelling where known parameters are put into the model to make predictions of outcomes
Or backwards modelling where lots of data is put into the model to approximate the parameters
Probabillistic Models
Mathematical equations/computer algorithms that describe a possibility distribution of some data, giving us a range of outcomes. Any statistical model utilises probability models and stats can be used to quantify the support our data to different models.
Probability distributions allow us to describe and account for natural variability
They require data from observations
How this data is collected matters:
Controlled experiments give us causation-related data
Systematic observations are data found in nature w/o any controls
Probabilistic models use one or more probability distributions to model the process the produced the data. Having a good model allows us to:
Make simulations/predictions from the model
Infer and estimating parameters from the data
Quantify the fit between the model and the data (test hypotheses)
Probabillistic Reasoning
Understanding that there can be holes in logic that we can’t look at objective, but rather needs a probabillistic approach. When dealing with probabilities, we must satisfy the following requirements:
Degrees of plausibility are represented by real numbers
Should have qualitative correspondence with common sense
Consistent in valid reasoning routes (giving the same result) and equivalent states of knowledge must have equivalent degrees of plausibility
Rules of Probability
The probability of an event and that event not happening must add up to one (sum rule)
P(A) + P(-A) = 1
The conditional probability of an event A given that event B has already occured
P(A | B)
The joint probability of both events A and events B happening together
P(A, B)
The product rule
P(A, B) = P(A | B)P(B)
Bayes Formula
Allows us to make probabillistic inferences and states that:
P(M | D) = P(D | M)P(M)/P(D)
P(M | D) gives us the likelihood
P(M) gives us the prior probability
P(D)D gives us the marginal likelihood
It allows us to take in new data and update the model accordingly

Probability Example w/ Covid
We will establish that event A is having a positive COVID test and event B is being positive for COVID. We know that P(B) = 0.025. Say that we want to figure out the probability of being positive for covid given that we got a negative COVID test P(B | -A).
With Bayes formula, this would be:
P(B | -A) = P(-A | B)P(B)/P(-A)
We can find P(-A | B) and P(B) from the info given already, 0.347 and 0.025 respectively
We can find out P(-A) using the sum rule and product rule. It’ll essentially be the sum of conditional events that include event -A
P(-A, B) + P(-A, -B) =
P(-A|B)P(B) + P(-A,-B)P(-B) =
0.347×0.025 + 0.999×0.975 = 0.983
So the entire Bayes formula would be:
P(B | -A) = 0.347×0.025/0.983 = 0.009
So, we can say that if 1000 people got a negative COVID test, we would expect about 9 of them to actually be positive for COVID.
Examples of Models We’ve Used
The normal distribution is a model that we assume and take often when collecting and analysing data
Essentially, it states that the many measurements taken will be roughly normal/gaussian/bell-shaped
If we assume the normal distribution, we are able to describe the distribution by just its mean and standard deviation (parameters)
The linear regression is an example of another model (statistical) that requires lots of data to generate parameters
It similarly has a lot of assumptions (similar to normal distribution ones) but also has an added one of the mean changing as a function of an explanatory/predictor variable
We've learnt about some of the assumptions necessary to fit a linear regression model
Requiring homoscedasticity, roughly constant variance all throughout
Requiring a linear relationship between the two variables
Requiring a normal distribution of data
Things to Remember When Using & Thinking of Models
Reality is complex and that there is a lot of natural variability (especially in biology) that may not exactly line up with our assumptions, so we must use probability distributions to inform probabillistic models
Remember that:
There is never one true right answer that is for sure, we can’t look into the future & everything is relative
There is a relativity of wrong where existing ideas are only the best of its time. With time, as more observations and discoveries are made, it may inform new and better ideas that take over.
So, we can never say we have the exactly right explanation, but rather just the best explanation
Using Models
Nonetheless, models are still useful and that is why science (especially biology) is ruled by models and mathematics
It allows us to understand phenomena and make interesting/necessary comparisons between groups, times, and so on
In contemporary times, we have relied on cold numbers, data, and models to help us make more objective judgements
It is thought that these numbers are derived without any bias and therefore should be able to help us reach better more conclusive understandings
However, we also have to be careful because all data is non-neutral in some way or another
There is no such thing as non-neutral data due to the way it's collected, handled, and used
This is becoming especially try with the rise of machine learning algorithms (that are black boxes)
It is using data in a way where it attaches a bias to it. In some cases, the data it uses is biased inherently already