Ecology Midterm
1/22
There's no tags or description
Looks like no tags are added yet.
Name | Mastery | Learn | Test | Matching | Spaced |
|---|
No study sessions yet.
23 Terms
Natural History & the Scientific Method: Observation vs Hypothesis driven science
Observation is noticing something in nature. A hypothesis is a testable explanation of a phenomenon. Observation is the first of many core steps to the scientific method:
Observe
Question
Hypothesis
Predict
Experiment
Data Collection & Analyze
Repetition & Iteration
Natural History & the Scientific Method: Systems thinking: stocks, flows, feedbacks
Systems thinking is an approach that views parts of a system working together (interactions and relationships) through a holistic, rather than isolationist, lens.
“Interconnected elements that achieve a function.”
Stocks: are quantities of materials or information stored in a system, like biomass.
Flows: are the rates at which stocks increase or decrease (change in energy), like photosynthesis. Includes inputs and outputs.
Feedbacks: are responsive actions or information given to an influenced factor. They can be reinforcing or balancing.
Key Characteristics of a System
CIBF
Components, Interactions, Boundaries and Function
Natural History & the Scientific Method: Emergent Properties vs. Predictable Properties
Emergent properties are a characteristic of a system that arise when individual parts of a system interact in a complex way, that cannot be predicted just from looking at the parts. For example, bird migration may have emergent properties. (Holistic)
Predictable properties are what we can infer from a system. They can be bottom-up or top-down. For example, if I know reproduction rates, I can model population growth. (Reductionist)
Energy
Energy is the ability to do work. For example, I have medium E.
Energy Flow in Ecosystems: Laws of thermodynamics
Energy can neither be created or destroyed
Energy Transfers are inefficient (90% lost as heat)
Only 10% to next trophic level
Energy Flow in Ecosystems: GPP, NPP, Trophic Efficiency
GPP: Gross Primary Productivity: Total energy fixed by autotrophs
NPP: Net Primary Productivity: Energy left available to consumers after respiration
NPP: GPP - R (respiration)
Abiotic Factors
Non-living
Sun
Rocks
Substrate
pH
Disturbance
Nutrients
Water
Gas
etc.
Energy Flow in Ecosystems: Abiotic Influences on Energy Flow
Biotic + Abiotic components = Biosystems
Abiotic components have various influences on energy flow. For example, sunlight provides inputs to autotrophs and aids photosynthesis (growth).
Water is basically required for all life.
Soil is the medium from which stuff can grow.
Disturbance resets succession.
Evolution and Adaptation: Natural Selection and Fitness
Natural selection: is the core mechanism for evolution. It provides for variation, heritability, differences in survival and reproduction. Its mechanisms are gene flow, genetic drift, mutations, etc.
Fitness: traits that influence survival
Mutation
Mutation is the change in DNA
Genetic Drift
Driven by chance, like the founder or bottleneck effect. It is a change in the frequency in existing alleles in a population.
Gene flow
Gene movements among/between populations. Think of the different types of bears in GA caused by inbreeding.
Consider: BIDE
Evolution and Adaptation: Life History Strategies
How organisms allocate resources to growth, reproduction, and survival across their lifespan.
Encompasses Maturity, Fecundity (reproductive rates), Lifespan, and Investment
R (many) vs K (few) selected
Formula: dN/dt = rN(K-N) / K
r = rate of increase
K = carrying capacity
N = population size
Reproduction Types
Semelparity: Invest all resources into maximizing your single reproductive event. No need for parental care afterwards. Like salmon.
Iteroparity: Reproduce multiple times over a lifetime.
Evolution and Adaptation: Trait-environment relationships
Niche: Role of an organism in its environment. Understanding niches is important because it tells us about adaptation, distribution, and helps with managing ecosystems and biodiversity.
Adaptive radiation: is the rapid diversification from a common ancestor to exploit new ecological niches. Think of Darwin’s finches.
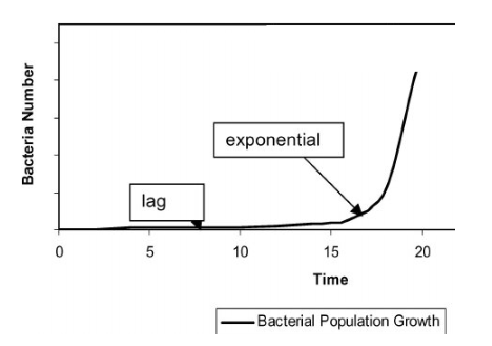
Population Ecology I: Growth Models: Exponential vs logistical growth
Exponential Growth: under ideal env. conditions with unlimited resources there is high birth rate and a low death rate, but acceleration occurs only for short periods.
Logistical Growth: Under this model populations can only be supported up to a carrying capacity (K). This means they have limited resources and/or environmental constraints.
Population Ecology I: Growth Models: Life tables, survivorship curves (Type I/II/III)
Life table: a record of survival and reproduction rates in a population. Divided by age, size, or developmental stage. They are used to asses patterns of mortality and growth rate.
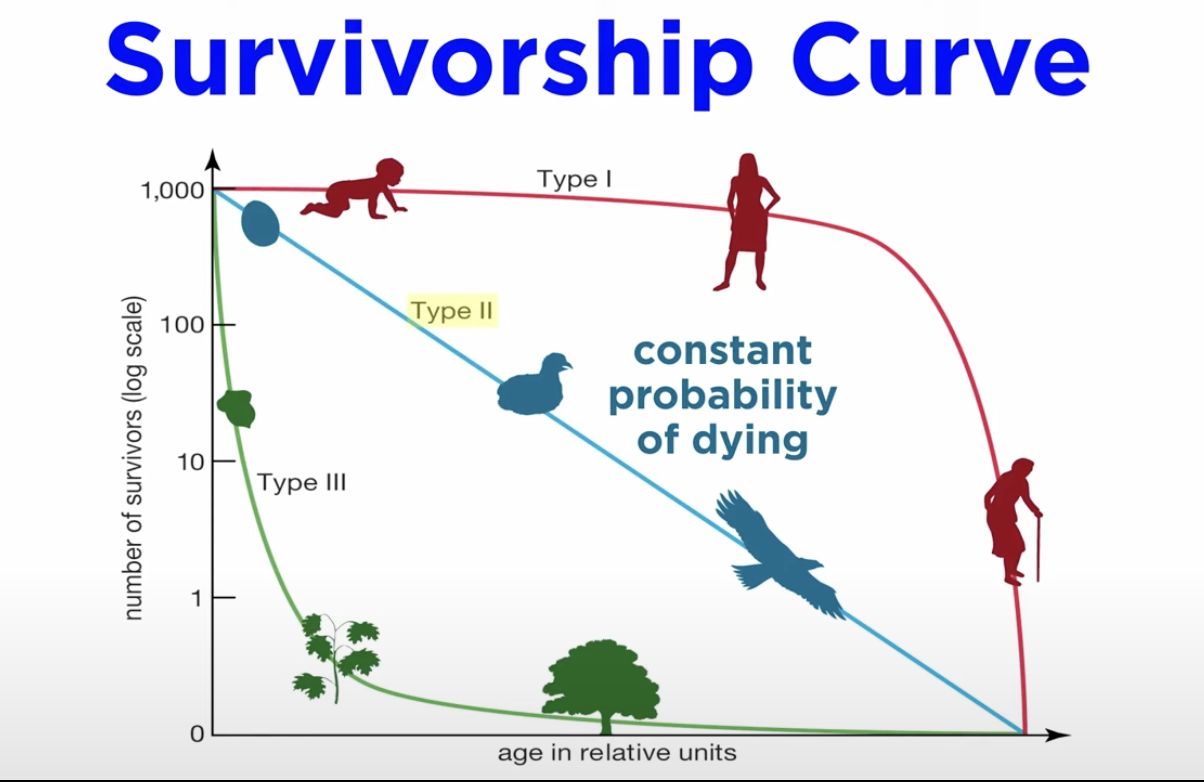
Survivorship curve: Number of members of groups still alive at an age
Type 1: Humans (high rates of survival)
Type 2: Constant change of dying
Type 3: Early death rate but established maturity
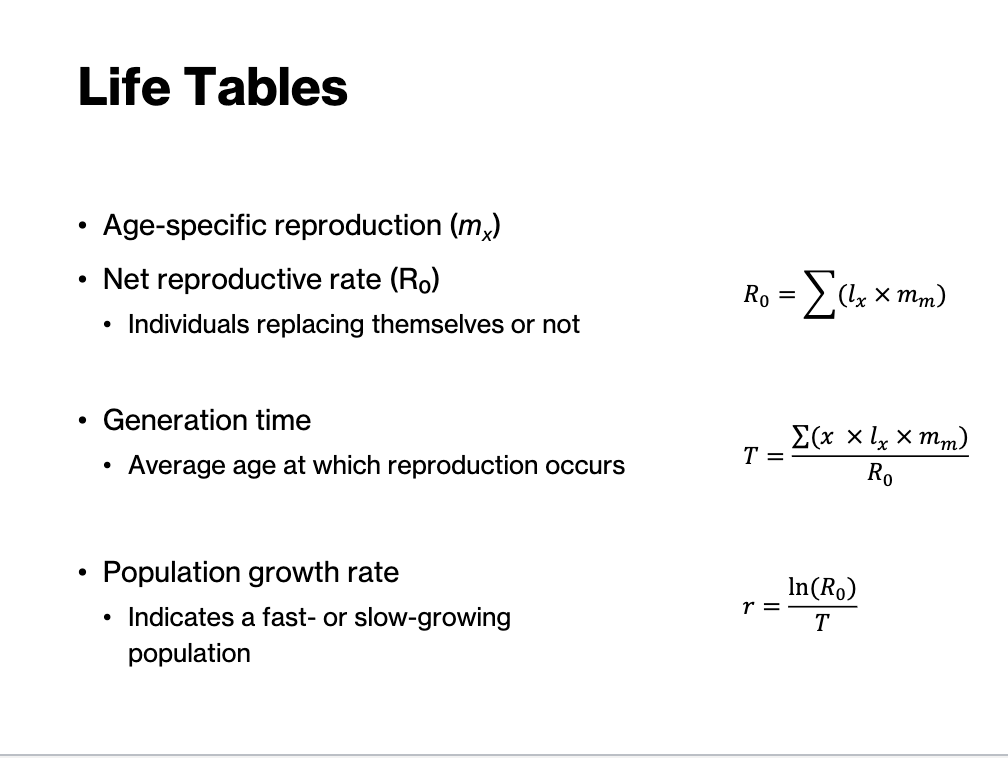
Population Ecology I: Growth Models: Calculating r, R₀, N(t)
Growth models measure the net reproductive rate (R0), average rate of reproduction (T), and total population growth rate. mx is age specific reproduction.
Population Ecology II: Regulation & Limits: Density dependence, carrying capacity (K)
Carrying capacity (K): is the max pop. size an environment can sustain given its resources.
Density dependence: Density influences survival: Inverse to birth rates and direct with death rates.
Population Ecology II: Regulation & Limits: Allee effects, limiting factors, bottlenecks
Allee Effects: Phenonema where at low points of density cooperative populations experience low birth rates which puts them at risk for extinction.
Limiting Factors: Inbreeding depression, less genetic diversity
Species Interactions: Mutualism, parasitism, competition, predation
Species Interactions: Food web structure, interaction matrix