apbio unit 1.2 & 1.3
1/85
There's no tags or description
Looks like no tags are added yet.
Name | Mastery | Learn | Test | Matching | Spaced | Call with Kai |
|---|
No analytics yet
Send a link to your students to track their progress
86 Terms
What is the purpose of statistics in biology?
To collect, process, and interpret quantitative data, helping to summarize observations and make predictions.
What are the two main types of statistics?
Descriptive statistics and inferential statistics.
What do descriptive statistics do?
They summarize or describe observations and samples.
What are measures of central tendency?
Mean, median, and mode.
What are measures of variability?
Range, standard deviation, variance, skewness, and quartiles.
What is the role of inferential statistics?
To make estimates or predictions and generalize from a sample to a wider population.
What are some examples of hypothesis tests in inferential statistics?
Chi-square test, ANOVA, and t-test.
What is a null hypothesis (H0)?
A statement that there is no effect or no difference, such as 'mating season has no effect on the average diameter of orb weaver webs.'
What is an alternative hypothesis (H1)?
A statement that indicates there is an effect or difference, such as 'mating season will affect the average diameter of orb weaver webs.'
What is the difference between a sample and a population?
A sample is a small, random group selected from the population, while a population includes all members of the group being studied.
In the spider study, how many orb weavers might be measured?
Approximately 30 randomly chosen individuals from the population of 2,000 orb weavers.
What is the significance of making predictions based on statistical summaries?
It helps avoid jumping to conclusions and encourages caution about generalizations.
What is the importance of starting to review early for the AP Bio exam?
The earlier you start reviewing, the better you are likely to perform on the exam.
How can data distribution be visualized?
Using graphs or charts to better understand the distribution of the data.
What is the average diameter of orb weaver webs in the study?
The average is calculated from the web diameters measured from the selected sample.
Why is it important to be cautious about generalizations in statistics?
To ensure that conclusions drawn from a sample are valid and not misleading.
What is the standard error of the mean?
A measure that indicates the accuracy of the sample mean as an estimate of the population mean.
What is a confidence interval?
A range of values that is likely to contain the population parameter with a certain level of confidence.
What does it mean to avoid jumping to conclusions in scientific research?
It means to carefully analyze data and consider all evidence before making a decision or claim.
What is the relationship between statistics and predictions in biology?
Statistics allows scientists to make informed predictions based on summarized data and observed trends.
What is a histogram used for?
To visualize the distribution (shape) of data by setting up bins and counting the frequency of values in each bin.
What are the key aspects to describe the shape of a data distribution?
Symmetry or skewness, and the number of peaks/modes (unimodal, bimodal, multimodal).
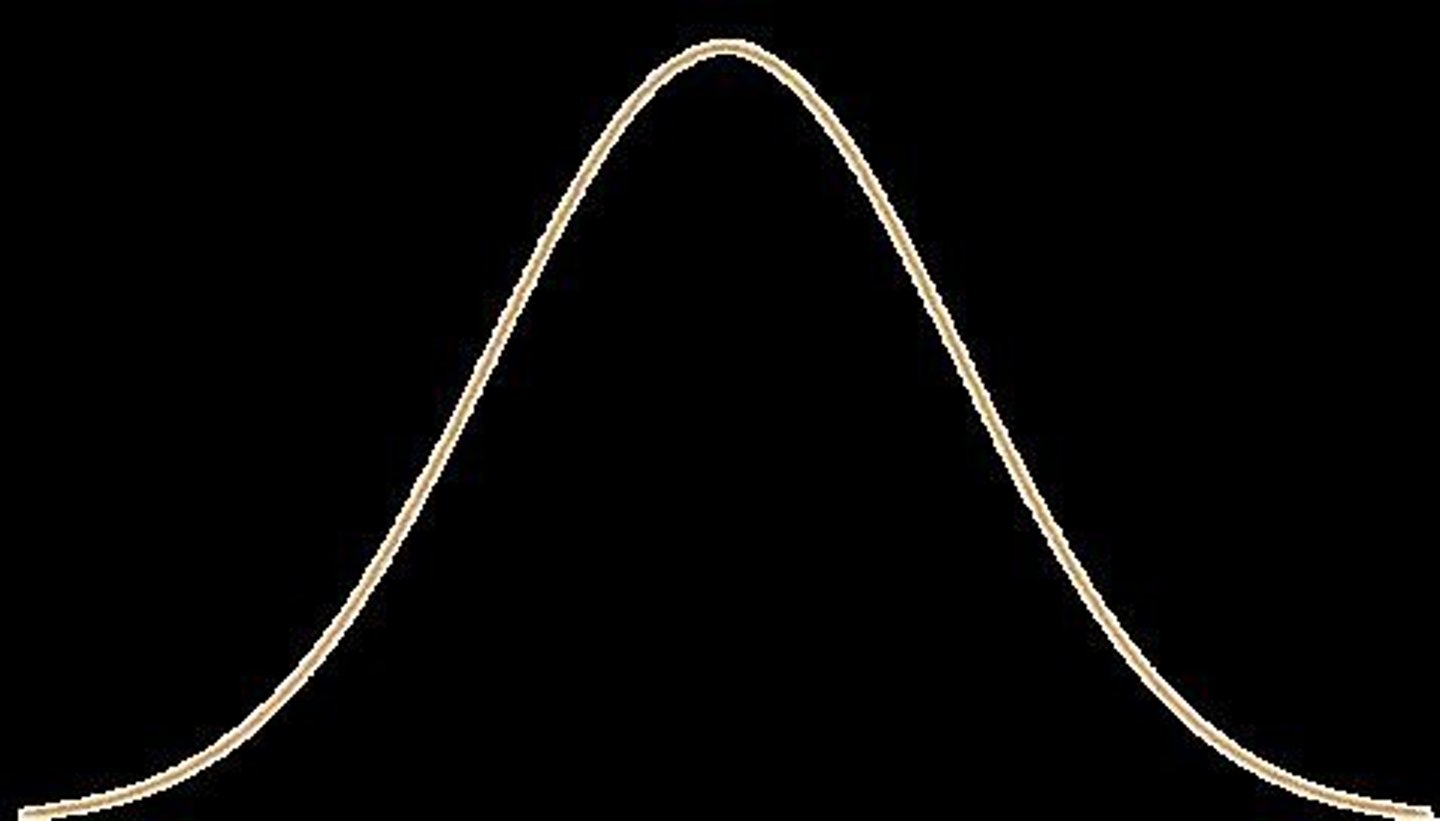
What is a normal distribution?
A distribution where approximately 68% of data falls within +/- 1 standard deviation of the mean, 95% within +/- 2 standard deviations, and 99.7% within +/- 3 standard deviations.
What is the preferred measure of central tendency in an approximately normal distribution?
The mean.
In a perfectly normal distribution, how do the mean, median, and mode relate?
Mean = Median = Mode.
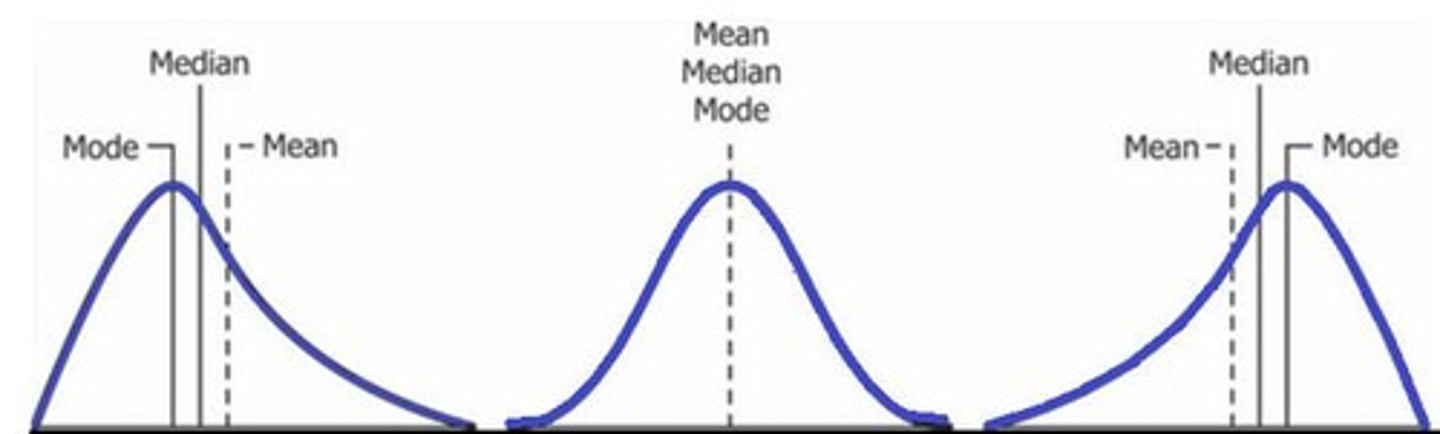
What is the impact of skewness on the measures of central tendency?
In skewed distributions, the median is preferred; if skewed left, mode < median < mean; if skewed right, mean < median < mode.
What does variability in a data set describe?
The degree to which data are spread out.
How can variability be measured in normal distributions?
Using standard deviation.
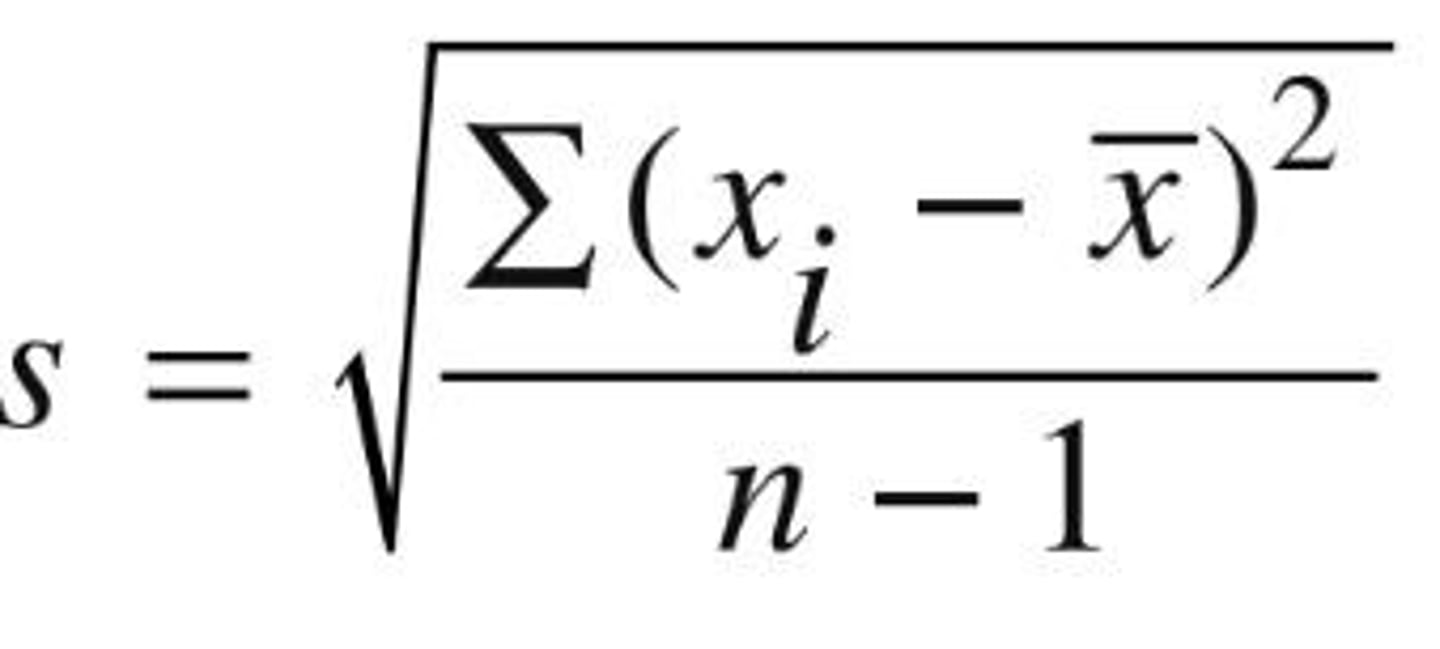
What is standard deviation?
The average amount by which all values deviate from the mean, measuring the spread of the data.
What is the interquartile range (IQR)?
A measure of variability that describes the spread of the middle 50% of a data set, calculated as Q3 - Q1.
What are quartiles?
Values that divide a data set into four equal parts, labeled Q1, Q2 (median), and Q3.
How do you find the IQR from a data set?
Identify Q1 and Q3, then calculate IQR as Q3 - Q1.
What type of plot can represent variability and quartiles?
A box and whisker plot.
What is sampling variation?
The concept that different samples from the same population can yield different results.
What is the significance of understanding the shape of a distribution?
It helps in making decisions about the best way to describe the center and spread of the data.
What is the role of bins in a histogram?
Bins are uniform intervals that cover the entire range of data, used to count frequencies.
What does a normal distribution indicate about biological examples?
Most biological examples will follow an approximately normal distribution.
What is the formula for standard deviation?
Standard deviation is calculated based on the average deviation of each data point from the mean.
What does it mean if a distribution is skewed?
It indicates that the data is not symmetrically distributed, affecting the measures of central tendency.
How is the center of a distribution described?
By measures of central tendency: mean, median, and mode.
What is the importance of variability in data analysis?
It provides a more complete summary of a distribution, indicating how spread out the data is.
What percentage of data falls within +/- 1 standard deviation in a normal distribution?
Approximately 68%.
What percentage of data falls within +/- 2 standard deviations in a normal distribution?
Approximately 95%.
What percentage of data falls within +/- 3 standard deviations in a normal distribution?
Approximately 99.7%.
How is a confidence interval constructed?
Using the sample mean and the standard error of the mean (SEM).
What is the formula for the upper limit of a confidence interval?
Mean + 2 x SEM.
What is the formula for the lower limit of a confidence interval?
Mean - 2 x SEM.
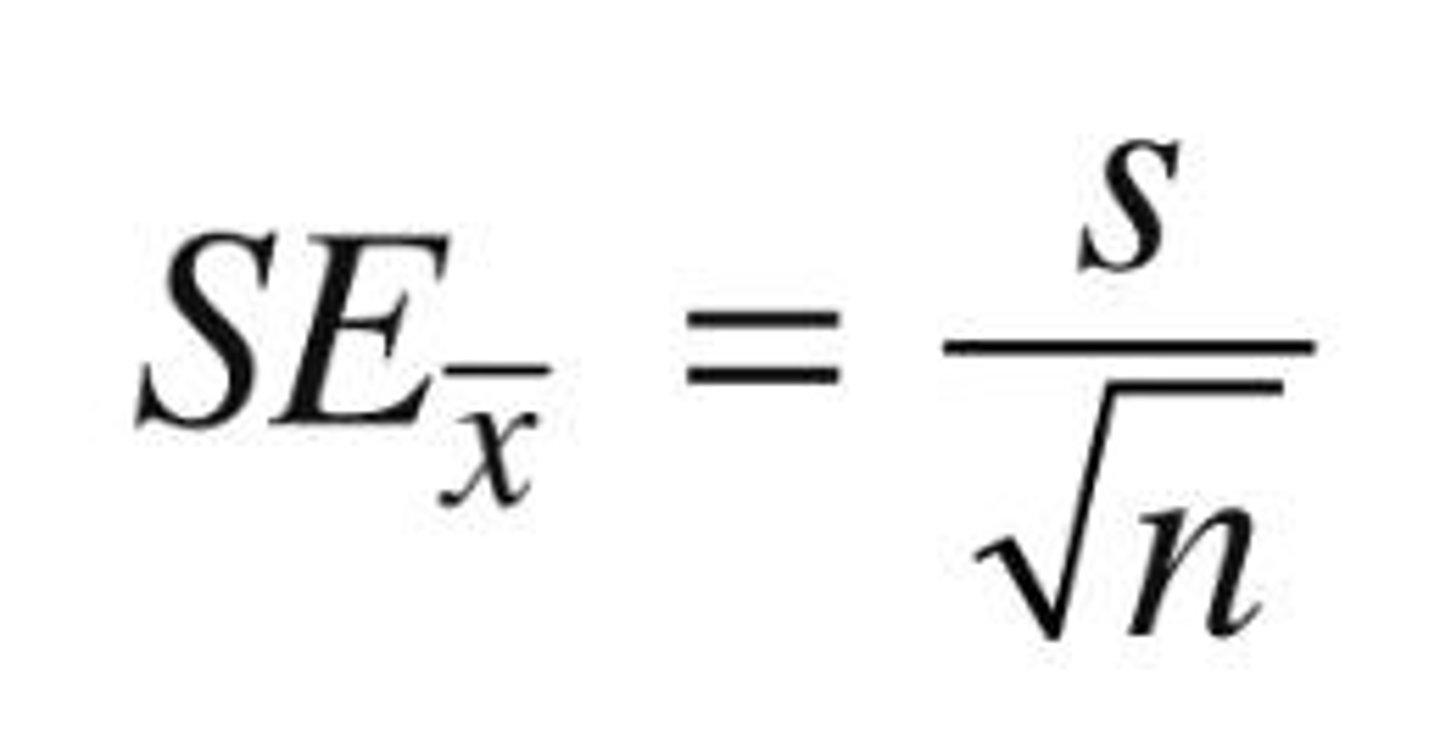
What does the standard error of the mean (SEM) represent?
It assesses how accurately the sample mean estimates the population mean.
How is the standard error of the mean calculated?
Standard deviation of the sample divided by the square root of the sample size.
What effect does increasing sample size have on standard error?
It decreases the standard error.
What happens to standard error when standard deviation increases?
It increases the standard error.
How can 95% confidence intervals be represented in graphs?
By adding error bars of +/-2 SEM to a bar graph.
What does it indicate if error bars do not overlap?
There is a statistically significant difference between the means.
What does overlapping error bars suggest?
There is not a statistically significant difference between the means.
What is the purpose of a Goodness of Fit Test?
To compare observed counts with expected counts to determine if deviations are due to chance.
What type of data does the Chi-square test analyze?
Categorical data.
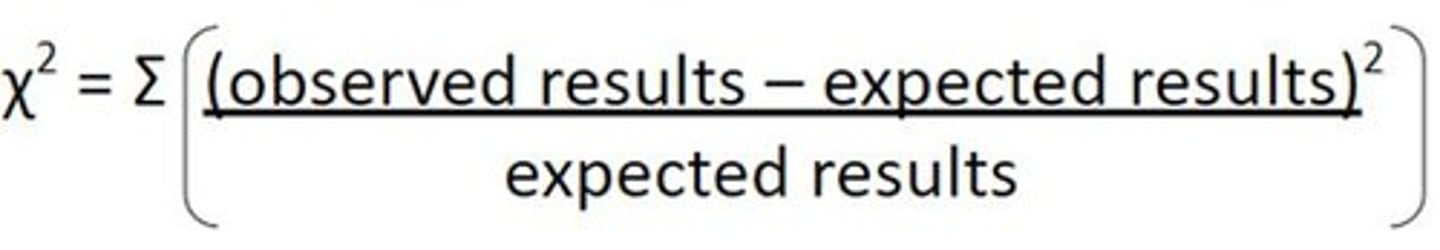
What is the null hypothesis in the context of Chi-square tests?
The expected data provides a good fit to the observed data.
What are some graphical representations you might be asked to construct in statistics?
Histograms, bar graphs, line graphs, and box and whisker plots.
What is the significance of plotting 95% CI on graphs?
It helps in comparing data sets and interpreting the variability of the means.
What are the measures of spread that can be analyzed when comparing data sets?
Standard deviation and interquartile range (IQR).
What does a statistically significant difference indicate?
The observed differences are likely due to a nonrandom cause.
What is the role of the histogram in analyzing sample distribution?
To determine the shape of the sample distribution.
What are the two types of sample distribution shapes mentioned?
Approximately normal and non-normal (skewed).
What is the importance of the mean and median in data analysis?
They represent the center of the data distribution.
What are the two main components of spread in data analysis?
Interquartile range (IQR) and standard deviation.
What is matter?
Anything that takes up space and has mass, including rocks, metals, oils, gases, and organisms.
What is an element?
A substance that cannot be broken down into other substances by chemical reactions, with 92 elements occurring in nature.
What is a compound?
A substance consisting of two or more different elements combined in a fixed ratio, such as H2O or NaCl.
What percentage of naturally occurring elements are essential for survival and reproduction?
20-25% of the 92 naturally occurring elements are essential, with CHOPN making up 96% of living matter.
What are trace elements?
Elements required by an organism in very small quantities.
What is an atomic number?
The number of protons in an atom.
What is atomic mass?
The number of protons plus neutrons averaged over all isotopes.
What does the octet rule state?
Elements will gain, lose, or share electrons to complete their valence shell and become stable.
What are covalent bonds?
Bonds formed when two or more atoms share electrons, typically between nonmetals.
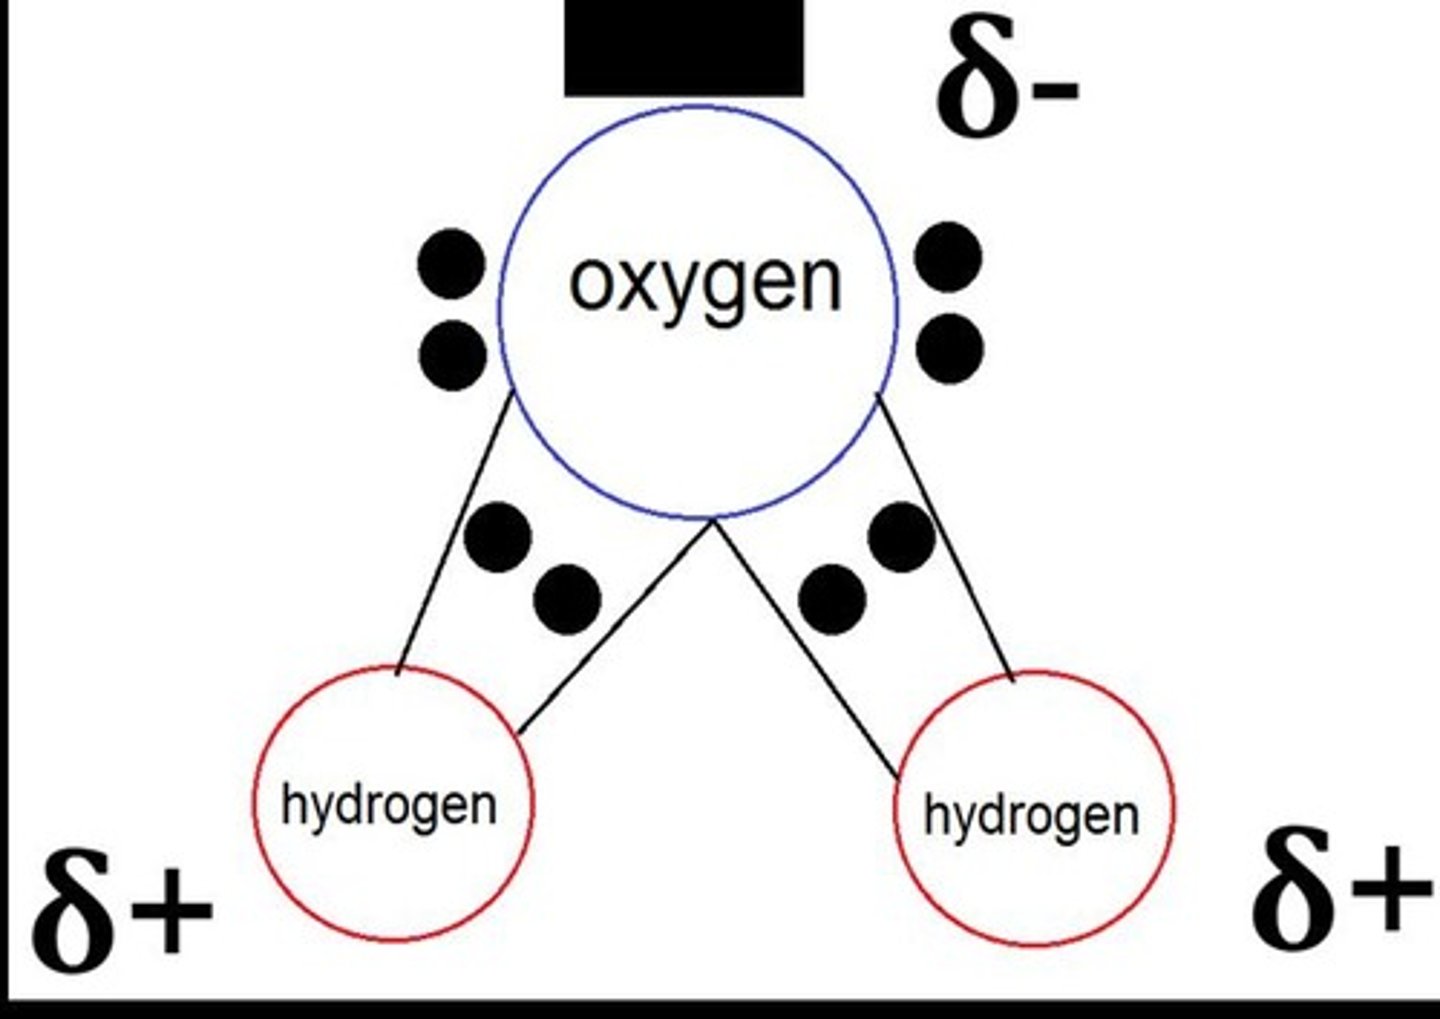
What distinguishes nonpolar covalent bonds from polar covalent bonds?
In nonpolar covalent bonds, electrons are shared equally, while in polar covalent bonds, electrons are not shared equally, resulting in partial charges.
What are ionic bonds?
The attraction between oppositely charged ions, usually formed when a metal transfers electrons to a nonmetal.
What is a hydrogen bond?
An attraction between a partially positive hydrogen atom in one polar covalent molecule and an electronegative atom in another polar covalent molecule.
What property of water is responsible for its high specific heat?
Hydrogen bonds, which require heat to break and release heat when formed.
What is cohesion in relation to water?
The attraction of water molecules to each other, which increases surface tension.
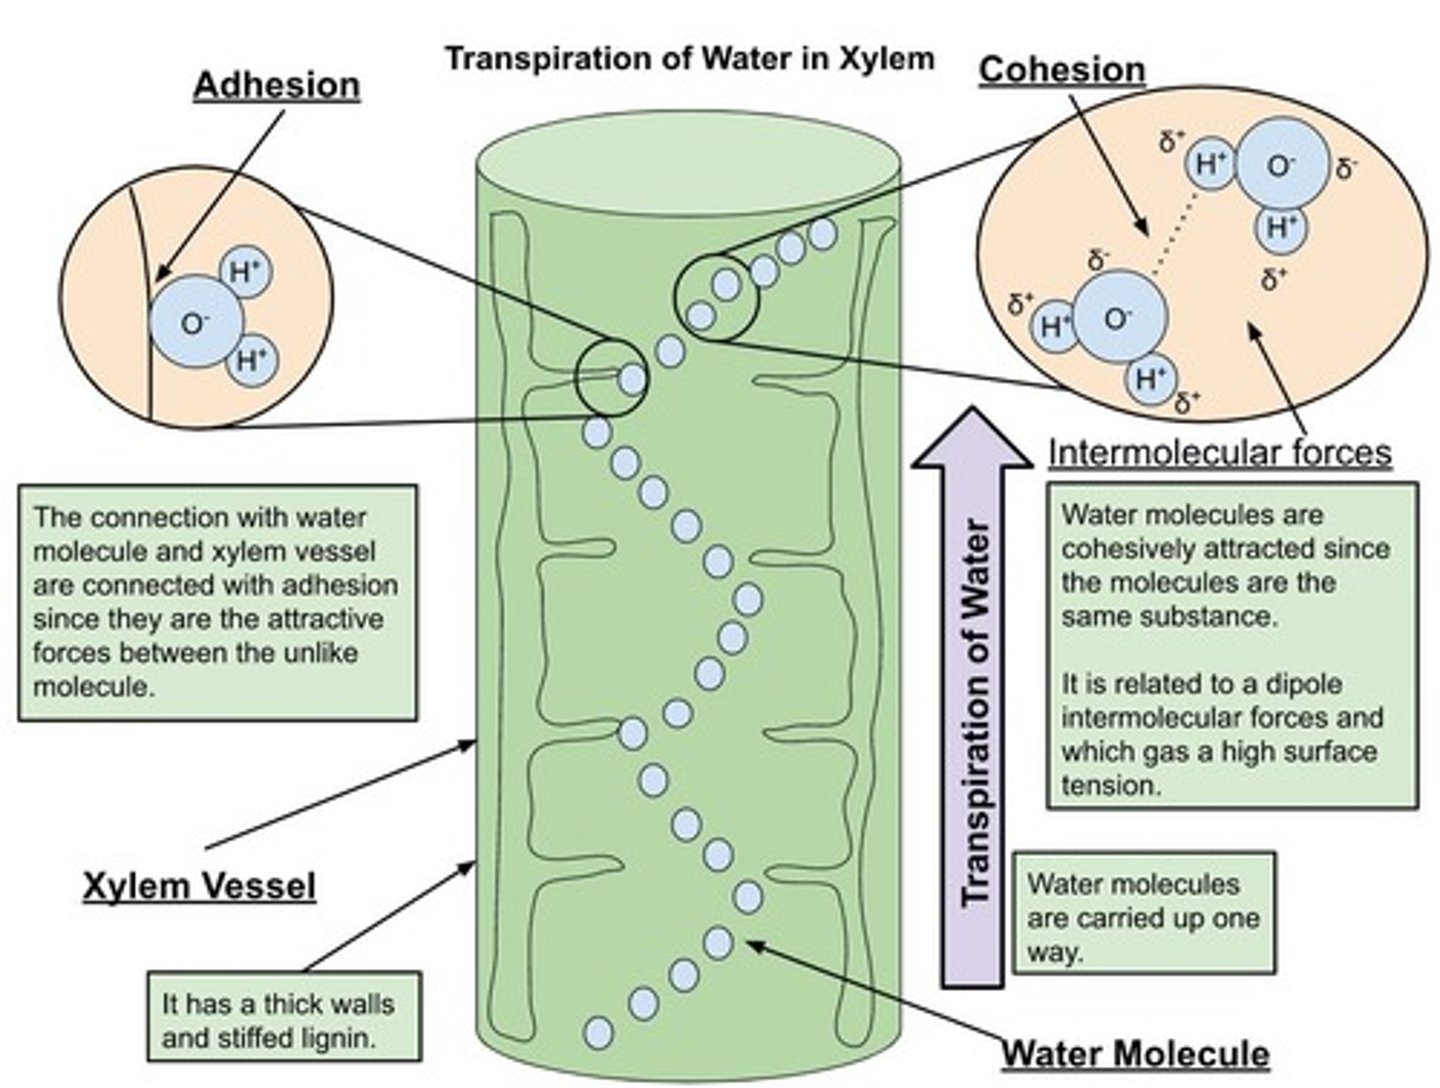
What is adhesion in relation to water?
The attraction of water molecules to other polar molecules, helping water cling to surfaces.
What is capillary action?
The upward movement of water due to the forces of cohesion, adhesion, and surface tension.
What is evaporative cooling?
The cooling effect that occurs when water molecules evaporate, taking heat away from the surface they evaporate from.
How does water's density change when it freezes?
Water expands and becomes less dense, allowing ice to float.
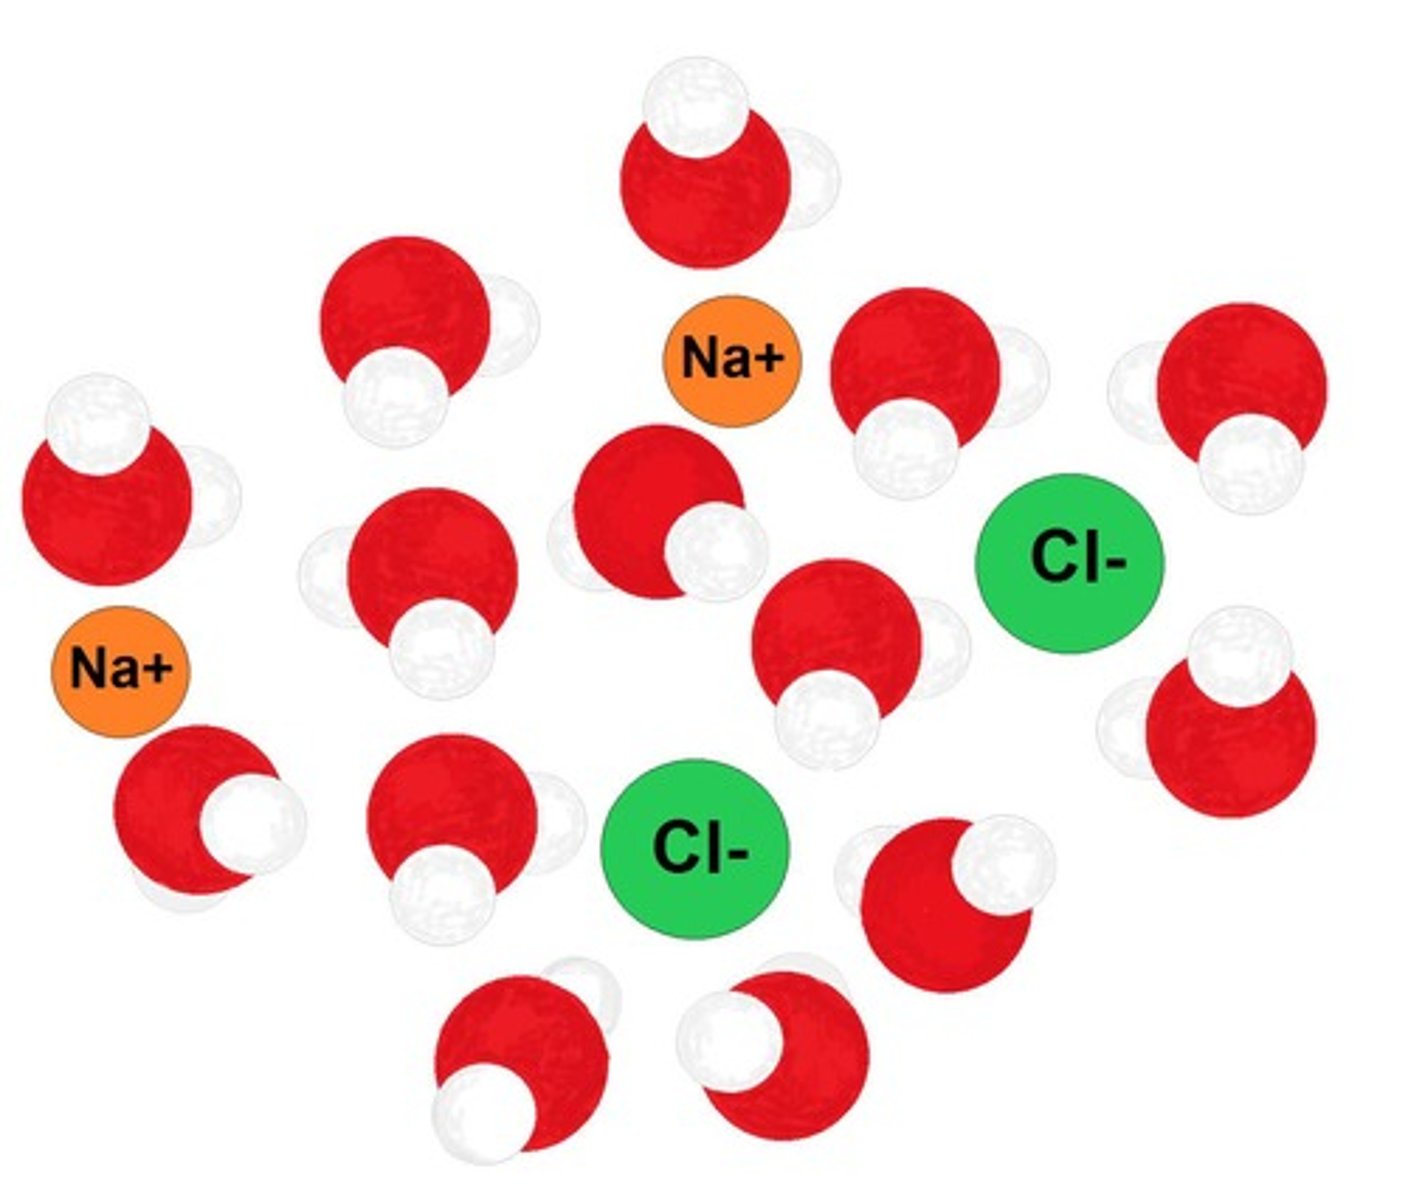
What is the role of water as a solvent?
Water is a versatile solvent that dissolves many substances due to its polar molecules.
What is pH?
A measure of how acidic or basic a solution is.
What is a buffer?
A solution that resists changes in pH when an acid or base is added, helping maintain pH stability in biological systems.