Inferential statistics
1/12
There's no tags or description
Looks like no tags are added yet.
Name | Mastery | Learn | Test | Matching | Spaced |
|---|
No study sessions yet.
13 Terms
Define inferential statistics
Inferential statistics = a process of inferring features of a population by looking at a small sample (an educated guess)
Is it due to chance, or is it representative of the population?
Is the data a result of chance? Yes or no
NOT DESCRIBING DATA
What is probability and how is it used in inferential stats. (in research)
Probability = the chance or likelihood that an event is going to happen, given all the possible outcomes
The study of random events
Expressed as a decimal (or %) and ranges from low (0 = no chance) to high (1 = certainty)
A means of prediction
EX: chance of rain, coin flip
What will happen in the long run
After event happened, it can no longer be “probable” because it happened or didn’t as predicted
In research = to determine if observed treatment differences are likely to be representative of population differences or if they could have occurred by chance
Try to predict what would happen to other populations based on our small sample
Define sampling
Choosing of samples as representatives of the entire population
Randomization is important (however, it may not be representative because the sample is smaller than the population)
Used to estimate the real value
Define sampling distribution
Shows how a statistic varies from a sample to sample
Can be affected by location, demographics
Data will not be the same between samples (variable)
Is theoretical (because would have to do it multiple times)
Get the mean from a population multiple times (different samples of same population)
Therefore, the BIGGER THE SAMPLE, THE BETTER
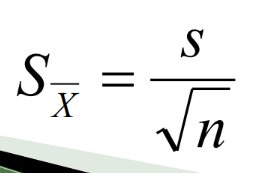
How do you calculate the standard error of the mean? What is it
Standard deviation of a theoretical sampling distribution
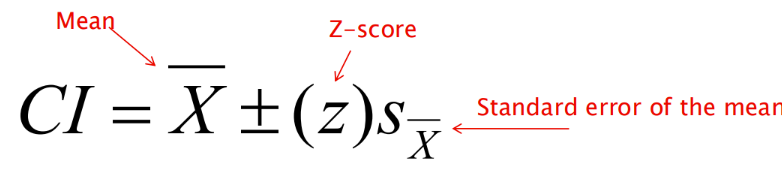
What is the confidence interval?
a range of scores with specific boundaries (confidence limits), that should contain the population mean
Based on the sample mean and standard error
The wider the interval = the more confident you are the population mean will fall in it
Reduce the risk of being wrong by sacrificing precision
Therefore 95% is a balance between precision and confidence
Ex: we are 95% confident that the population mean will fall between 37.3 and 42.7
How do you calculate confidence interval
What is the population mean and sample mean?
Sample mean = X-bar = mean of the sample gathered
Population mean = µ = a parameter
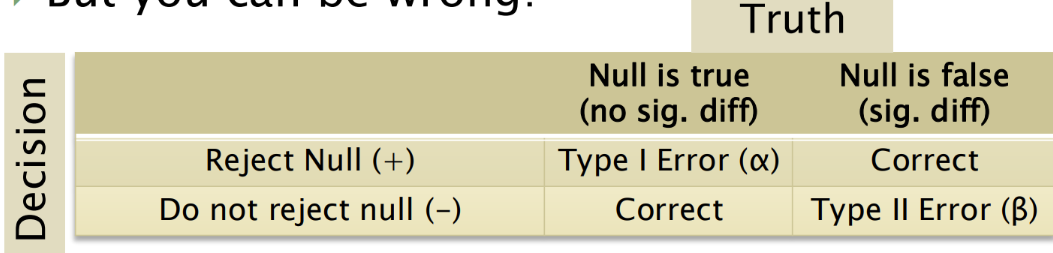
What is type 1 error and an example
(alpha) = False positive
Saying results are significant, when they aren’t really
Providing treatments that are not effective

What is type 2 error and an example
(beta) = false negative
Saying results are not significant, when they really are
Stop researching areas that have potential
What is “significance” in inferential statistics
Results of an analysis are unlikely to be due to chance at a specified probability level
If results are statistically significant, then null hypothesis is rejected
P-value – level of significance
The selected alpha level defines the maximal acceptable risk of making a type 1 error (reject null)
Alpha value should be equal to or less than 5% (0.05)
p-value = 0.03 therefore, you reject the null (because 0.03 < 0.05)
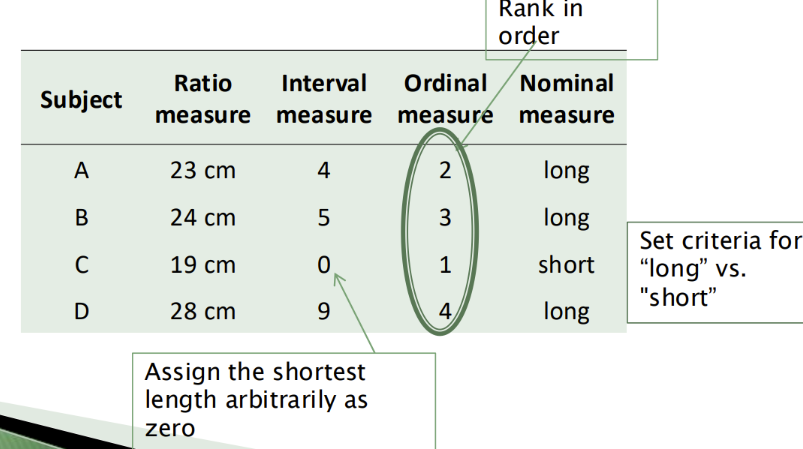
List and describe the 4 types of data
Nominal = Categorical
Consists of arbitrary labels with no implied order, unranked
Can be numbered, but they have no significance
Male = 1 & female = 2
Counted as frequencies
Non-parametric tests
Ordinal = Ranking
Consists of numerical ranked data that is ranked according to some criterion (each rank is different from the others but the differences may not be equal)
Do not represent quantity, only positions within a distribution
EX: 5-star rating, pain rating scale
Non-parametric tests
Interval = 0 has no real value
Consists of ranked data with intervals between each order being equal but with no meaningful zero point
Actual value of one interval scale is NOT the same as another
Ex: 100 C is not the same as 100 F
Ex: IQ, calendar dates, temps,
Parametric tests (but can be non-parametric)
Ratio = 0 has a meaning
Like interval data, but zero point is meaningful (highest level of measurement)
Therefore can’t go below 0
Ex: thyroid hormone levels, height, weight, age
Parametric tests & continuous values
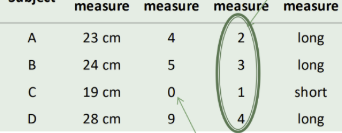
Identify the data type on the table