A-Level Geography (AQA) - Human Geography
1/187
There's no tags or description
Looks like no tags are added yet.
Name | Mastery | Learn | Test | Matching | Spaced | Call with Kai |
|---|
No analytics yet
Send a link to your students to track their progress
188 Terms
What are crude birth rates?
Refers to live births per 1000 people of the population per year.
How has food production changed over time?
Food production has tripled globally in the past 50 years.
What environmental factors determine the distribution of population densities?
1) Soil pH
2) Access to water
3) Biomes
4) Natural resources.
How do Tudra and Polar biomes impact human behaviour for food production?
Humans must hunt for food, as life cannot be sustained due t the severly low temperatures, adopting a hunter-gatherer nature and hunting natural game, such as wild hares and at times, whales.
How do temperate decdious forest biomes impact human behaviour for food production?
Humans utilise intensive agricultural techniques, for example, hydroponics, from the maritime climate to grow a variety of different seasonal crops and breed a significant number of farm animals, being responsible for majority of the world’s agricultural production, especially in vegetables and meat.
How
How do Mediterraniean biomes impact human behaviour for food production?
Humans often used collectivised agricultural techniques, such as agro-silvo pastoral systems, to take advantage of the hot summers and mild winters to grow crops like grapes, olives and wheat, with more of a focus on drought-resistant crops.
How do Desert biomes impact human behaviour for food production?
Due to extremely hot conditions and low rainfall, farming conditions are not optimal. But through using highly efficient water management techniques, like irrigation and desilination plants, humans can grow drought-resistant crops, like cacti.
How do mountain biomes impact human behaviour on food production?
Humans normally use small-scale and adaptive farming techniques, such as terracing, to counter the difficult terrain and harsh climates, as well as using integrated agricultural techniques, such as silvopastoralism, to produce food from farmland.
How do tropical biomes impact human behaviour on food production?
Humans can utilise the tropical climactic conditions, which consists of high volumes of rainfall and high temperatures, to grow a variety of endemic plant life, such as bannans, being responsible for some of the largest volumes of cattle ranching due to high soil nutrition.
What is a population?
Refers to the amount of people in a defined area.
What is population distribution?
Refers to how a populatin is spread globally or regionally.
What is population change?
Refers to increases and decreases in population over a period of time.
What are the 2 key factors which effect populations?
1) Environmental factors
2) Developmental processes
What are crude death rates?
Refers to the average number of deaths per 1000 people of the population per year.
What are infant mortality rates?
Refers to the number of children dead before they reach 1 yr/o per 1000 people in a population.
What is natural change?
Refers to the difference between birth and death rates.
What is natural increase?
Birth rates > Death rates
What is natural decrease?
Birth rates < Death rates
What are literacy rates?
Refers to the percentage of people over the age of 15 who can read or write.
What is the net migration change?
Refers to the difference between immigration and emigration in a place over a period of time.
What are literacy rates?
Refers to the percentage of people over the age of 15 who can read or write.
What are vital rates?
Refers to the following indicators;
1) Net replacement rates
2) Crude birth rates
3) Death rates
4) Fertility rates
What is the reproductive age?
Refers to the average age women give birth to children in an area.
What is the total fertility rate?
Refers to the average number of children bon per woman.
What are inputs into a population?
1) Births
2) Immigrants
What are outputs into a population?
1) Deaths
2) Emigrants
What is population growth?
Refers to when natural change and net migration is positive.
What is population decline?
Refers to when natural change and net migration is negative.
How do migration rates and birth rates influence eachother?
More immigration → More people of childbearing age enter the country → More children born → Increased birth rates and natural increase.
(STAT) What are some key population trends?
1) By 2037 => Population will reach 9bn.
2) By 1800 => Only just hit 1bn.
3) By 2023 => Hit 8 bn.
(Suggests that populations are only guaranteed to increase exponentially.)
Why is life expectancy expected to increase?
Healthcare availability + Higher access to health info. => More people live for longer.
What is the relationship between birth rates and fertility rates?
Higher birth rates → Higher fertility rates
(More children born per woman.)
Why do high birth rates occur with high death rates?
Common in developing countries with poor healthcare, low female employment and high infant mortality.
Why do high birth rates occur with high infant mortality?
More babies die → More women have more children to compensate → Higher birth rates.
(STAT) Which country had the highest death rates in 2001 and why?
Niger (16.2), due to being a developing country, it had poor healthcare, low sanitation and low living standards, which caused high infant mortality rates and low life expectancy.
What is the correlation between high death rates and vital rates?
High death rates = High infant mortality rates
Which countries experienced natural decrease in 2011?
Japan
Why did Japan experience natural decrease?
Ageing population → Low fertility rate → Fewer births than deaths.
What is a population?
Refers to the amount of people in a defined area.
What is population distribution?
Refers how a population is spread globally or regionally.
What is population density?
Refers to the measurement of population per unit area.
What is population change?
Refers to how a population increases and decreases over a period of time.
What factors of the physical environment impact populations?
1) Climate
2) Soils
3) Resources
Why is the climate important for a population?
This dictates wow many people can be supported in an area.
Why is soil important for a population?
This dictates the agricultural productivity of an area.
Why are natural resources important for a population?
These are needed in very many areas, for example, hygenie, sanitation, agriculture and drinking.
(mini CS) What are examples of food production supply?
1) The Green Revolution
2) The Neolithic Revolution
(mini CS) What happened during the Green Revolution?
More technological and efficient farming supplies and practises.
More of a focus on maximising farming yields during the 50’s and 60’s.
Around 1bn. People were able to be fed as a result.
(mini CS) What happened during the Neolithic Revolution?
12,000 years ago => Shift from hunter-gatherer populations to agricultural communities.
Birth and fertility rates increased as a result, leading to baby booms.
Produced more stable food supplies.
Denser communities were able to be fed over time.
How have global population statistics changed?
World’s population remained below 1bn. untill around 1804.
To reach 2bn. in world population, this only took 100 years.
Global population doubled from the beginning of the 20th century.
What is the development process?
Refers to how a population changes and becomes more advanced over time.
WHat ety
What is the Demographic Transition Model?
Refers to the model which show how, as countries develop, changes in birth and death rates subsequently affect the population.
What does the DTM look like?
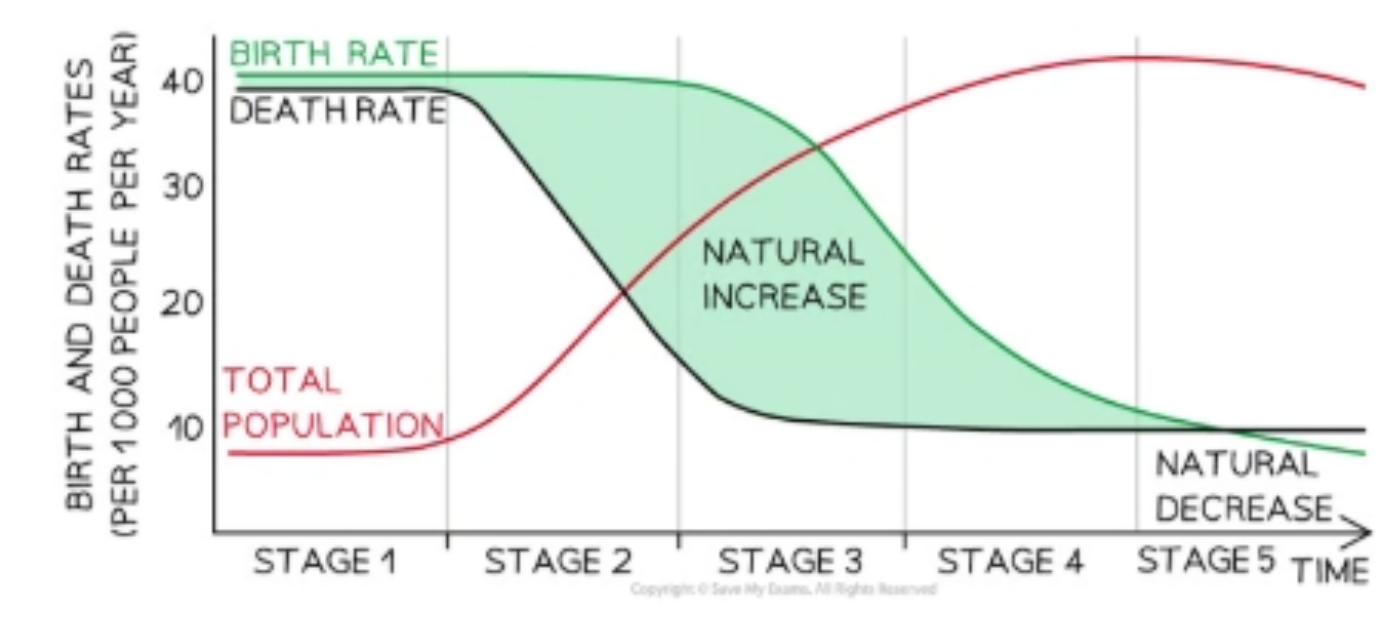
What is Stage 1 of the DTM?
High stationary =>
1) High birth rates
2) High death rates
3) Low population size
What is Stage 2 of the DTM?
Early expanding => E.g, Yemen and Niger
1) High birth rates
2) Death rates rapidly falling
3) Population begins to grow rapidly.
4) Changes caused by higher healthcare quality.
What is Stage 3 of the DTM?
Late expanding => E.g, India and Mexico
1) Steady decline in birth rates
2) Death rates begin to plateau
3) Population growth occurs at a slower rate.
4) Changes caused by improved socio-economic situation, access to contraception and more gender equality.
What is Stage 4 of the DTM?
Low stationary => E.g, U.S.A and U.K
1) Birth rates are low and level.
2) Death rates also level out.
3) Population size is high, but population growth rate is low.
4) Changes are caused by strong economic performance, higher education, high quality healthcare, and a higher proportion of women working.
What is Stage 5 of the DTM?
Declining => E.g, Japan
1) Birth rates are below death rates,
2) Death rates remain low, and may increase.
3) Population size is high, but population growth is negative as the total population decreases.
4) Changes are caused by an elderly population, which means death rates increase.
What are strengths of the DTM as a population model?
1) Accurate for many Western, industrialised countries.
2) Useful predictor for developing countries.
3) Commonly used as a comparison tool.
What are the weaknesses of the DTM as a population model?
1) Many outliers who do not follow this common path of development.
2) Does not predict the length of time each country is in each stage for.
3) Does not account for other inputs which may change population size, e,g, migration.
(mini CS) When was U.K in Stage 1 of the DTM and what characterised those times?
Prior to 1801 (before Industrial Revolution)
1) Birth rates were very high due to large families
2) Death rates were also high and fluctuating due to famine and disease (e.g, Great Plague of 1665)
(mini CS) What were birth rates like in Stage 2 in the U.K what characterised those times?
Around 1750-1800
1) Improved food supply and better healthcare and sanitation led to death rates falling. (e.g, Jenner Smallpox Vaccine of 1798)
2) Lack of contraception and high infant mortality lead to high birth rates.
(mini CS) What were birth rates like in Stage 3 in the U.K?
Around 1880-1840
1) Medical advances in penicillin and raised living standards, decreasing death rates.
2) Birth rates fell due to more women entering the workforce, child labour laws (e.g, Children and Young Persons’ Act of 1993) and compulsory education.
(mini CS) What were birth rates like in Stage 4 in the U.K?
Around 1940
1) Death rates stabilised due to the creation of the NHS and advanced healthcare.
2) Widespread contraception and gender equality in the workforce led to birth rates falling even more.
What is dependency?
Refers to where different demographics of a population rely on others for their quality of life and well-being through economic growth.
How do you divide the population when discussing dependecy?
1) Youthful dependents (X<16)
2) Elderly dependents (64<Y)
3) Economically active (16<X<64)
How is the dependency ratio calculated?
(Young dependents + Elderly dependents/ Economically active) x100
(mini CS) What is the U.K’s dependency ratio?
59%
What are the benefits of a youthful population?
1) Provides larger labour force for the future.
2) More innovative and adaptable work force.
What are the problems of a youthful population?
1) High pressure on education systems and childcare services.
2) High dependency burden from youthful dependents.
What are the benefits of an ageing population?
1) Growth in “silver economy” industries, e.g healthcare.
2) More community volunteering and community support.
What are the problems of an ageing population?
1) Increased government spending, e.g, pension spending.
2) Potential labour shortages.
(mini CS STAT) Which countries are predicted to have the greatest rise in old-age dependency ratios?
1) Singapore
2) South Korea
Expected to rise from ~20% to ~90% by 2070.
(mini CS STAT) Which country is predicted to have the smallest increase in old-age dependency?
Israel (~20% to ~30%)
What is the overall trend for old-age dependency ratios globally from 2020-2027?
Significant increases for all countries.
Why are increases in old-age dependency important?
Implies there will be a greater pressure on working populations to support non-working elderly.
What is a youthful dependency ratio?
Refers to the proportion of the population aged 0-14 relative to the working age population.
What is the old-age dependency ratio?
Refers to the proportion of the population aged 65+ relative to the working age population.
Why are dependency ratios important?
Indicate economic pressures on the productive population.
What is population structure?
Refers to the age distribution and sex composition of a population.
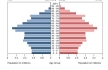
What are population pyramids?
Refers to the diagrams which show age distribution and sex composition of a population.

What do population pyramids show?
Changes which impact populations, e.g, past population changes, future trends, effects of war, migration impacts and demographic transition stage.
What is the average dependency ratio in developed countries?
Developed => 50-70&
What is the average dependency ratio in developed countries?
Developing => >100%
(mini CS) What is the current U.K dependency ratio?
~58% (Currently falling due to longer life expectancy)
What does a Stage 1 DTM model look like?
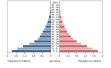
What does a Stage 2 DTM population pyramid look like?
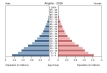
What does a Stage 3 DTM population pyramid look like?
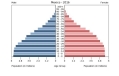
What does a Stage 4 DTM population pyramid look like?
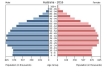
What does a Stage 5 DTM population pyramid look like?
What is a demographic divedend?
Refers to when economic growth occurs resultin from a large, young and educated workforce with fewer economic dependents.
Why does a demographic dividend boost economic growth?
1) More workers => Higher productivity
2) Increased investment => Economic growth
3) Fewer children per family => Less dependents and more women in the work place.
What causes a demographic dividend?
Shifts in a population’s age structure from falling vital rate from earlier periods of high fertility.
What are the key conditions for a demographic dividend?
1) Low fertility rates
2) Large working age population
3) Educated workforce
4) Sufficient job opportunities
5) Empowered women with access to education and work
Why is female empowerment important for achieving a DD?
This lowers fertility rates, increasing female labour participation and boosts overall productivity.
Why must fertility rates fall before a DD?
This creates fewer young dependents, minimising the number of young dependents within a population.
(mini CS STAT) What are some examples of countries currently gaining or expected to gain a DD?
Colombia only has a population with ~33% dependents, and alongside high literacy rates, this would likely lead to a DD.
What factors prevent a country from achieving a demographic dividend?
1) Poor education and literacy rates
2) Weak job markets
3) Lack of effectual infrastrucutre
4) Gender inequality