Rural-urban continuum and its links
1/14
There's no tags or description
Looks like no tags are added yet.
Name | Mastery | Learn | Test | Matching | Spaced | Call with Kai |
|---|
No analytics yet
Send a link to your students to track their progress
15 Terms
What is the rural-urban continuum?
The gradual transition between urban and rural areas
Fewer services the more rural the area
Sequence of areas
CBD - secondary city - town - villages - rural
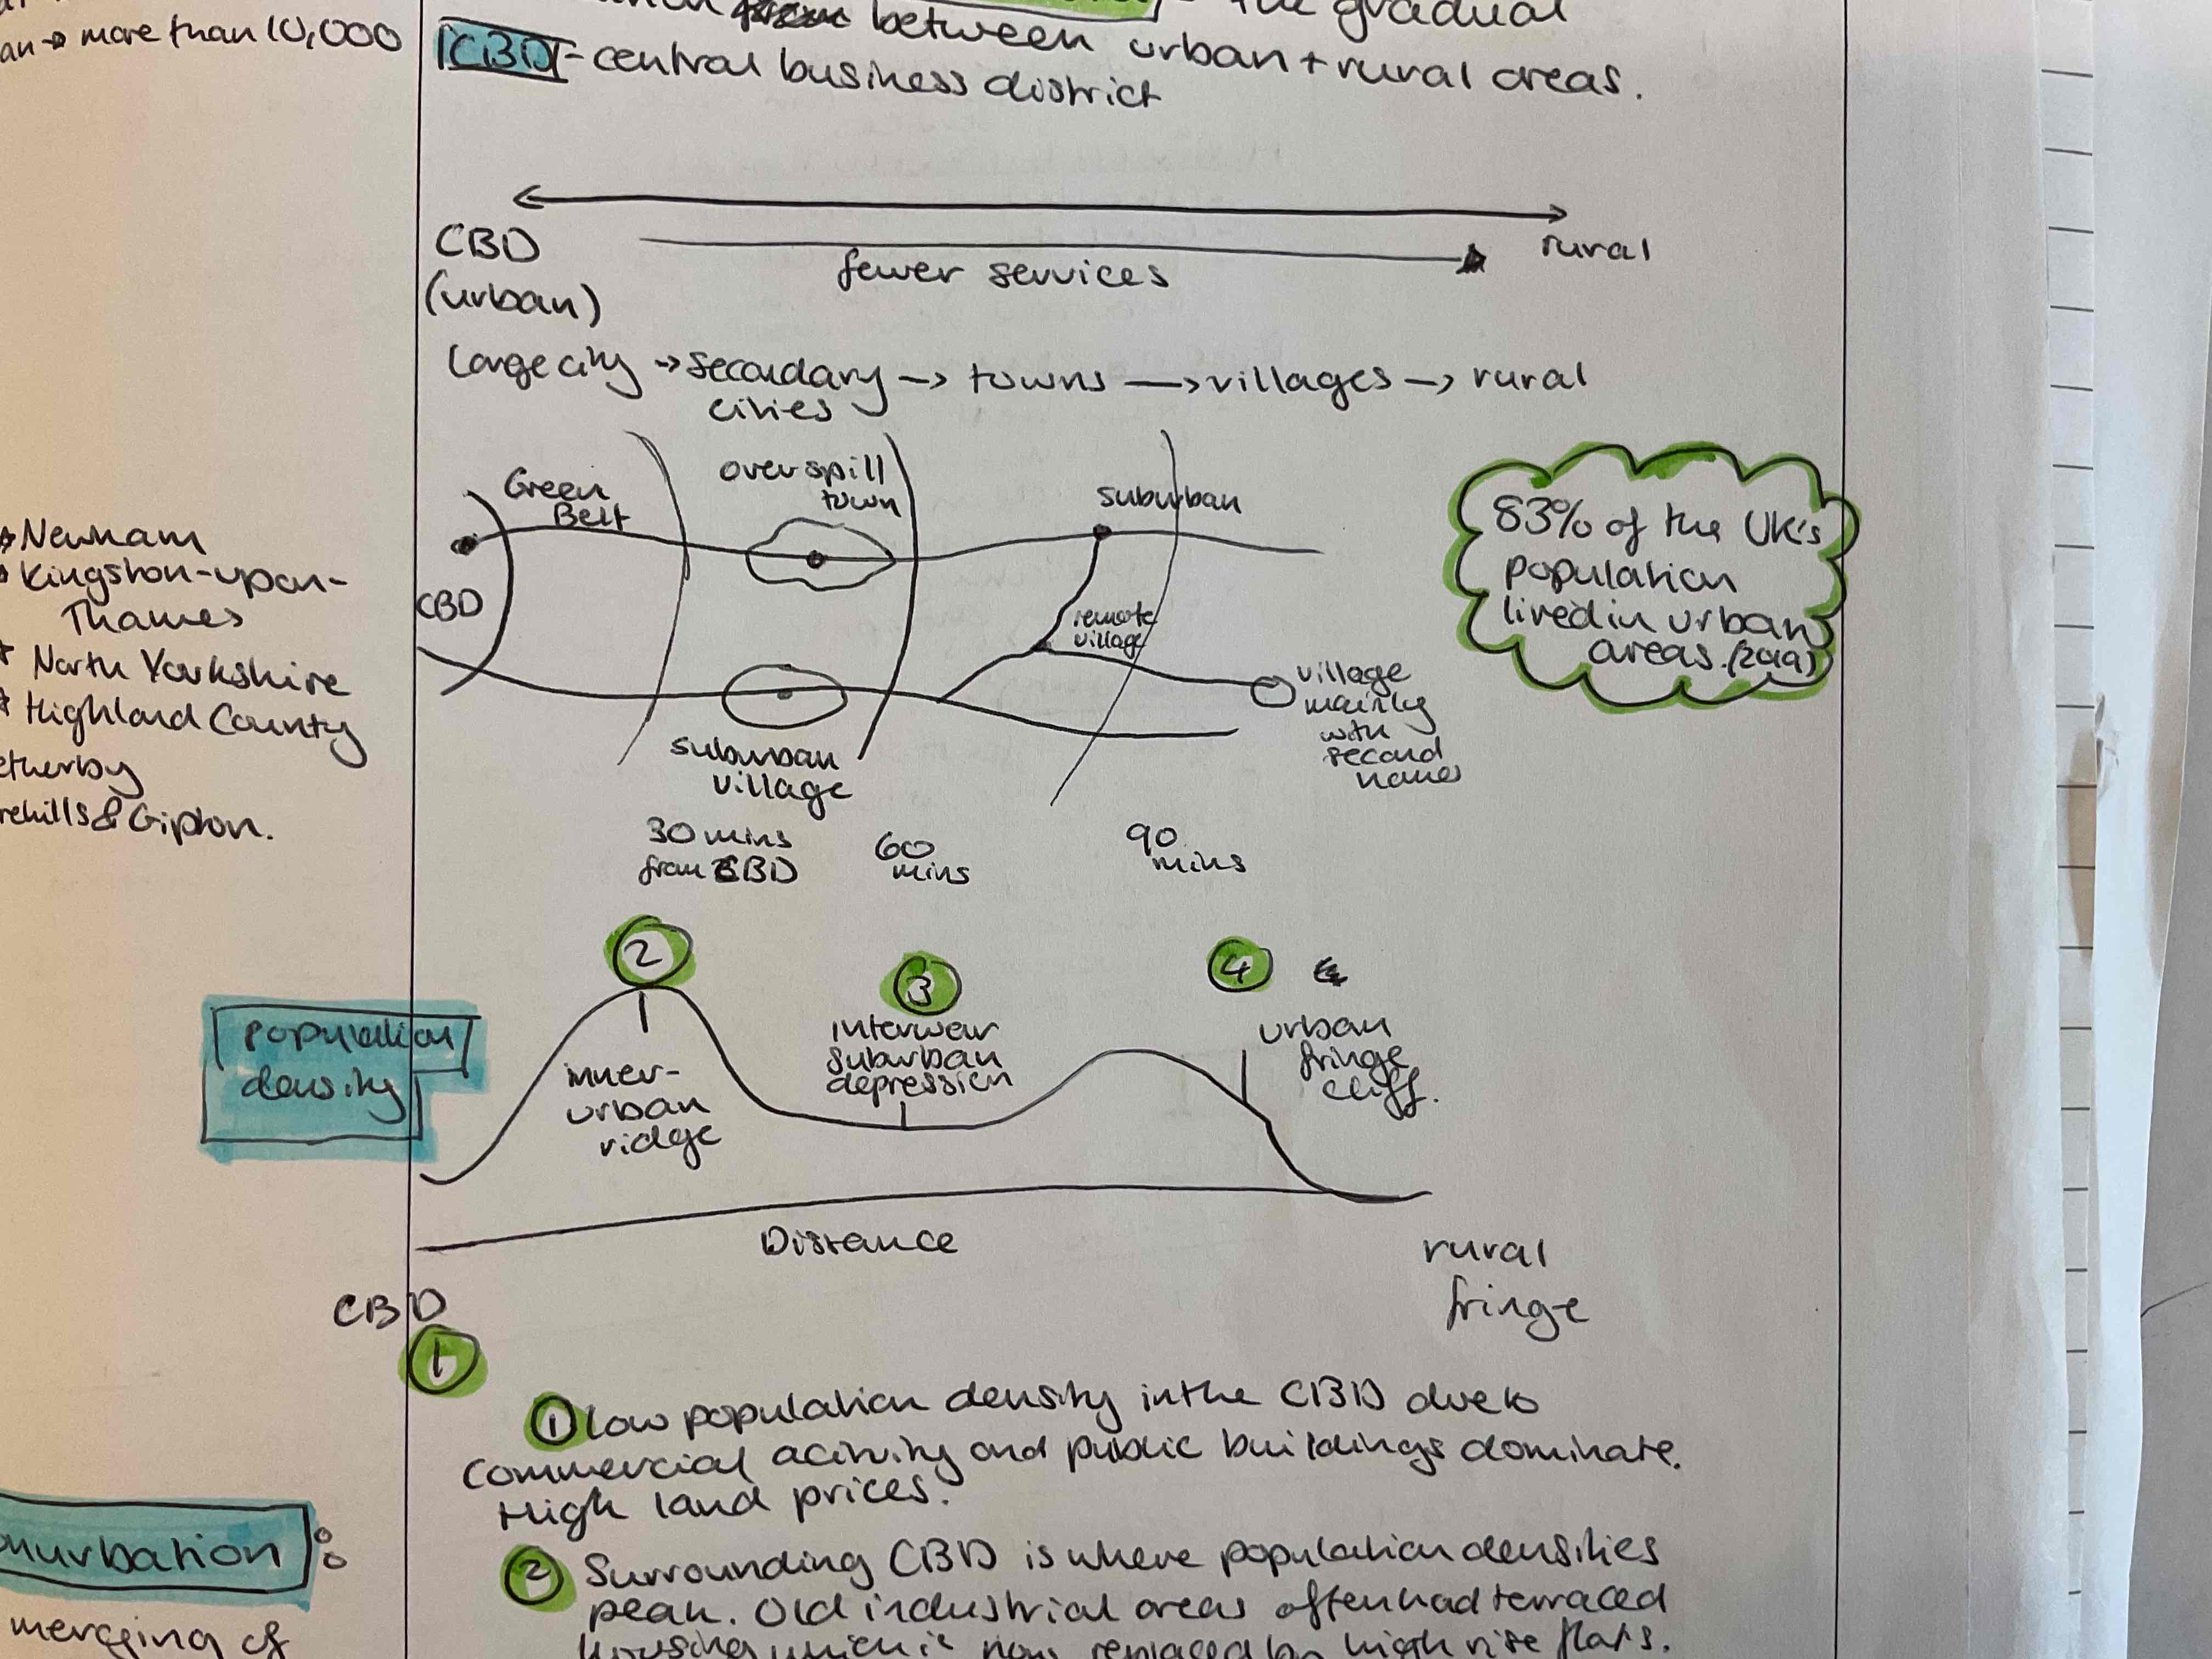
Population trends
low density in CBD (central business district)due to commercial activity and public buildings dominate
Surrounding CBD is highest densities. Old industrial areas with terraced housing. Some replaced with high rise buildings
Interwar period had low density buildings
Large amounts of council estates on the urban fringe but cliff due to green belt policies
What is conurbation?
The merging of two or more sizeable cities whose peripheral zones have grown into each other
What is an overspill town?
A town built/repurposed/expanded to accommodate access population from a city
Physical factors that effect population structure
areas of isolation = lower population densities and population decline
Isolated areas are poorly connected to areas of employment and services
Weather provides challenged e.g. winter causing power failures and become cut off from services (Scottish highlands)
How historical development caused differences in population structure
cities have expanded
Land use directly effects population density
Inner city has high density due to Industrial Revolution
Suburban has more space
Role of planning on population structure
green belts 1947 to prevent urban sprawl
Local and national government play a role
They decide on planning permission , housing and infrastructure
Regeneration projects
Creating enterprise zones to attract businesses
Population characteristics of wetherby, Leeds and harehills + gipton
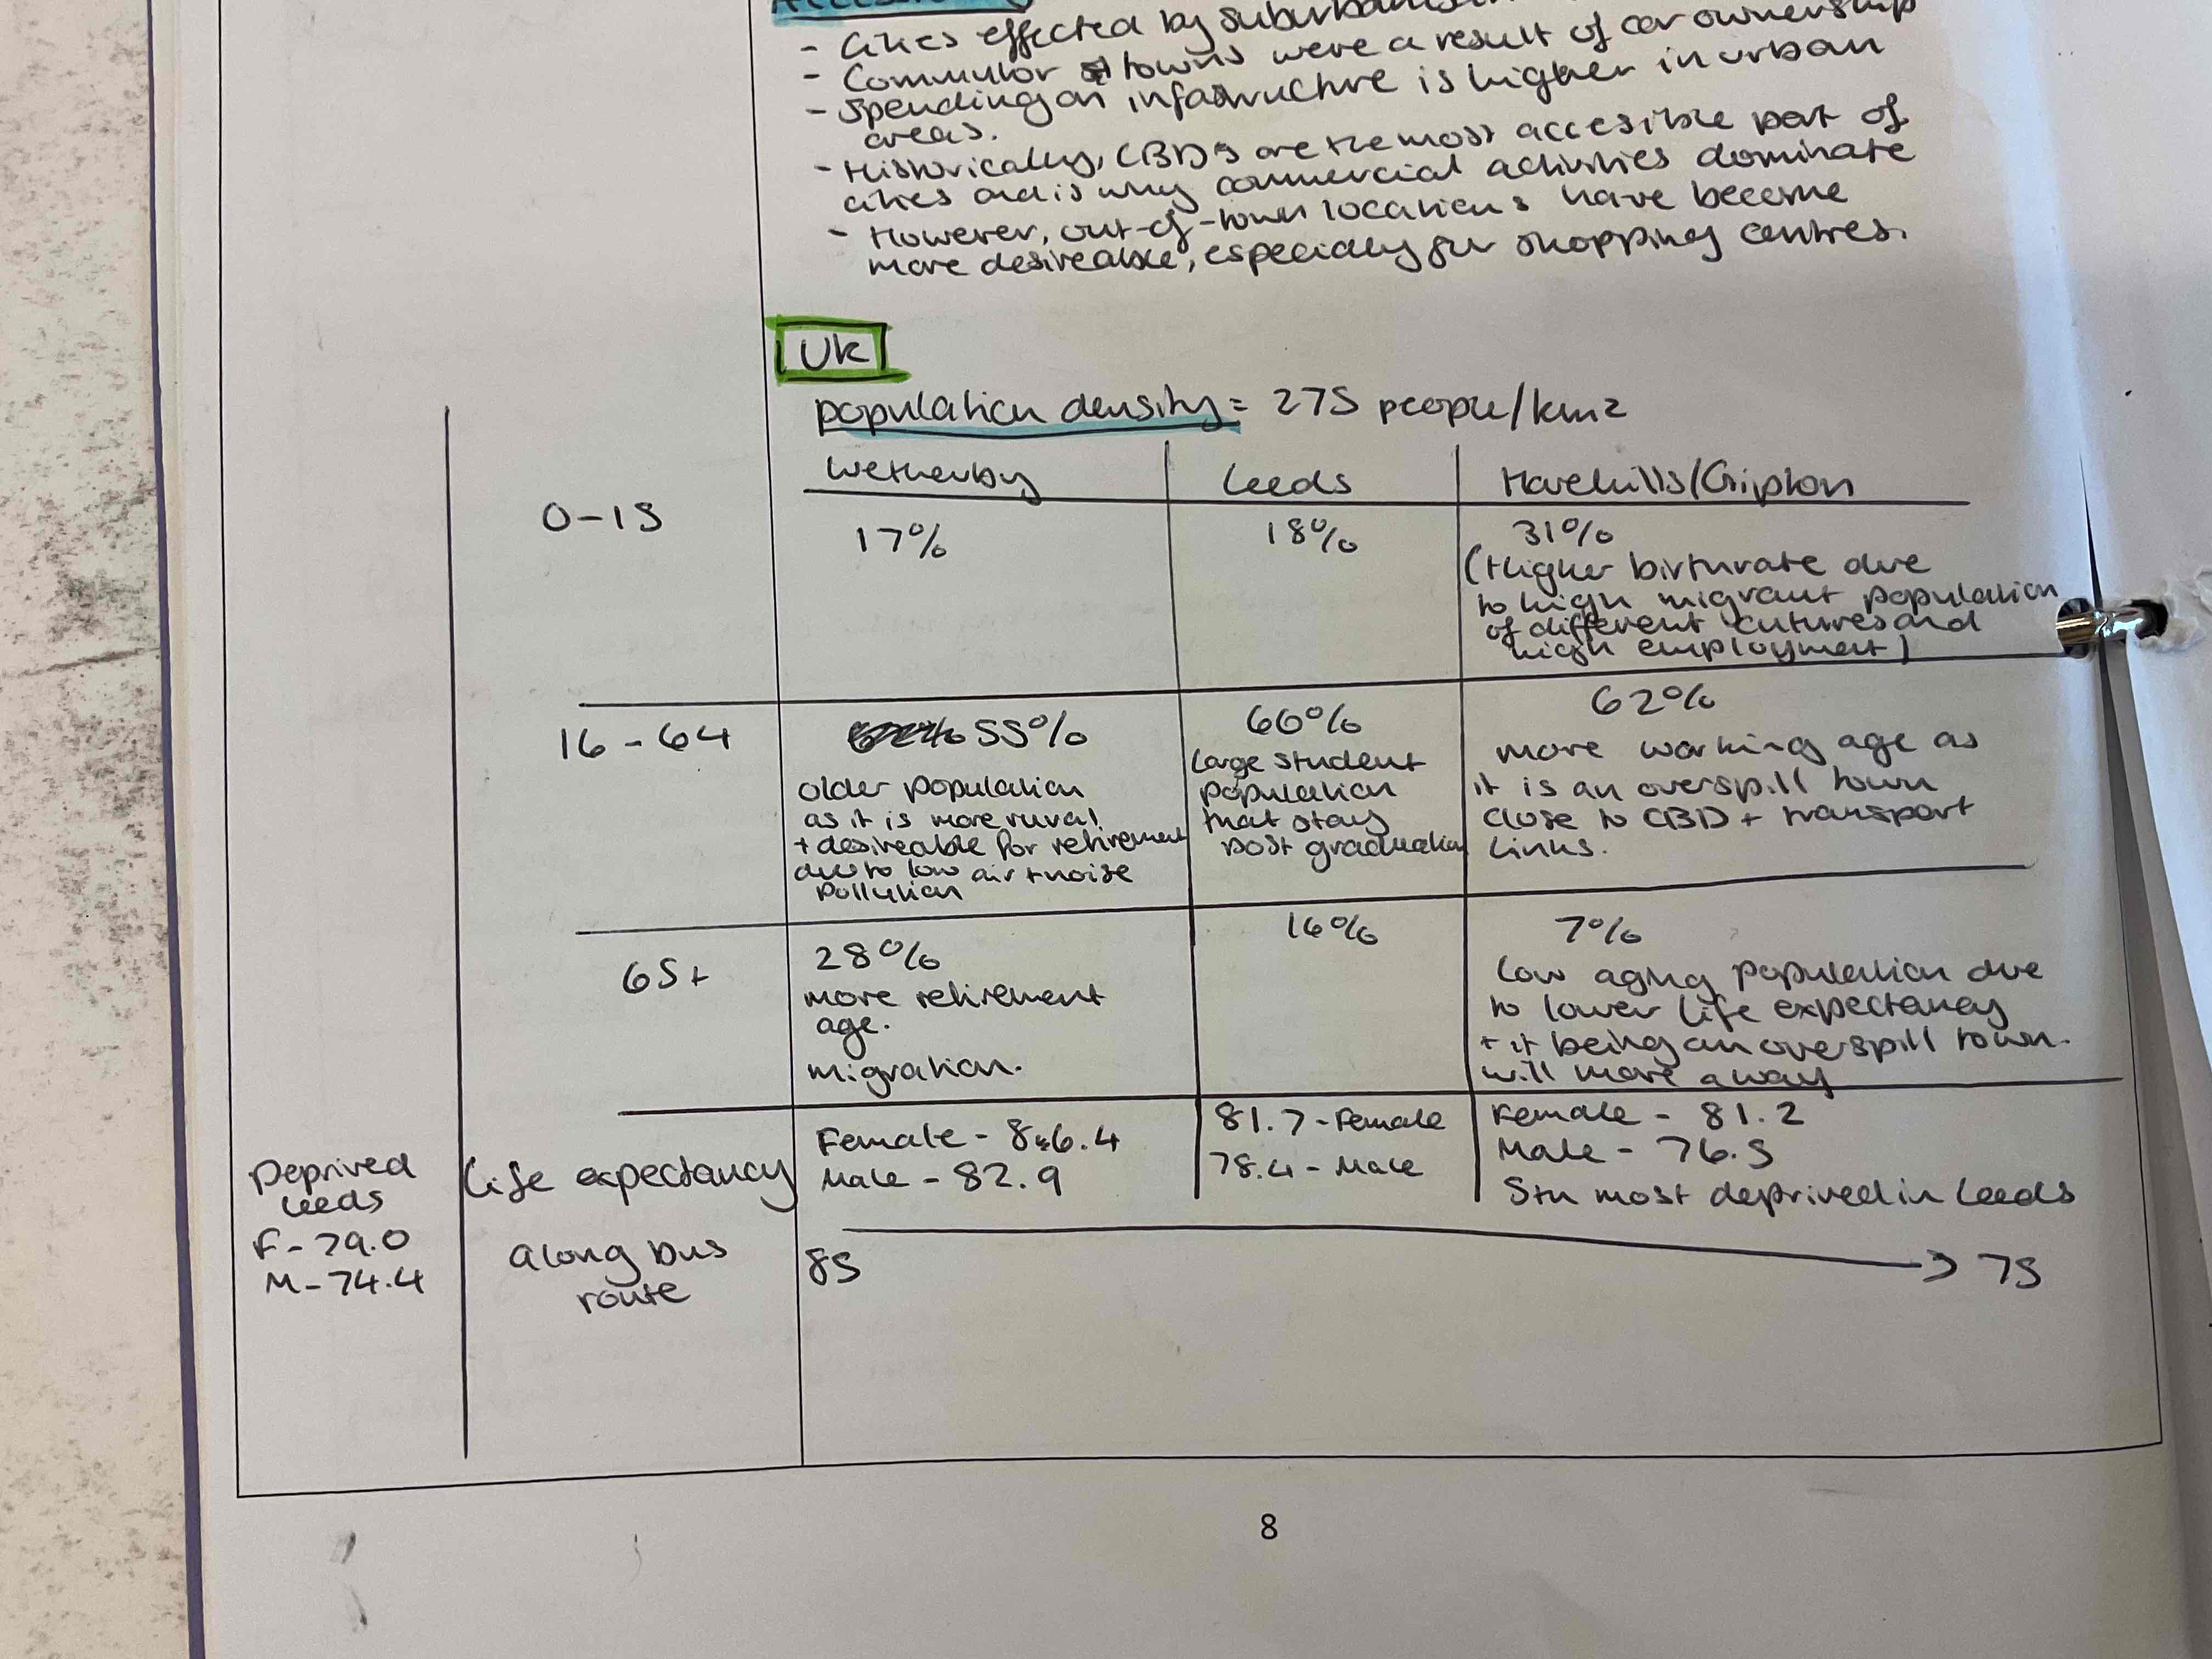
Wetherby population characteristics
Aged 0-15 is 17% of pop
16-64 is 55%
65+ is 28% due to retirement, migration and less noise and air pollution
Life expectancy 86.4 F and 82.9 M
Leeds population characteristics
0-15 is 18%
16-64 is 66% large student population that stay post graduation
65+ is 16%
Life expectancy 81.7 F and 78.5M
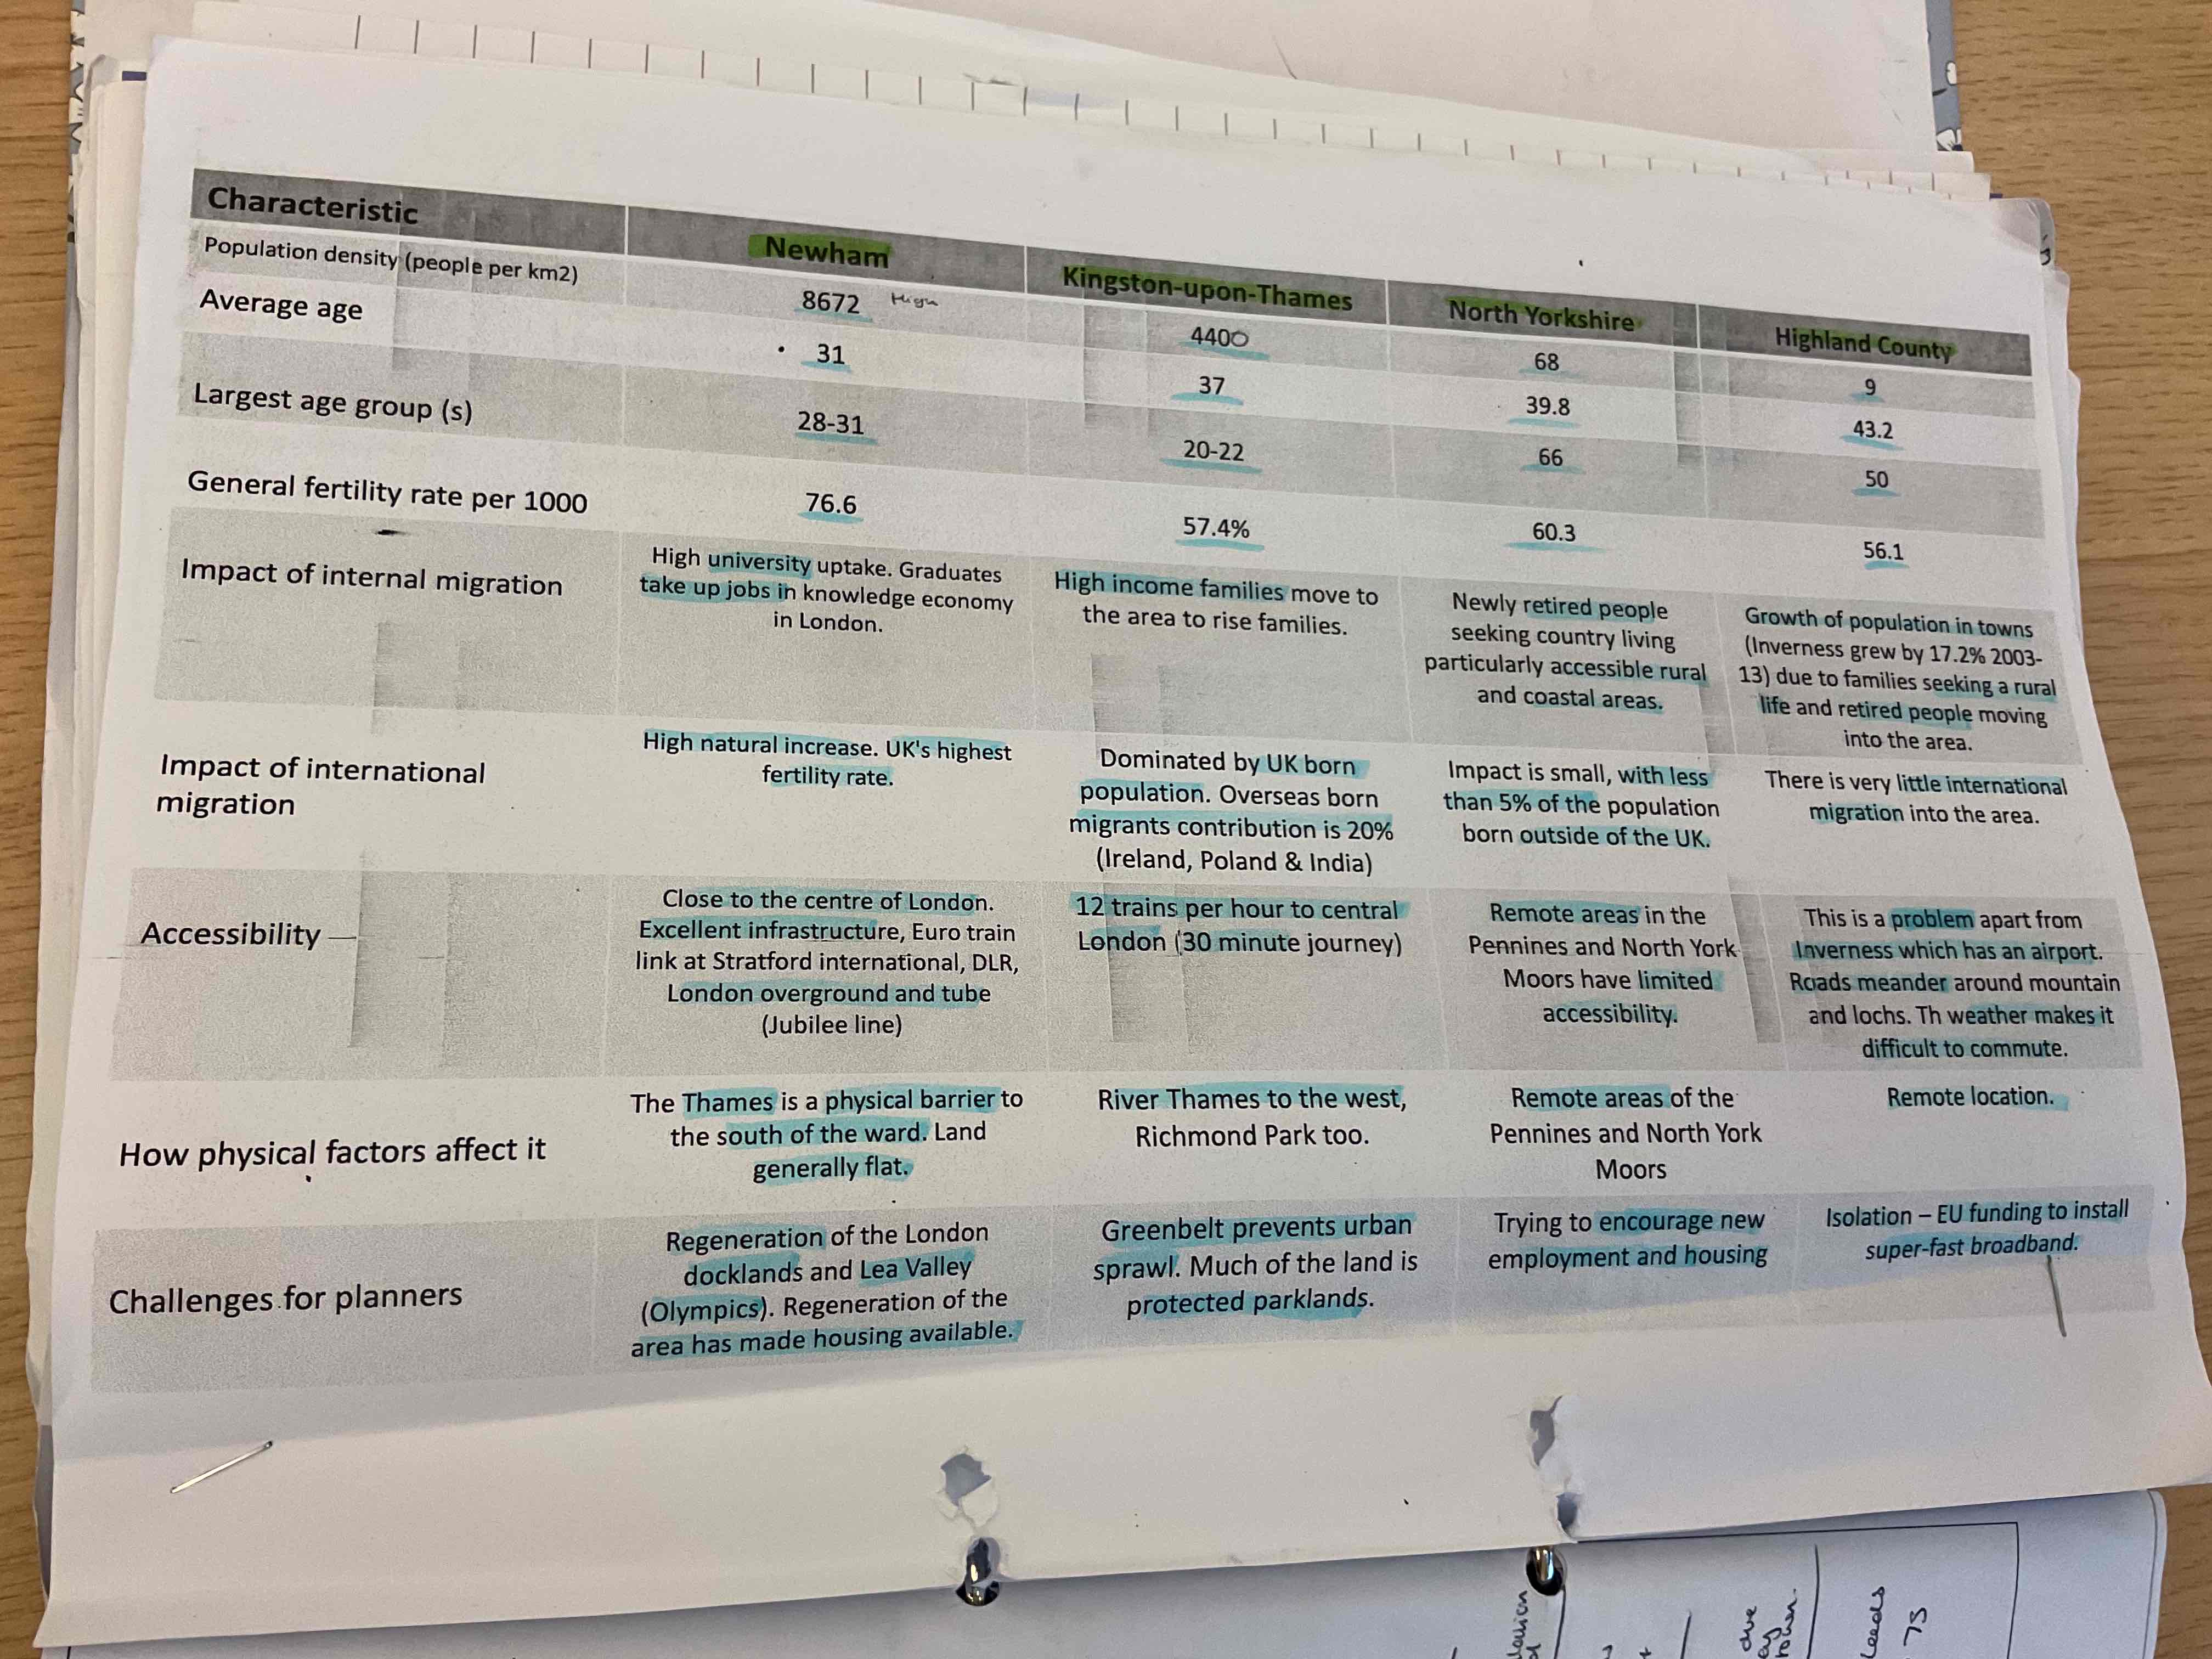
Characteristics of Newham
population density - 8672
Avg age - 31
Largest age group - 28-31
Fertility rate per 1000 - 76.6
Internal migration- high uni intake , graduates take up jobs in knowledge economy in London
International migration- high natural increase, highest fertility rate in the UK
Accessibility- close to centre of London , excellent infrastructure, London over ground + tube
Physical factors - Thames is a physical barrier, flat land
Challenges for planners - regeneration of dock lands, regeneration has made housing available
Characteristics around the UK
Characteristics in Leeds
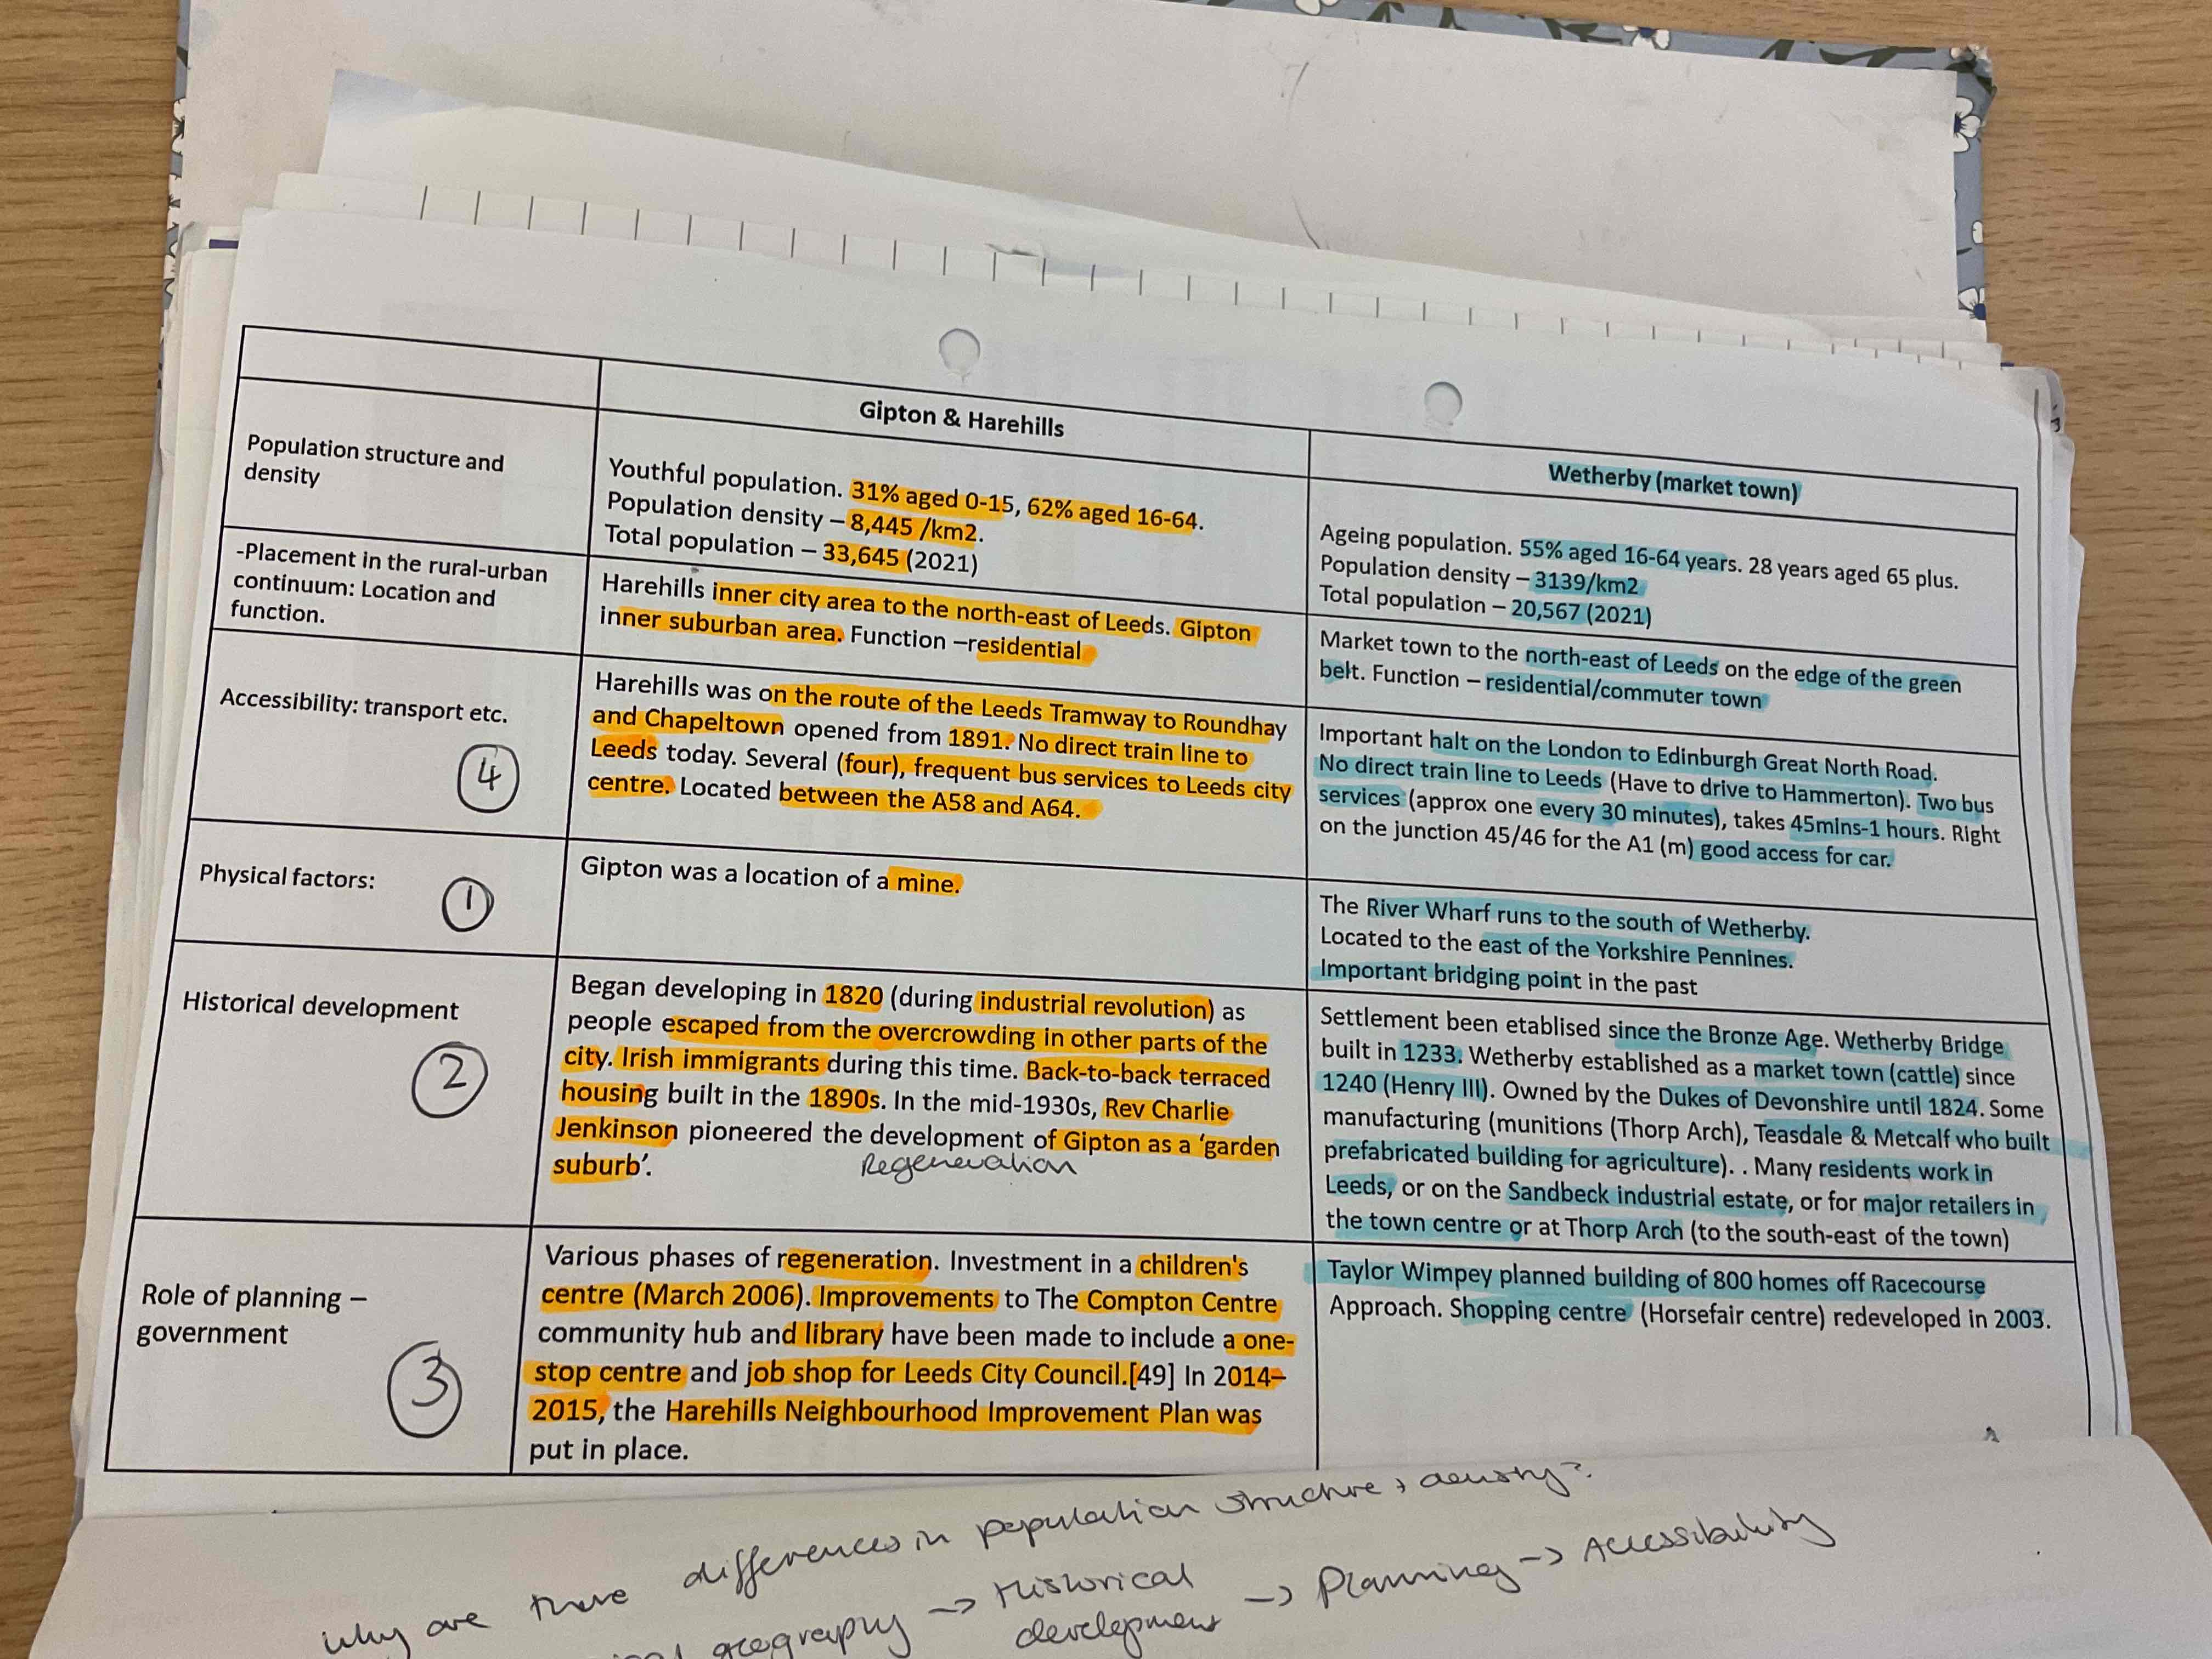
Role of planning in Harehills
regeneration in the children’s centre
Job shop
Harehills Improvement Plan