OCR A Level Biology - Stats!
1/20
There's no tags or description
Looks like no tags are added yet.
Name | Mastery | Learn | Test | Matching | Spaced | Call with Kai | Chat |
|---|
No analytics yet
Send a link to your students to track their progress
21 Terms
What is a hypothesis?
A statement about what you expect your results will show
What is a null hypothesis?
A statement that says that there will be no significant different / correlation between the things you are measuring. You want to disprove the null.
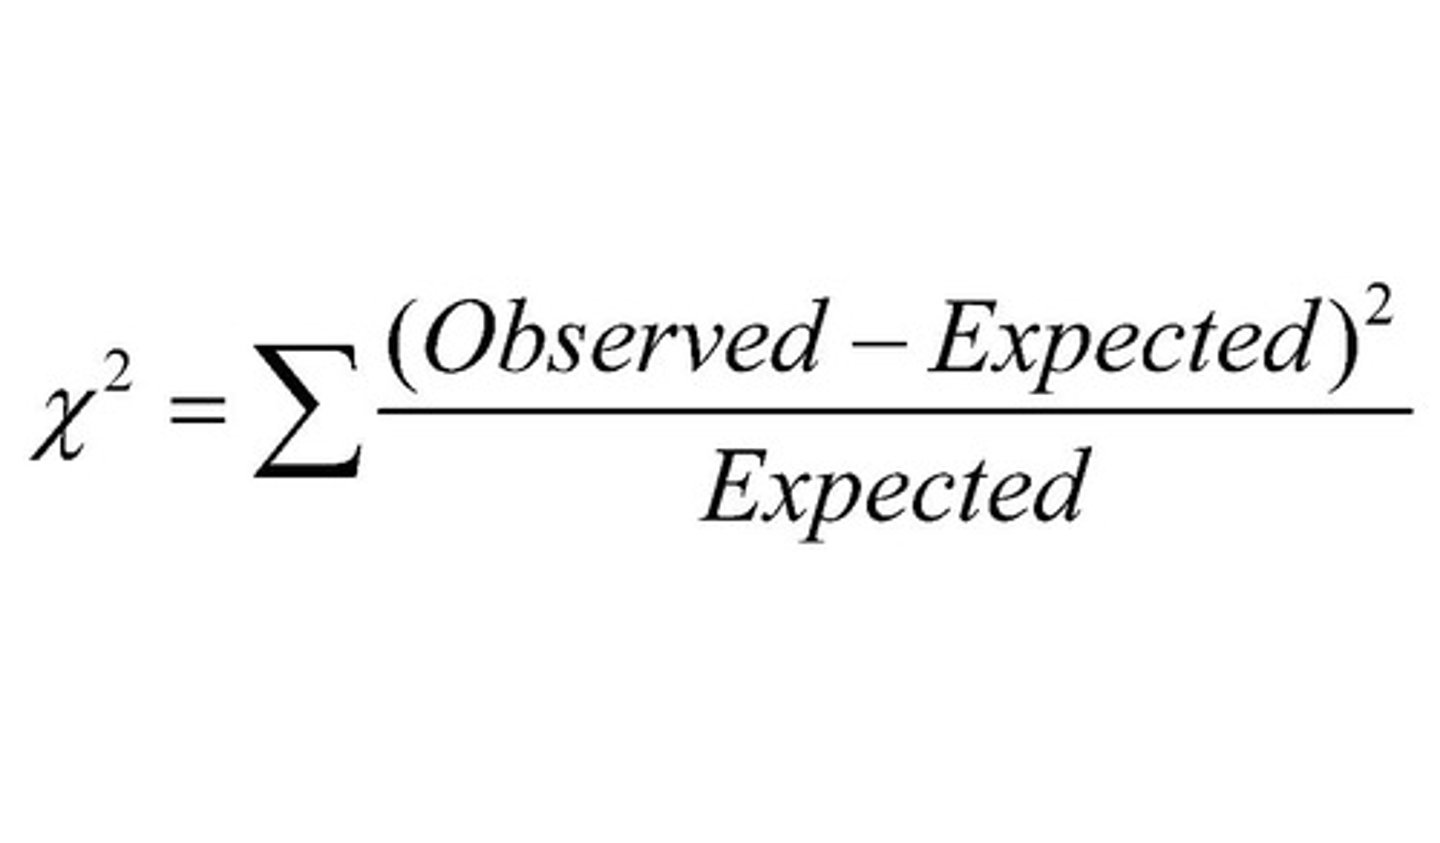
When would you use the Chi-Squared test?
If you wanted to look at differences in frequencies between groups. E.g. Is there a difference between the frequency of different bird species at 2 different sites?
Chi-Squared test: how do you work out degrees of freedom?
If you have a table with just 1 row or column:
df = number of classes - 1
If you have a table with more than 1 row:
df = (number of rows - 1) x (number of columns - 1)
Chi-Squared test: how do you know if the data is significant?
If your value for Chi-Squared is EQUAL TO or GREATER THAN the critical value, there is a significant difference and you can REJECT the null hypothesis.
Chi-Squared test: What is the equation?
When would you use Spearman's Rank?
Spearman's Rank involves ranking data in order of size. It gives you a numerical value to tell you the strength and direction of the correlation
What is a correlation coefficient?
It tells you the strength and direction of a correlation. It can take any value from -1 to 1.
A negative number shows a negative correlation.
A positive number shows a positive correlation. The further away from zero the correlation coefficient is, the stronger the correlation.
Spearman's Rank: How do you know if the data is signficant?
Compare your correlation coefficient to the critical value by using n = number of observations and the relevant probability level (usually P = 0.05).
If your value is GREATER than the critical value, the correlation is SIGNIFICANT and you can REJECT the null hypothesis.
When would you use the Students t-Test?
If you wanted to find out if the difference between means is significant.
When would you use the UNPAIRED Students t-Test?
If you are comparing the means of two groups of different individuals. Data must be in two categorical groups and interval data (measured on a scale where the units are the same).
Unpaired Students t-Test: How do you work out degrees of freedom?
df = n1 + n2 -2
Where n is the number of values in each data set
Unpaired Students t-Test: How do you know if the data is signficant?
If the value of t is GREATER THAN or EQUAL to the critical value, the difference between the two means is signficant and you can REJECT the null hypothesis.
When would you use the PAIRED Students t-Test?
If you wanted to compare the means of two sets of data that have come from the same individuals.
E.g. two measurements taken before and after an event.
Paired Students t-Test: How do you work out degrees of freedom?
Count up the number of pairs of data - this is 'n' and subtract 1:
df = n - 1
Paired Students t-Test: How do you know if the data is signficant?
If the value of t is GREATER THAN or EQUAL to the critical value, the difference between the two means is signficant and you can REJECT the null hypothesis.
How do you calculate Simpson's Index of Diversity?
D = 1 - (Σ(n/N)2)
When would you use Simpson's Index of Diversity?
When you want to measure the diversity of an area, taking into account how many species there are and how evenly individulas are spread between species.
How do you interpret your calculated value for Simpson's Index of Diversity?
The number will be positive and between 0 - 1.
If D = 0, then all the organisms in the area are the same species (there is no diversity).
The closer to 1 you get, the more diverse the area is.
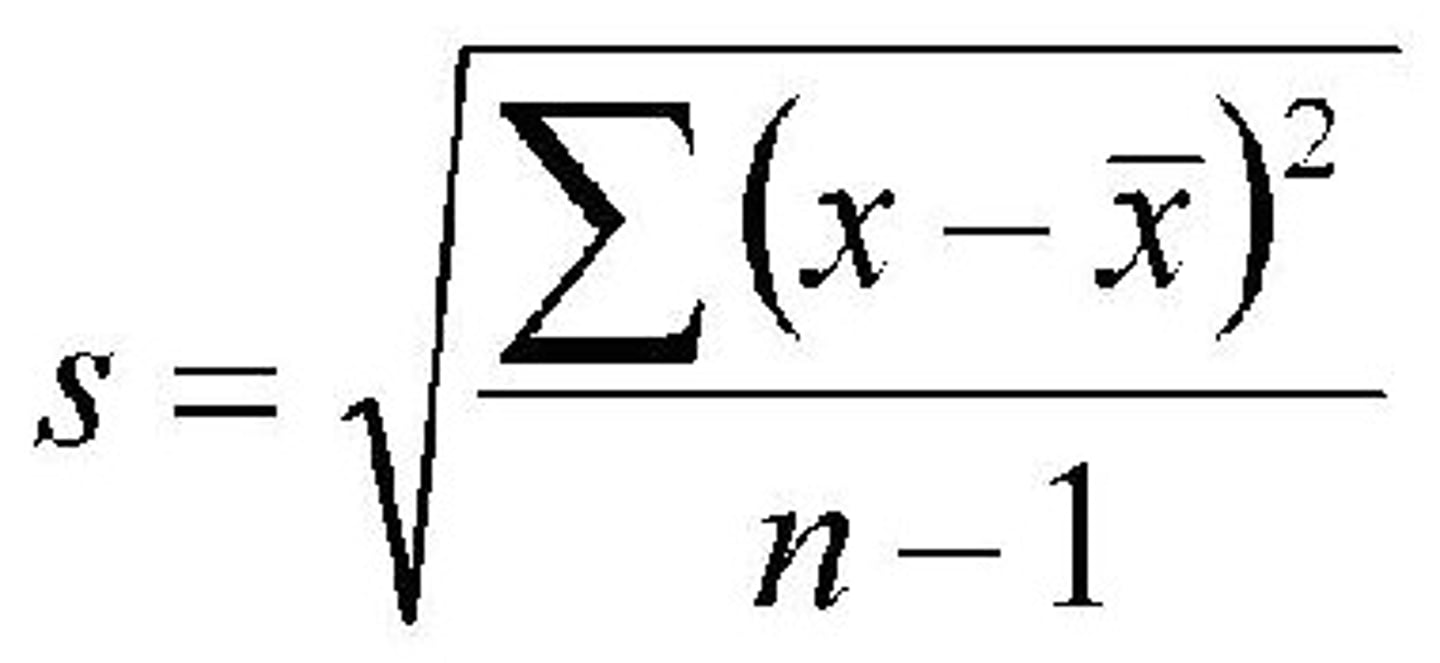
What does standard deviation show you?
SD = The spread of data about the mean.
It is a better measure of spread than looking at the range as it is less affected by extreme values.
What is the equation for standard deviation?