MIDTERM BRUH
1/84
There's no tags or description
Looks like no tags are added yet.
Name | Mastery | Learn | Test | Matching | Spaced |
|---|
No study sessions yet.
85 Terms
nursing research
The systematic, logical, and empirical inquiry that uses rigorous guidelines to produce unbiased, trustworthy, and verifiable answers to questions about nursing practice
evidence-based practice
Involves integration of a problem-solving approach within the context of caring, considering best evidence from studies, clinical experience and expertise, and understanding of pt’s preferences and values
impact of nursing research vs. the impact of EBP
Nursing research: Generates new knowledge for practice and adds to our professions’ knowledge base through the literature
EMP: translating knowledge with a goal of improving practice
Deductive reasoning
More general → More specific, Top down, sequential process moving from a general, broad interest to a very specific research question
Inductive reasoning
More specific → More general, Bottom up, where a specific observation leads to a general focus or interest (frequently the source of evidence-based practice studies)
What is a PICO question?
a tool used to frame a focused clinical or research question using the acronym P-I-C-O, which stands for Patient or Population, Intervention, Comparison, and Outcome
PICO(T)
population/patient, how would I describe the group of patients to study?
PICO(T)
Intervention/indicator, Which main intervention, management strategy, diagnostic test, prognostic factor, or exposure am I interested in?
PICO(T)
Compare/Control, Is there a control or alternative you would like to compare to the intervention
PICO(T)
Outcome, What can I hope to accomplish, measure, improve or effect?
PICO(T):
time, What time periods should be considered?
What is sampling? Why is it important?
The process of selecting part of a larger group with the intent of generalizing from the smaller group, called the sample, to the larger group, the population
Important because it is often impractical or impossible to study an entire population, making sampling a more efficient and cost-effective way to collect data
the specific, smaller group of individuals selected from the accessible population to participate in the study
Target population
the entire group of individuals a researcher wants to study
Accessible population
the subset of the target population that is practically available to the researcher
Sampling Error
Difference between the sample statistic and the population parameter
The first source is from the target population to the accessible population. The accessible population may not be representative of the target population.
The second source is from the sampling design or selection of participants. Most research designs focus on addressing this source.
The third source involves transitioning from the selected sample to the actual sample.
What affects sampling error?
Heterogeneity/variance- increased heterogeneity = increased sampling error
Sample size- increased sample size – decreased sampling error
Sampling error tells us how precise our estimates are
Small SE – more precise
Large SE – less precise
Point Estimates
o the use of sample data to calculate a single value (known as a point estimate since it identifies a point in some parameter space) which serves as a best guess or best estimate of an unknown population parameter
o Provides poor approximation of the unknown true parameters; the magnitude of the difference between the statistic and the parameter is called sampling error
Interval estimate
often shown as error bars, represent a range where the true value is likely to fall
What does a small or large standard error/confidence interval mean?
o Small standard error or narrow confidence interval means the estimate is more precise and likely closer to the true population value
o A large standard error or wide CI means the estimate is less precise with more uncertainty about how close it I to true value
o Smaller values usually come from larger samples or less variability in the the data
What do overlapping or not overlapping interval estimates mean?
o If error bars between groups overlap, there may be no significant difference
o If the error bars do not overlap, a significant difference is more likely
Biophysiological measures
Objective
Variety of technical instruments for measuring physiologic functions
Examples: temperature, BP, labs, weights
Limitations: Cost, require specialized training to collect and/or process, instrument malfunction/inaccuracy
Records
Existing data are a data source
Secondary data analysis- using data that was collected as part of a research study to answer questions other than the main study question
Electronic health records (HER)
Limitations: dependent on the data that was previously collected, both the content and the quality
Structured Observation
One of the most frequent methods for collecting data is through observation of individuals or groups of individuals
Data collected by observing
Used to document behaviors, actions, or events
Most often unconcealed (subject knows they are being observed)
Observe subject in nature or laboratory
Observations observed using videotaping, one-way mirror
Checklists, rating scales are used to assign numeric values to the observations
Advantages: ability to describe observed behavior as a quantitative variable
Disadvantages: time intensive, requires considerable training, training is essential for observers because inaccurate data collection threatens the validity of research findings
Survey- Questionnaires/Self-Report
Use questionnaires(may be one scale or contain several subscales) to elicit information from subjects
Useful when the researcher is interested in perceptions, beliefs, attitudes, or opinions
Subjective (self—report)- variables that cannot be directly observed or measure with physiological instruments, Ex: Pain, Quality of Life, Depression, Anxiety, Worry
Written, online/electronic, telephone
Rating scales, checklists, Likert scale (an ordered scale from which respondents choose one option that best aligns with their view)
Can also conduct interviews where subjects are verbally asked open or closed ended questions useful when more personal information is needed or only way to collect data(ex: pt is blind or cannot read)
PROMIS- Patient Reported Outcomes Measurement Information System
Advantages: relatively inexpensive and easy to do
Disadvantages: Social desirability bias, Recall bias, Response bias
Considerations: for the data collected to be valid, the measures must be both valid and reliable
Compared to interviews, questionnaires are less expensive, more confidential, and have less interviewer bias, but provide less rich data and can have a lower response rate and more missing data
Reliability
o Extent to which the outcomes are consistent when measure more than once
o Consistency, Precision, Reproducibility
o Without reliability, we have no confidence in the data we collect
o The reliability coefficient is numerical index to describe reliability
o A reliability coefficient of 0 indicates consistency is totally absent
o A reliability coefficient of +1 indicates consistency is totally present
Test-retest reliability
to what degree does a person’s measure performance remain consistent across repeated testing?
Alternate-Forms Reliability
Consistency between 2 forms of the same instrument with a brief period of time in between
Internal Consistency Reliability
To what extent do the individual items that go together to make up a test or an inventory consistently measure the same underlying characteristic? Are all items in an instrument measuring the same concept or characteristic? Is the scale unidimensional (the quality of measuring a single concept)?
Interrater Reliability
How much consistency is there among the ratings provided by a group of raters
Validity
o The extent to which the instruments used measure exactly the concept that you want them to measure?
o Does the instrument measure what it is supposed to measure?
o Can we make proper inferences from a given measurement?
o Accuracy and trueness
o Measurement validity is specifically concerned with whether operationalization and the scoring of cases adequately reflect the concept the researcher seeks to measure
o Valid measurement is achieved when scores meaningfully capture the ideas contained in the corresponding concept
Content related validity
involves the degree to which the content of the test matches a content domain associated with the construct; typically evaluated using expert review
Face validity: Does the instrument appear to measure what it aims to measure
Content Validity: Does the test relate to underlying theoretical concepts?
Criterion-related Validity
correlation between the test and a criterion variable(s) taken as representative of the construct; evaluated empirically/statistically
Concurrent validity: amount of agreement between 2 assessments
Predictive validity: Ability to predict something it should theoretically be able to predict
Postdictive validity: Links current measurements with previously obtained criterion scores
Construct-related validity
is the measure associated with things it should be associated with and not associated with things it should not be associated with; evaluated empirically/statistically
Convergent validity: Degree to which the operationalization is similar to other operationalizations that it theoretically should be similar to
Discriminant or divergent validity: Degree to which the operationalization is not similar to other operationalizations that it theoretically should not be similar to
Social desirability bias
tendency to act or report an answer in a way that the subject deems to be more socially acceptable than would be their true behavior or answer
Observer bias
tendency of an observer to “see what is expected or wanted”; knowledge of study goals or hypotheses influence researcher observations
Recall bias
inaccurate or incompleteness of recollection about past events or experiences
Response bias
individuals who complete the survey may be different from those who do not
Acquiescence bias
tendency to agree
Extreme Response bias
Naysayer- always select the negative; Pollyannas- everything is always excellent
Quantitative
Purpose: To test relationships, assess cause and effect, and quantify data.
Approach: Objective, numerical, measurable.
Data: Numbers, statistics, measurable variables.
Reasoning: Usually deductive (general theory → specific hypothesis).
Research questions: Often begin with “What,” “How many,” “To what extent.”
Common designs: Descriptive (e.g., surveys), Correlational, Quasi-experimental, Experimental (Randomized Controlled Trials = “gold standard”)
Qualitative
Purpose: to explore meanings, experiences, and human perspectives
Approach: subjective, interpretive, context-based
Data: words, themes, observations, interviews
Reasoning: usually inductive (specific observations broader theories)
Research questions: Often begin with How, Why, What is it like
Common designs: Phenomenology (lived experiences), Grounded theory (develop theory from data), Ethnography (culture/group study), Case study (in-depth analysis of a sing case or small group)
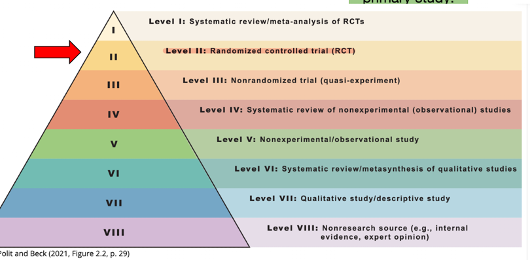
Hierarchy of evidence
Three required properties of true experimental design
Randomization: each subject in the study has an equal chance of being assigned to the control group or the experimental group; assumes that the potentially confounding variables will be equally distributed between the groups, minimizing bias
Manipulation: “Doing something” to at least some of the subjects; the independent variable (predictor, experimental treatment) is manipulated
Control: Subjects in the control group receive the usual treatment or a placebo(substance or treatment that seems to be “real” but is designed to have no therapeutic value
blinding
Both groups will be treated identically in all respects except for the intervention being tested and to this end pts and investigators will ideally be blinded to which group an individual is assigned
allocation concealment
Hides the sorting of trial participants into groups so that this knowledge cannot be exploited
intervention fidelity
Participants receive the intervention or instructions exactly as described in the study protocol
intention to treat analysis
Pts are analyzed within the group to which they were allocated, irrespective of whether they experienced the intended intervention → allows the investigator to draw accurate conclusions regarding the effectiveness of an intervention at the level of adherence in the study
Independent variable
the variable that is manipulated, controlled, or categorized by the researcher to see how it affects another variable
Dependent variable
the outcome or effect that is measured in response to the independent variable
What makes a quasi-experimental design different than an experimental design?
An empirical intervention (active manipulation) study used to estimate the causal impact of an intervention on target population without random assignment; there may be a control group but not necessary
confounding
Variable that influences both the dependent variable and independent variable, causing a spurious association
bias
Any trend or deviation from the truth in data collection, data analysis, interpretation, and publication which can cause false conclusions
Lack of randomization can affect the validity of findings
Strengths and weakness of quasi-experimental designs
Strengths
Practical, less expensive, generalizable, and sometimes the only feasible alternative because these designs are more adaptable to real-world settings
Replication of a study by different investigators at different locations can strengthen evidence
Weaknesses
Unable to demonstrate clear cause-and-effect relationships
Change we see in groups could be attributed to another factor other than the intervention
Difference between observational and experimental/quasi-experimental designs
The investigator simply observes
No interventions are carried out by the investigator; only direct observation of individuals in their natural setting
The most important difference is the lack of manipulation by the investigator in observational designs
Cohort
Can not show causes and effects
Individuals with exposure of interest and individuals without exposure of interest are identified
Groups are studied to find out which groups are more likely to develop the outcome
Typically prospective- individuals are followed over time and data about them is collected as their characteristics of circumstances change
Objective
Incidence- new cases of outcome during a specified time period
Relative risk- compares the rate of an outcome in 2 groups
Prognosis/natural history- course of a disease
Advantages:
Used for research on risk factors- often mandatory when RCTs are unethical
Establish a sequence of events as cohort studies measure potential causes before the outcome has occurred the study can demonstrate that these causes preceded the effect
Single study can examine various outcome variables
Disadvantages
Inefficient for rare outcomes
Loss of subjects to follow-up can significantly affect the outcome
Inability to control for potentially confounding variables
Sampling bias
Expensive and often take a long time for sufficient outcome events to occur to produce meaningful results
Case-control study
Individuals with outcome of interest (cases) and individuals without outcome of interest (controls) are identified
Groups are studied retrospectively to compare the frequency of the exposure to a risk factor in order to estimate the relationship between the risk factor and the subsequent outcome
Objective:
Odds ratio: likelihood of developing the outcome for a person who is exposed to the factor as compared to that who is not exposed
Advantages
Simple to organize
Good to studying infrequent events- where the outcome is rare or has a long latent period between exposures and disease, may be the only feasible approach
Cheap and efficient- relatively few subjects are required compared to other designs
Useful for generating hypotheses that can be tested in another study
Disadvantages
Limited to 1 outcome
Confounding variables
Sampling bias
Recall bias
Observation bias
Cross-sectional study
Collect data simultaneously on both exposure and outcome at one given point in time
Only one group is used with no reference to exposure or outcome
Subjects are neither deliberately exposed, treated, or not treated and seldom ethical difficulties
Data is collected once at one point in time
Often use questionnaires or surveys
Objective:
Determines if exposure is related to the outcome by comparing the prevalence of the outcome in exposed and unexposed individuals
Prevalence is vitally important to the clinician because it influences considerably the likelihood of any particular diagnosis and the predictive value of any investigation
Advantages
Quick and cheap, no follow-up so less resources are required
Best way to determine prevalence and are useful at identifying associations that can then be more rigorously studied using a cohort study or RCT
Disadvantages
Difficult to differentiate cause and effect from simple association
Often there are a number of plausible explanations for results
Rare conditions cannot be efficiently studied because even in large samples there may be no one with the disease
Sampling bias
internal validity
Degree to which change in the dependent variable can be definitely attributed only to the independent variable, and not to extraneous variables
Did the “exposure” cause a difference in the outcome (high internal validity) or was a difference in the outcome caused by systematic error in the study (low internal validity)
Can be compromised by not having a control group or by having a control group that is not comparable to the exposed group in measurable or unmeasurable ways
The 2 common sources of threat are bias and confounding variables
external validity
Generalizability of findings of an experimental study to other people and settings
It is the degree to which the conclusions in a study would hold for other persons in other places and at other times
One indication that a study lacks external validity is if the sample us not representative of the target population
What is a systematic review?
A review that is conducted according to clearly stated, scientific research methods, and is designed to minimize biases and errors inherent to traditional, narrative reviews
It is designed to answer a focused clinical question and employs a predetermined explicit methodology to comprehensively search for, select, appraise, and analyze studies
The scientific rigor of this process decreases bias and is what makes a systematic review research and distinguishes it from a narrative review
What is a meta-analysis?
A unique type of systematic review and focuses on the quantitative synthesis of research findings
Quantitative statistical approach for systematically combining results of previous research to arrive at conclusions
Focuses on direction and magnitude of the effects across studies
Individual effect sizes from each study are combined and a summary or overall effect size and 95% confidence interval is reported
how to interpret a forest plot
Vertical line = no effect (effect of control = effect of treatment)
Box/Diamond to left of vertical line = outcome of interest more desirable in intervention than control group
Box/Dimond to right of vertical line = outcome of interest more desirable in control than intervention group
If 95% CI touches or crosses “no effect” line, then the difference on the outcome between the treatment and control group was not statistically significant
Width of diamond (overall pooled effect size) is the 95% CI. If it DOES NOT touch or cross the “no effect” line, then the meta-analysis indicates a statistically significant difference on outcome between treatment and control group
Nominal
classify data into categories; gender
Ordinal
relative rankings of data; disease severity
Interval
rank on a scale with equal intervals; can be positive or negative; temperature
Ratio
ranking on scale with equal intervals and with an absolute 0; height/weight
Confidence intervals
An interval of scores around a statistic
Computed by adding and subtracting a specific value to a calculated statistic; adding the specific value yields an upper limit, subtracting the specific value produces a lower limit
The confidence level is indicated by a percentage, usually 90, 95, or 99%
If the confidence level is 95%, then 95 out of 100 confidence intervals calculated will contain or capture the population mean
Type I error
Error of the first kind
Alpha error
False positive
Reject null hypothesis that is actually true; accept premise that there is a difference when there actually is no difference
Alpha level is usually set at 0.05 but may be set at 0.01
Type II error
Error of the second kind
Beta error
False negative
Accept null hypothesis that is actually false; accept premise that there is no difference when a difference actually exists
Statistical significance
results say nothing about clinical importance or meaningful significance of results; always determine whether statistically significant results are substantively meaningful
Clinical significance
refers to whether the results are meaningful or important in real-world practice; make a noticeable difference in pt outcomes
Emergent design
Initial plan for research cannot be tightly prescribed; researcher may need to change or shift after entering the field and beginning to collect data
Reflexivity
Researcher is conscious of the biases, values, and experiences that they bring to the study
Purposive sampling
Researcher selects individuals and sites for the study because they can purposefully inform an understanding of the research problem and central phenomenon in the study
Data saturation
Data collection stops when no new information is being obtained and redundancy is achieved
Triangulation
Researchers make use of multiple and different sources, methods, investigators, and theories to provide corroborating evidence for validating the accuracy of their study
Memoing
a record of a researcher's conversation with the data, helping to challenge assumptions and build a deeper understanding
Bracketing
Researcher tries to set aside personal interpretation/bias
Coding
The process of aggregating the text or visual data into small categories of information, seeking evidence for the code from different databases being used in a study and then assigning a label to the code
5 common qualitative designs
o Narrative research
o Phenomenology
o Ground theory
o Ethnography
o Case study
Narrative research
study of stories or narrative or descriptions of a series of events that accounts for human experiences
Phenomenology
describes the common meaning of experiences of a phenomenon (or topic or concept) for several individuals; the researcher reduces the experience to a central meaning or the “essence” of the experience → “lived experience”
Ground theory
researcher generates a theory that explains some action, interaction, or process
Ethnography
study of cultural or social groups based on observations and a prolonged period of time spent by the researcher in the field; the researcher listens and records the voices of informants with the intent of generating a cultural portrait
Case study
Study of a case within a real-life contemporary context or setting; follows one person