ISDS 351 Exam #2
1/54
Name | Mastery | Learn | Test | Matching | Spaced |
|---|
No study sessions yet.
55 Terms
Three Sphere Model
Issues that are related to the project completion and success
Business
“What will the tablet cost the college?” “ What will it cost students?” “What will the support costs be?”
Organization
“How will the project affect students who already have tablets or laptops?” “Who will develop special applications or books for the tablets?”
Technology
“What applications will be required?” “How will the tablets affect various networks and speed?”
Frames of Perspectives on Organizations
Structural Frame: Roles and responsibilities, coordination, and control. Organizational charts help describe this frame
Ex: A manufacturing company w/strict hierarchy where workers report to supervisors, who report to managers, who report to CEOs
Human Resources Frame: Providing harmony between needs of the organization and needs of people.
Ex:A nonprofit organization that prioritizes employee well being and professional development
Political Frame: Coalitions composed of varied individuals and interest groups. Conflict and power are key issues.
Ex: A large university where different departments vie for funding and influence
Symbolic Frame: Symbols and meanings related to events. Culture, language, traditions, and age are all parts of this frame.
Ex:A tech startup that fosters innovation through a strong culture of creativity and collaboration
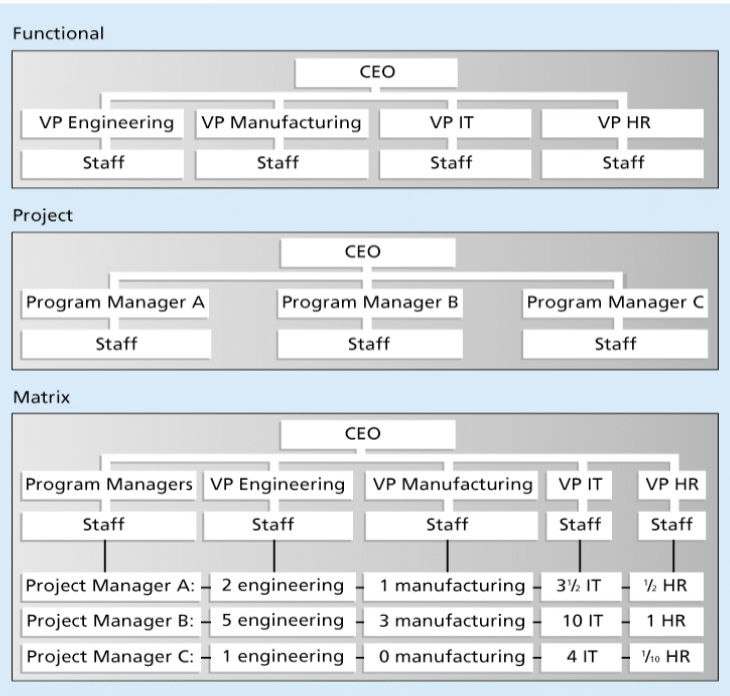
3 Basic Organizational Structures
Functional: functional mangers report to the CEO
Project: program managers report to the CEO
Matrix: middle ground between functional and project structures
Personnel often report to two or more bosses; structures can be weak, balanced or strong matrix
What is Organizational Culture?
Set of shared assumptions, values, and behaviors that characterize the functioning of an organization
Ten Characteristics of Organizational Culture
Member Identity
Risk Tolerance
Group Emphasis
People Focus
Unit Integration
Control
Reward Criteria
Conflict Tolerance
Means-Ends Orientation
Open-Systems Focus
*project work is most successful in an organization culture where these items are strong/high and other items re balanced
Predictive Life Cycle
The scope of the project can be Cleary articulated and the schedule and cost can be predicted
Adaptive Software Development (ASD) Life Cycle
Requirements cannot be clearly expressed, projects are mission driven and component based, using time-based cycles to meet target dates
The Context of IT Projects
IT projects can be very diverse in terms of size, complexity, products produced, application area, and resource requirements
IT project team members often have diverse backgrounds and skill sets
IT projects use diverse technologies that change rapidly. Even wit one technology area, people must be highly specialized
Recent Trends Affecting IT Project Management
Globalization
increase in the flow of goods, services, capital, people, and ideas across international boundaries
Outsourcing
when an organization acquires goods and/or sources from an outside source
Offshoring
outsourcing from another country
Virtual Team
A group of individuals who work across time and space using communication technologies
Project Scope Management
Includes the processes involved in defining and controlling what is or is not included in a project
The project team uses expert judgement and meetings to develop to important outputs: the scope management plan and the requirements management plan
Project Scope Management Process
Plan > Collect > Define > Create WBS > Validate Scope > Control Scope
Requirements Traceability Matrix vs Benchmarking
Requirements Traceability Matrix is a table that lists requirements, various attributes of each requirement, and the status of the requirements to ensure that all requirements are addressed
Benchmarking- generating ideas by comparing specific project practices or product characteristics to those of other project or products inside or outside the performing organization, cn also be used to collect requirements
Work Breakdown Structure (WBS)
a deliverable-oriented grouping of the work involved in a project that defines the total scope of the project
is a foundation document that provides the basis for planning and managing project schedules, costs, resources, and changes
Decomposition
Subdividing project deliverable into smaller pieces
Work Package
A task at the lowest level of the WBS
Scope Baseline
Includes the approved project scope statement and its associated WBS and WBS dictionary
Approaches to Developing WBS
Analogy Approach
Review WBSs of simile projects and tailor to your project
Top-Down Approach
Start with the largest items of the project and break the down
Bottom- Up Approach
Start with the specific tasks and roll them up
Mind-Mapping Approach
A technique that uses branches radiating out from a core idea to structure thoughts and ideas
WBS Dictionary
A document that describes detailed information about each WBS item
Advice for creating WBS and WBS Dictionary
Unit of work should only appear at one place in the WBS
work content of WBS is the sum of the WBS items below it
WBS item is responsibility of only one individual, even if many people are working on it
WBS must be consistent with the way work it is going to be performed
project team embers should be involved in developing the WBS to ensure consistency & buy-in
each WBS item must be documented in WBS dictionary to ensure accurate understanding of the scope of work included/ not included
WBS must be a flexible too to accommodate inevitable changes while properly maintaining control of the work content in the project
Validating Scope
It is very difficult to create good scope statement and WBS for a project
Even more difficult to verify project scope and minimize scope changes
Involves formal acceptance of the completed project deliverables
Controlling Scope
Involves controlling changes to the project scope
Goals are to:
influence the factors that cause scope changes
assure changes are processed according to procedures developed as part of integrated change control, and nag changes when they occur
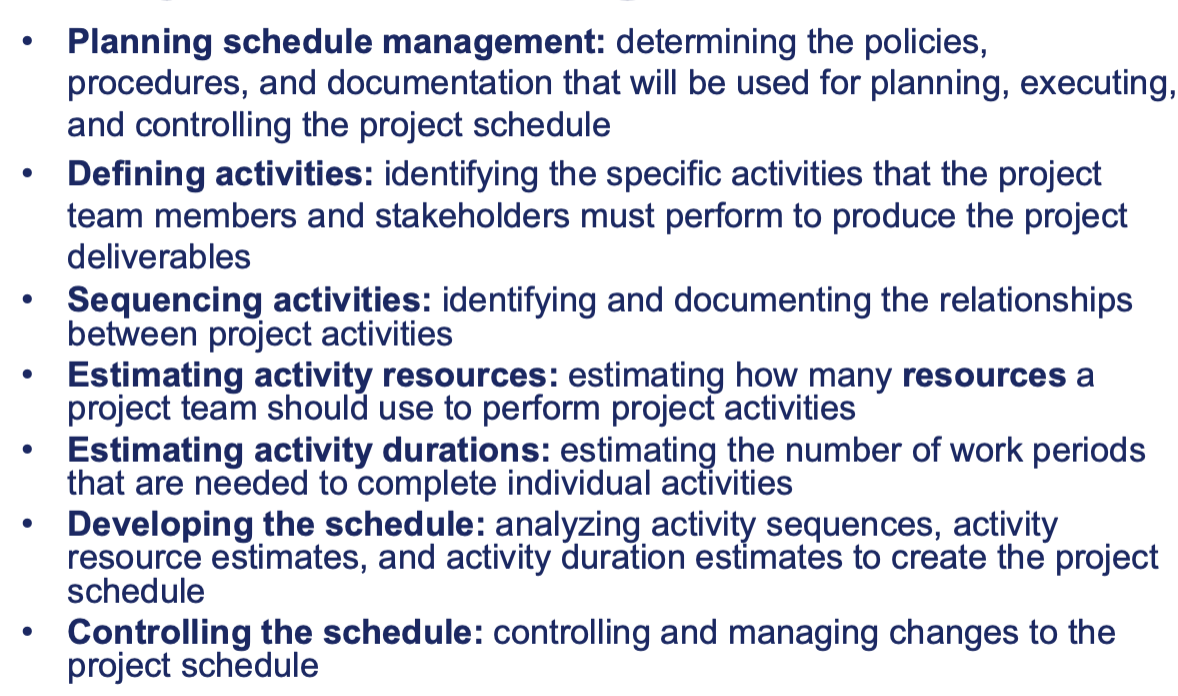
Project Schedule Management
Determines the policies, procedures, and documentation that ill be used for planning, executing and controlling the project schedule
Time Management Processes
Planning > Defining> Sequencing > Estimating activity resources > Estimating activity durations > Developing > Controlling
Three Dependencies
Mandatory Dependencies- inherent in the narrate of work being performed on a project (“Hard Logic”)
Discretionary Dependencies- Defined by project team, sometimes referred to as soft logic and should be used with care since they may limit later scheduling options
External Dependencies- involve relationships between project and non-project activities
Internal Dependencies- within project under control of project team
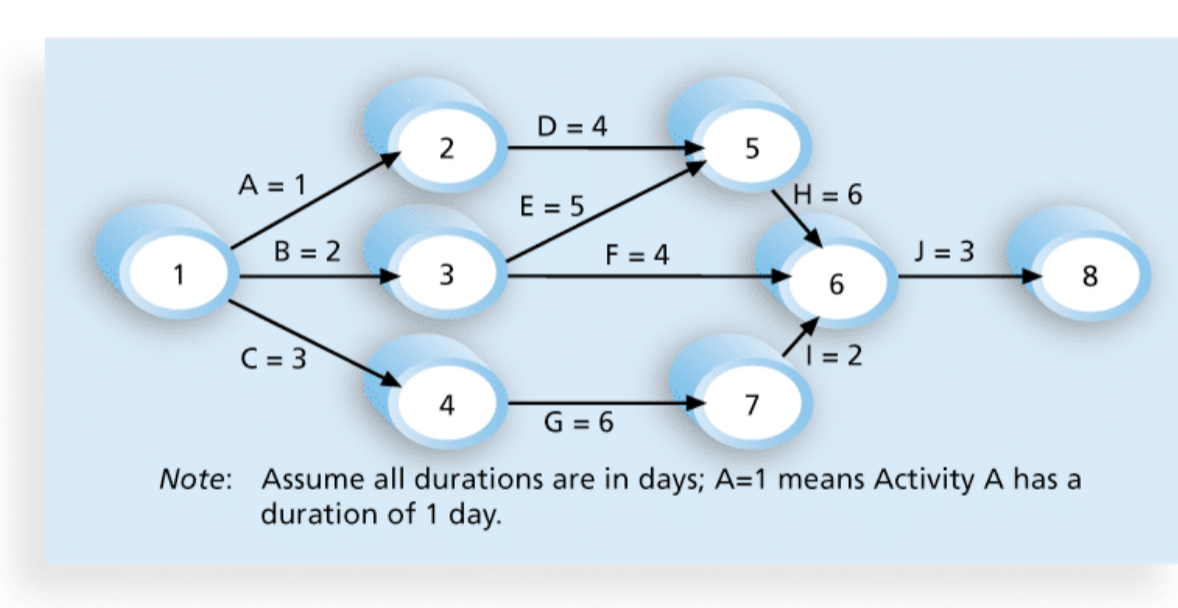
Arrow Diagramming Method (ADM)
Activities are represented by arrows
Nodes/circles are the starting and end points of activities
Can only show finish-to-start dependencies
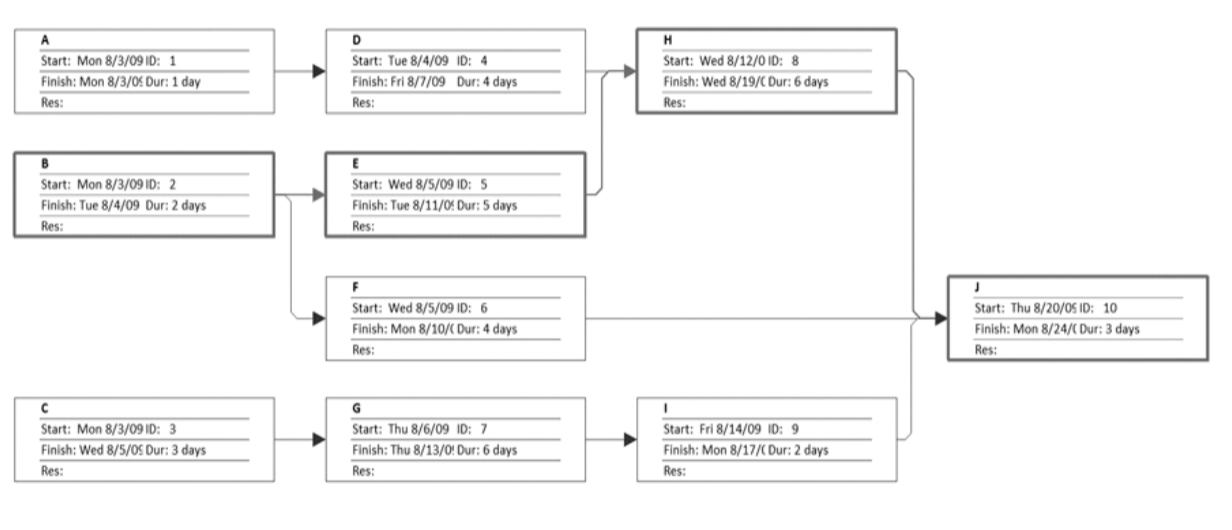
Precedence Diagramming Method (PDM)
Activities are represented by boxes
Arrows show relationships between activities
More popular than ADM method and used by project management software
Better at showing different types of dependencies
Estimate Activity Duration
Includes the actual amount of time worked on an activity including elapsed time (mainly part of schedule management)
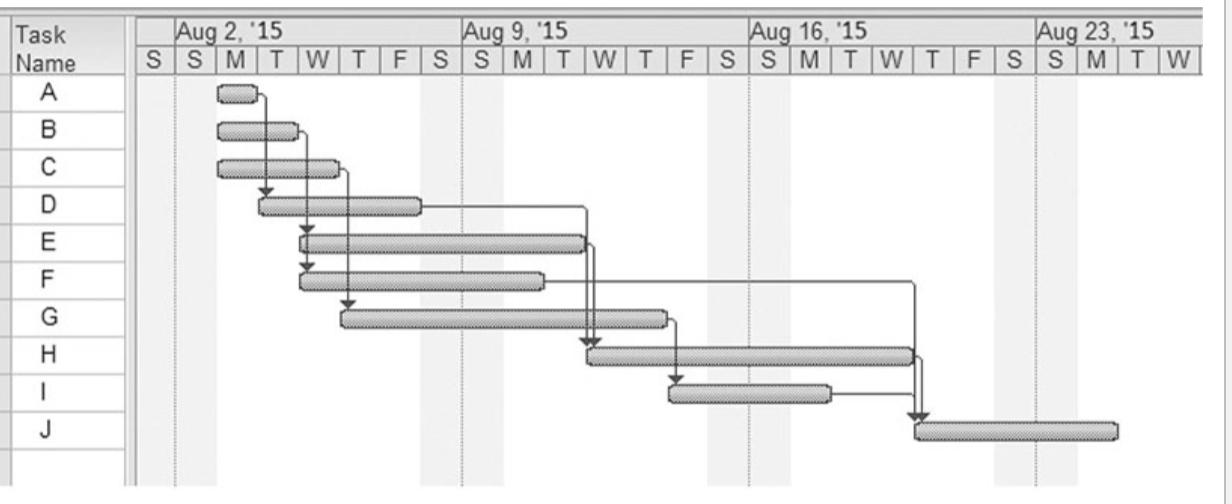
Gantt Chart
Provides a standard format for displaying project schedule information by listing project activities and their corresponding start and finish dates in a calendar format
Symbols include:
>A black diamond: milestones >Thick black bars: summary tasks >Lighter Horizontal Bars: durations of tasks >Arrows: dependencies between tasks
Milestones
Emphasize important events or accomplishments on projects
Should be SMART
Specific-Measurable-Assignable-Realistic-Timeframed
Critical Path Method (CPM)
A network diagramming technique used to predict total project duration
A critical path for a project is the series of activities that determines the earliest time by which the project can be completed
The critical path is the longest path through the network diagram and the least amount of slack
(slack is the amount of time an activity may be delayed without delaying an activity or project finish date)
Three Main Techniques For Shortening Schedules
Shortening durations of critical activities/tasks by adding more resources or changing their scope
Crashing activities by obtaining the greatest amount of schedule compression for the least incremental cost
Fast tracking activities by doing them in parallel or overlapping them
Importance of Project Cost Management
What is a cost?
A resource sacrificed or foregone to achieve a specific objective or something given up in exchange
Types of Costs and Benefits
Tangible Costs: costs or benefits that an organization can easily measure in dollars
Intangible Costs: costs or benefits that are difficult to measure in monetary terms
Direct Costs: costs that can be directly related to producing the products and services of the project
Indirect Costs: costs that are not directly related to the products or services of the project, but are indirectly related to performing the project
Sunk Cost: money that has been spent in the past; when deciding what projects to invest in or continue, you should NOT include sunk costs
Project Cost Management Process
Planning Costs: determine policies, procedures, and documentation that will be used for planning, executing, and controlling project cost
Estimating Costs: developing an approximation or estimate of the costs of the resources needed to complete a project
Determining the budget: allocating the overall cost estimate to individual work items to establish a baseline for measuring performance
Controlling Cost: controlling changes to the project budget
Project Portfolio Management
Five Levels for project portfolio management
Put all your projects in one database
Prioritize the projects in your database
Divide your projects into 2 or 3 budgets based on type of investment
Automate the repository
Apply modern portfolio theory, including risk-return tools that map project risk on a curve
Project Risk Management
Identifying, analyzing, and responding to risk throughout the life of a project and in the best interests of meeting project objectives
Can help improve project success by helping select good projects, determine project scope, and developing realistic estimates
Risk Management Processes
Planning risk management: deciding how to approach and the plan the risk management activities for the project
Identifying risks: determine which risks are likely to affect a project and documenting the characteristics of each
Performing qualitative risk analysis: prioritizing risks based on their probability and impact of occurrence
Planning risk responses: taking steps to enhance opportunities and reduce threats to meeting project objectives
Controlling risk: Monitoring identified and residual risks, identifying new risks, carrying out risk response plans, and evaluating the effectiveness of risk strategies throughout the life of the project
Planning Risk Management
The main output of this process is a risk management plan- a plan that documents the procedures for managing risk throughout a project
The project team should review project documents and understand the organization’s and the sponsor’s approaches to risk
Identifying Risks
The process of understanding what potential events might hurt or enhance a particular project
Tools and techniques include:
>Brainstorming >The Delphi Technique >Interviewing >SWOT Analysis
Risk Utility
The amount of satisfaction or pleasure received from a potential payoff
Risk-Averse: utility rises at a decreasing rate
Risk-Seeking: have a higher tolerance for risk and their satisfaction increases when more payoff is at stake
Risk-neutral: achieves a balance between risk and payoff
Probability/Impact Matrix (Qualitative)
Lists the relative probability of a risk occurring on one side of a matrix or axis on a chart and the relative impact of the risk occurring on the other
Lists the risks and then labels each one as high, medium or low in terms of its probability of occurrence and its impact
Can also calculate risk factors
Decision Tree Analysis (Quantitative)
Diagramming analysis technique used to help select the best course of action in situations in which future outcomes are uncertain
Simulation (Quantitative)
Uses a representation or model of a system to analyze the expected behavior or performance of the system
What is the systems development life cycle (SDLC)? List and describe at least two (2) predictive SDLC models associated with the product life cycle?
A structured process used for developing information systems. It outlines a series of phases that guide the planning, creation, testing, and deployment of software applications or information systems. The primary goal of SDLC is to produce high-quality software that meets or exceeds customer expectations, is delivered on time, and is cost-effective.
Waterfall Model is a linear and sequential approach where each phase must be completed before moving on to the next. The phases typically include requirements gathering, system design, implementation, testing, deployment, and maintenance. This model is straightforward but can be inflexible when changes are needed.
Strengths:
Clear structure and milestones.
Easier to manage due to its sequential nature.
Well-suited for projects with well-defined requirements.
Weaknesses:
Difficult to accommodate changes once the process has started.
Late testing can lead to discovering significant issues close to deployment.
V-Model (Verification and Validation Model)
Description: The V-Model expands on the Waterfall Model by emphasizing validation and verification at each stage. Each development phase corresponds directly to a testing phase. This model highlights the importance of early testing and ensures that each component is verified against requirements.
Strengths:
Clear focus on testing and quality assurance.
Each phase has specific deliverables and validation criteria.
Early detection of defects reduces long-term costs.
Weaknesses:
Still somewhat rigid and less adaptable to changes.
Requires extensive documentation.
Incremental Model
Description: The Incremental Model divides the system into smaller, manageable increments or portions. Each increment is developed, tested, and delivered sequentially. This allows for partial implementation and feedback from users at each stage, which can influence future increments.
Strengths:
Allows for user feedback and adjustments throughout development.
Reduces risk by delivering functional parts of the system early.
Easier to manage smaller projects incrementally.
Weaknesses:
Integration between increments can become complex.
Overall system architecture must be well-defined to accommodate changes.
4.Spiral Model
Description: The Spiral Model combines iterative development with the systematic aspects of the Waterfall Model. It emphasizes risk assessment and allows for incremental refinement of the system through repeated cycles (or spirals). Each spiral includes planning, risk analysis, engineering, testing, and evaluation.
Strengths:
Focus on risk management allows for better handling of uncertainties.
Flexibility to adapt to changes and improve functionality through iterations.
Encourages user involvement and feedback throughout the process.
Weaknesses:
Can be complex and require significant management overhead.
Costly due to continuous risk assessment and iteration.
Sensitivity Analysis (Quantitative)
Technique used to show the effects of changing one or more variables on an outcome
ex:used to determine monthly payments on a loan, Excel is a common tool
Monitor and Controlling Risks
Involves executing the risk management process to respond to risk events and ensuring that risk awareness is an ongoing activity performed by the entire project team throughout the entire project
Main outputs of controlling risks are:
>Work performance information, change requests, updated to project management plans/other project documents
What is project scope management and what does it involve?
Project scope management is a critical aspect of project management that involves defining and controlling what is included and excluded in a project. Its primary goal is to ensure that a project meets its objectives without scope creep—uncontrolled changes or continuous growth in project scope without adjustments to time, cost, and resources.
Scope Planning:
Definition: Establishing the project scope management plan that outlines how the scope will be defined, validated, and controlled.
Activities: Identify project objectives, deliverables, and milestones; determine how scope will be managed throughout the project lifecycle.
Scope Definition:
Definition: Clearly articulating the project's objectives and deliverables.
Activities: Create a detailed project scope statement that includes project boundaries, assumptions, constraints, and key deliverables.
Creating the Work Breakdown Structure (WBS):
Definition: Decomposing the project scope into smaller, manageable components or work packages.
Activities: Develop the WBS to organize and define the total scope, which helps in resource allocation, task assignment, and progress tracking.
Scope Validation:
Definition: Formal acceptance of the completed project deliverables by stakeholders.
Activities: Review and evaluate deliverables against the project scope statement and obtain approval from relevant stakeholders.
Scope Control:
Definition: Monitoring and managing changes to the project scope throughout the project lifecycle.
Activities: Implement change control processes, assess the impact of proposed changes, and ensure that any approved changes are documented and communicated.
What is a work breakdown structure (WBS)? List and discuss at least three (3) approaches to developing a WBS.
A Work Breakdown Structure (WBS) is a hierarchical decomposition of a project into smaller, more manageable components or work packages. It serves as a foundation for project planning, scheduling, and resource allocation, helping project managers organize and define the total scope of the project.
Top-Down Approach
Description: This method starts with the overall project objective and progressively breaks it down into smaller components. The project manager or team begins by defining the major deliverables and then subdivides them into smaller, more detailed tasks.
Advantages:
Provides a clear overview of the project.
Ensures that the entire scope is considered before detailing smaller components.
Disadvantages:
May overlook some details or tasks that are more apparent when starting from the bottom.
Example: In developing a new software application, the WBS might start with the overall application, then break it down into major modules (e.g., user interface, database management, reporting), and further into specific features for each module.
Bottom-Up Approach
Description: This method involves identifying and detailing all tasks and activities needed to complete the project first, then grouping them into higher-level deliverables. Teams typically start by brainstorming all required tasks and then categorize them into larger components.
Advantages:
Ensures that no critical tasks are overlooked.
Encourages team involvement and can enhance buy-in from team members.
Disadvantages:
May result in a lack of focus on the overall project objectives.
Can be time-consuming to aggregate all tasks into higher-level deliverables.
Example: For the same software application project, the team might list all coding tasks (e.g., designing UI screens, developing APIs) first, then group them under relevant modules in the WBS.
Hybrid Approach
Description: This approach combines elements of both the top-down and bottom-up methods. It starts with the main deliverables or objectives, but incorporates team input and task identification at lower levels to ensure comprehensive coverage.
Advantages:
Balances the need for an overall project perspective with detailed task identification.
Enhances collaboration and leverages team expertise in task identification.
Disadvantages:
Can be more complex to manage than using a single approach.
Requires effective communication and collaboration among team members.
Example: In a construction project, the project manager might outline major phases (e.g., site preparation, foundation, structure, finishing) and then work with the construction team to detail the specific tasks within each phase.
What is project risk management? List and describe at least three (3) categories of risk.
Project risk management is the process of identifying, assessing, and controlling risks that could potentially impact a project's objectives. The goal is to minimize the likelihood and impact of negative events while maximizing opportunities. Effective risk management involves planning for risks, monitoring them throughout the project lifecycle, and implementing strategies to mitigate them.
Technical Risks
Description: These risks are related to the technology, tools, and processes used in the project. They may arise from uncertainties in technology performance, design flaws, or integration issues.
Examples:
Software development projects may face risks related to coding errors or compatibility issues with existing systems.
Engineering projects might encounter challenges with new materials or construction methods.
Project Management Risks
Description: These risks stem from the management and execution of the project itself. They can arise from inadequate planning, resource allocation, scheduling, or communication issues.
Examples:
A project may suffer delays due to miscommunication between teams or unclear project objectives.
Changes in project scope (scope creep) can lead to resource strain and impact timelines.
External Risks
Description: These risks are outside the control of the project team and can arise from external factors such as market conditions, regulatory changes, or natural disasters.
Examples:
A sudden change in regulations may require project adjustments, impacting timelines and budgets.
Economic downturns can affect funding availability or resource costs.
List and describe four (4) basic response strategies for negative risks OR list and describe the (4) basic response strategies for positive risks.
Negative:
Avoidance
Description: This strategy involves altering the project plan to eliminate the risk or protect the project objectives from its impact. This could mean changing project scope, schedule, or resources to sidestep the risk entirely.
Example: If a project is at risk due to a potential supplier failure, the project manager might choose to find an alternative supplier to avoid dependency on the risky supplier.
Mitigation
Description: Mitigation strategies aim to reduce the likelihood or impact of a risk. This often involves implementing preventive measures or preparing contingency plans.
Example: For a project that relies heavily on new technology, the team might conduct thorough testing and have fallback systems ready to mitigate potential technology failures.
Transfer
Description: Transferring a risk involves shifting the impact of the risk to a third party, often through contracts, insurance, or outsourcing. The original party is still responsible for the risk, but the financial consequences are borne by someone else.
Example: A construction project might transfer the risk of accidents on-site by purchasing liability insurance, ensuring that any potential costs are covered by the insurance company.
Acceptance
Description: Acceptance involves recognizing the risk and deciding to proceed without any specific actions to mitigate it. This strategy is used when the cost of mitigation is higher than the potential impact of the risk or when the risk is deemed acceptable.
Example: A project manager may accept the risk of minor delays in project delivery due to unforeseen weather conditions, understanding that such delays are a normal part of the project lifecycle.
POSITIVE
Enhancement
Description: This strategy involves taking actions to increase the likelihood or impact of a positive risk. It focuses on optimizing conditions to make the opportunity more likely to occur and to maximize its benefits.
Example: If a project team identifies a new technology that could improve efficiency, they might allocate additional resources to explore and implement that technology more thoroughly, thereby enhancing its impact on the project.
Exploitation
Description: Exploitation aims to ensure that a positive risk is realized by eliminating any uncertainty associated with it. This strategy is often used when the opportunity is significant, and the project team wants to guarantee that it is achieved.
Example: If a project discovers a new market for its product, the team might allocate a dedicated budget and resources to immediately pursue this opportunity, ensuring they capitalize on it before competitors do.
Sharing
Description: This strategy involves partnering with other organizations or stakeholders to share the benefits of a positive risk. This can enhance the potential upside while distributing the risk among multiple parties.
Example: A company might collaborate with a technology firm to co-develop a product that leverages innovative features, sharing both the risks and the potential rewards of the new market opportunity.
Acceptance
Description: Acceptance of a positive risk means recognizing the opportunity but not taking specific action to pursue it. This may occur when the opportunity is deemed too small or when resources are better allocated elsewhere. The project team remains open to the possibility if it arises.
Example: A project manager might accept a potential opportunity for a cost-saving innovation that could arise during project execution without actively pursuing it, remaining open to leveraging it if it presents itself naturally.
In a project schedule (time), what are milestones? Describe with examples.
Milestones in a project schedule are significant points or events that mark the completion of key phases or deliverables within a project. They serve as checkpoints that help track progress and assess whether the project is on schedule. Milestones are typically non-duration activities and are often represented as diamond shapes on project management charts, such as Gantt charts.
Project Kickoff
Description: The formal start of the project, often marked by a kickoff meeting where stakeholders discuss objectives, roles, and responsibilities.
Example: A software development project marks the kickoff milestone on January 10, indicating that the project has officially begun.
Completion of Requirements Gathering
Description: This milestone signifies that all necessary project requirements have been gathered and documented, allowing the team to move forward with design and development.
Example: A construction project reaches this milestone on February 15 when all stakeholder requirements for the building are finalized and approved.
Phase Completion
Description: Milestones can mark the completion of major phases in a project, such as design, development, or testing.
Example: In a marketing campaign, reaching the "Campaign Design Complete" milestone on March 30 indicates that the creative materials have been finalized and are ready for production.
Final Deliverable Submission
Description: This milestone marks the submission of the final deliverable to the client or stakeholders, often a critical point for project completion.
Example: A consulting project reaches the "Final Report Delivered" milestone on April 20, indicating that all project findings and recommendations have been submitted to the client.
What is a network diagram? List and describe two (2) network diagramming methods
A network diagram is a visual representation of a project's tasks or activities and their dependencies. It illustrates the sequence in which tasks must be completed and helps project managers understand the flow of work, identify critical paths, and analyze project timelines.
Activity on Node (AON)
Description: In the AON method, each activity is represented by a node (usually a rectangle or circle), and the arrows connecting them represent the dependencies between activities. This approach allows for a clear visualization of task sequences and their interrelations.
Advantages:
Easier to understand and read, especially for complex projects.
Allows for the inclusion of milestones and multiple paths within the project.
Example: In a software development project, nodes may represent tasks like "Requirements Gathering," "Design," "Development," and "Testing," with arrows showing which tasks depend on others.
Activity on Arrow (AOA)
Description: In the AOA method, activities are represented by arrows, while the nodes indicate the start and end points of those activities. This method emphasizes the relationships between activities rather than the activities themselves.
Advantages:
Useful for highlighting the flow of tasks and their dependencies.
Can be beneficial for projects with a straightforward sequence of activities.
Example: In a construction project, arrows may represent tasks such as "Site Preparation," "Foundation," and "Framing," with nodes indicating the start and end points of each task.
List and describe the three (3) types of cost estimates. Provide an example for each type.
Rough Order of Magnitude (ROM) Estimate
Description: A Rough Order of Magnitude estimate provides a high-level approximation of the project costs based on limited information. It is typically used in the early stages of project planning and has a wide range of accuracy (usually -25% to +75%). This estimate helps stakeholders understand the potential budget before committing to detailed planning.
Example: At the initial concept stage of a new software development project, a project manager might provide a ROM estimate of $100,000 to $250,000 based on similar past projects and a general understanding of the required features.
2. Budget Estimate
Description: A Budget estimate is more refined than a ROM estimate and is used for project budgeting purposes. It is developed once project scope and requirements are better defined and typically has a narrower accuracy range (usually -10% to +25%). This estimate serves as a basis for the project budget and funding allocation.
Example: After defining the project scope for a marketing campaign, a project manager creates a budget estimate of $150,000, detailing costs for advertising, materials, and personnel, based on specific deliverables and timelines.
3. Definitive Estimate
Description: A Definitive estimate is the most accurate type of cost estimate, based on detailed analysis and comprehensive project information. It is usually prepared during the planning phase when the project scope is clearly defined, and its accuracy can range from -5% to +10%. This estimate provides a solid basis for project execution and is often used for cost control.
Example: Just before the start of a construction project, a project manager produces a definitive estimate of $1,200,000 after analyzing labor costs, material prices, and subcontractor bids in detail, providing a precise budget for the entire project.
What are tangible and intangible costs? How do they differ from direct costs and indirect costs?
Provide an example for each type of cost.
Tangible vs. Intangible Costs:
Tangible costs can be easily quantified (e.g., equipment, supplies), while intangible costs are more subjective and harder to measure (e.g., employee satisfaction, brand reputation).
Direct vs. Indirect Costs:
Direct costs can be specifically assigned to a project (e.g., salaries for project work), while indirect costs are shared across multiple projects and are not easily allocated (e.g., administrative expenses).