24.3 predator-prey relationships
1/3
There's no tags or description
Looks like no tags are added yet.
Name | Mastery | Learn | Test | Matching | Spaced | Call with Kai |
|---|
No analytics yet
Send a link to your students to track their progress
4 Terms
predators adaptations
sudden bursts of speed
stealth
fast reactions
prey adaptations
camouflage
mimicry
defence mechanisms such as spines
predator relationship graph
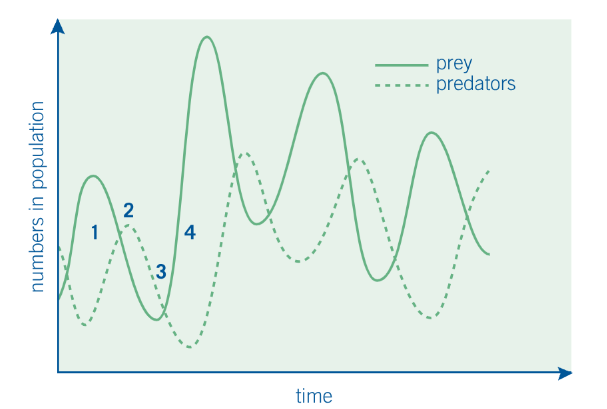
stages of predator prey relationships
stage 1 - an increase in the prey population provides more food for the predators, allowing more to survive and reproduce. This is turn results in an increase in the predator population
stage 2 - the increased predator population eats more prey organisms, causing a decline in the prey population. The death rate of the prey population is greater than its birth rate
stage 3 - the reduced prey population can no longer support the larger predator population. Intraspecific competition for food increases, resulting in a decrease in the size of the predator population
stage 4 - reduced predator numbers result in less of the prey population being killed. More prey organism survive and reproduce, increasing the prey population - the cycle begins again
(rarely in the wild is it as simple as this. It is also dependand on biotic factors and abiotic factors