Module 9 Chi-squared test
1/57
There's no tags or description
Looks like no tags are added yet.
Name | Mastery | Learn | Test | Matching | Spaced | Call with Kai |
|---|
No analytics yet
Send a link to your students to track their progress
58 Terms
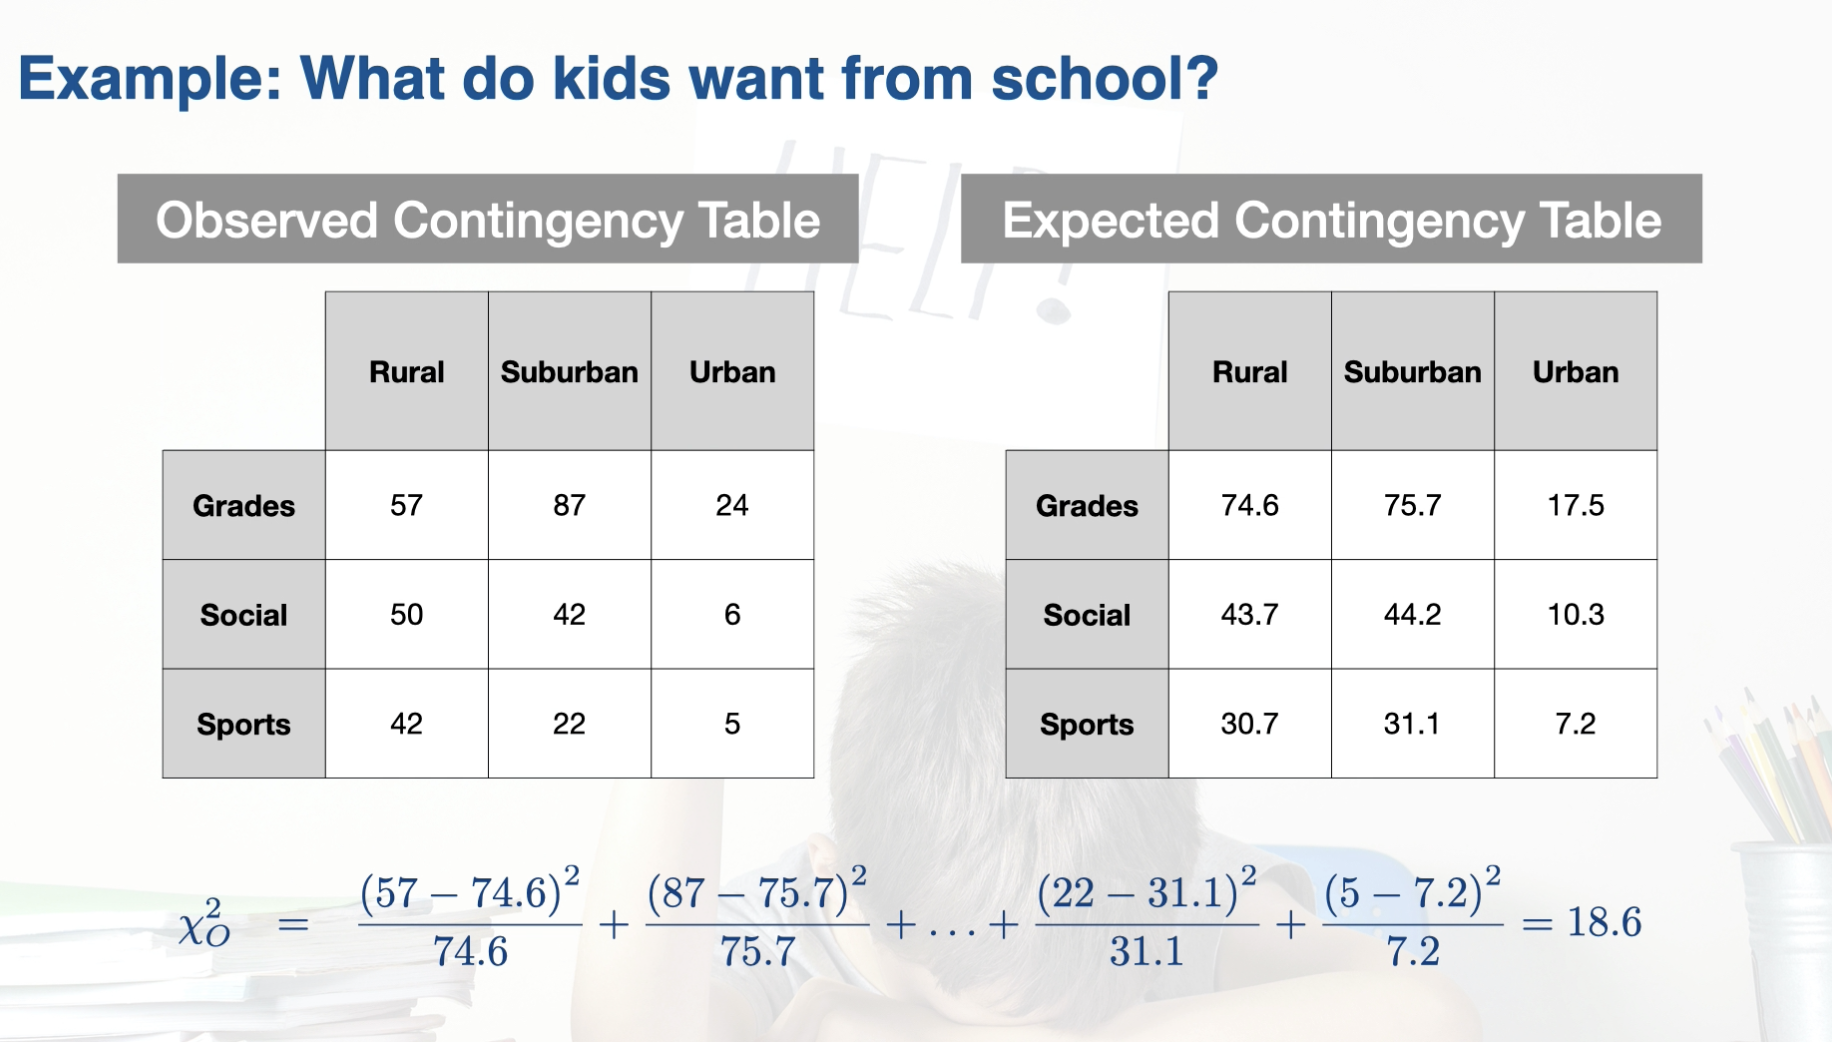
Expected contingency tables:
is the contingency table of expected frequencies under the null hypothesis.
how do we do a hypothesis test for catorgorical data?
compare observed contengency table to expected contengency table
what data do contengency data order
catorical data
if you have 1 way contingency table how many catorgical varibles do you have?
1
if you have 2 way contingency table how many catorgical varibles do you have?
2
how do you figure out the 1 way expected table? by questioning what?
question asking if there is a difference in the counts amoung the levels of that varible.
Ex “is there a difference in the occurrence of allergies?”
Ho: there is no difference in the type of allergy
HA: there is a differenec in the type of allergy
how do you make a n expected table of 1 way
each level has equal counts for the expected table
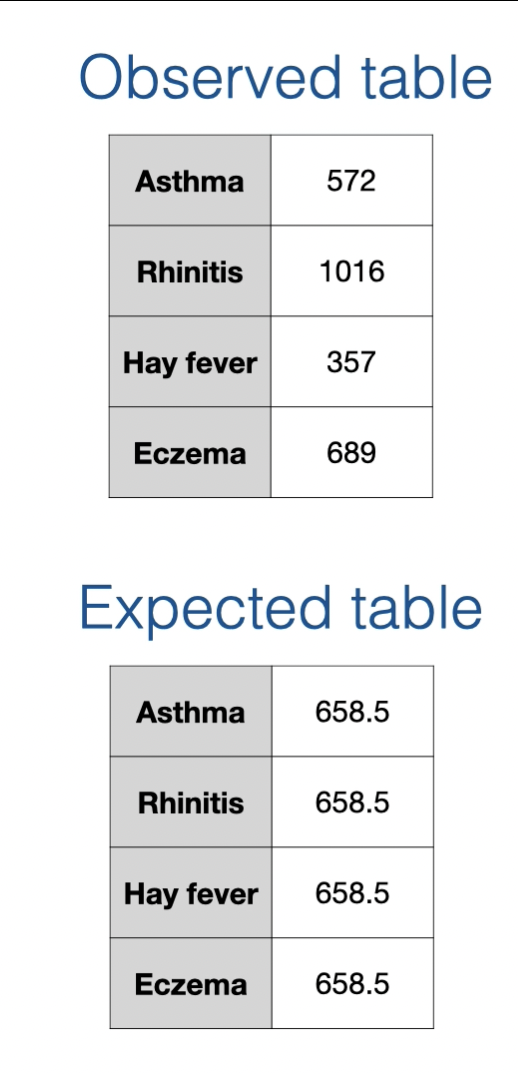
what are some things to keep in mind of 1 way expected tables?
What is the reassher question for 2 way expected tables?
asks whether the ocunts are independent between the varibles
T or F independent counts are the same as equal counts.
F
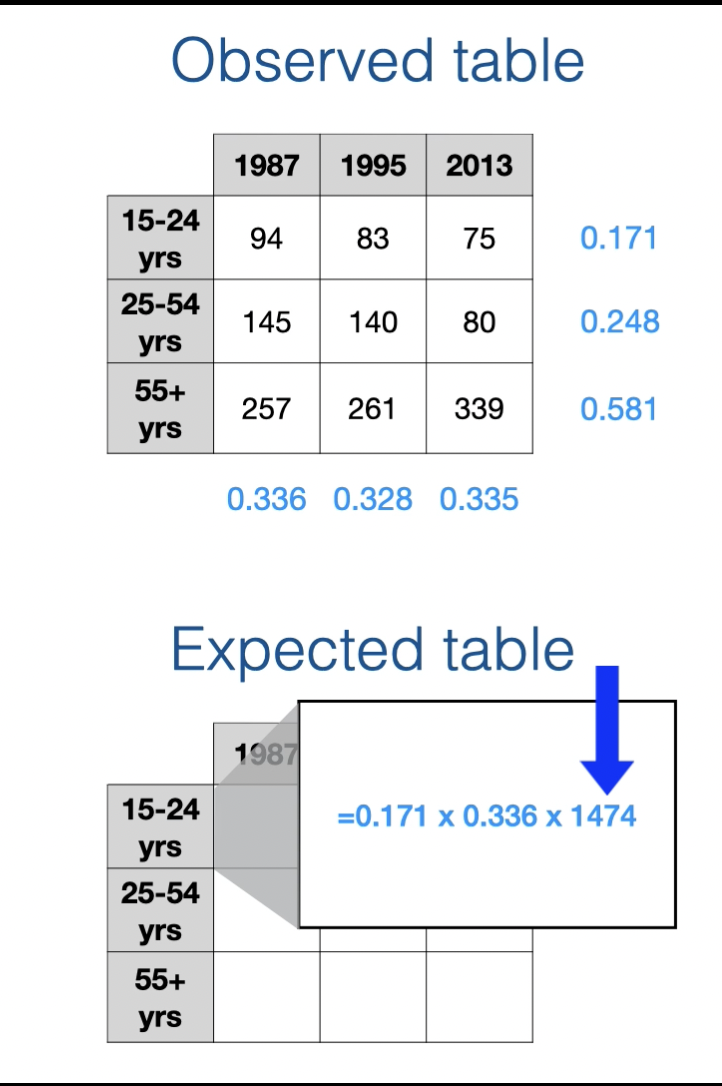
If the question is “Is age independent of year?”
null and alternative hypothesis are
HO: worker age and calendar are independent
HA: Worker age and calendar year are not independent
what is the expected table
2 way: counts are expected to be distributed independently among cells
Marginal distribution is
the coloum or row sum divided by table total
how do you calculate independence?
calculating Marginal distribution as propations (decimals)
how do you calcaulate the expected 2 way table
colum marginal distrabution x row marginal distrabution x table total
Equally: In the context of expected contingency tables, equality rerefers to
to all cells in the table having the same expected frequency.
Interaction:
In the context of expected contingency tables, an interaction refers to the cells in the table not having equal relative proportions across the levels of each variable.
If there is no interaction between the variables, then the variables are considered
independent of each other
Which of the following is an example of the null hypothesis for a 1-way contingency table?
There is no difference in the number of people choosing different political affiliations.
There is no dependency between age group and diet type.
The car body style is independent of whether or not the vehicle is electric.
Stress levels do not depend on hours of sleep.
There is no difference in the number of people choosing different political affiliations.
Calculate the expected table for the following contingency table. What is the expected frequency for the category "Asthma"?
Observed contingency table | |
Asthma | 45 |
Rhinitis | 58 |
Hay fever | 91 |
Eczema | 10 |
45
51
90.5
204
51
Calculate the expected table for the following contingency table. What is the expected frequency for the cell "Asthma", "Wood heating"?
Observed contingency table | Wood heating | Other heating |
Asthma | 12 | 5 |
Rhinitis | 85 | 54 |
Wheezing | 14 | 8 |
Eczema | 10 | 15 |
None | 210 | 313 |
5.00
7.75
9.25
238.45
726
7.75
What is the purpose of the expected contingency table?
It is the raw data collected by the researcher
It represents the alternative hypothesis
It provides a reference to compare the observed data against
It is a descriptive statistic that is not used for inference
It is the sampling distribution for categorical data
It provides a reference to compare the observed data against (correct)
Hypothesis testing for categorical data compares the observed contingency table against the ——- ——-, which is the contingency table based on the — ——.
expected contingency table
null hypothesis
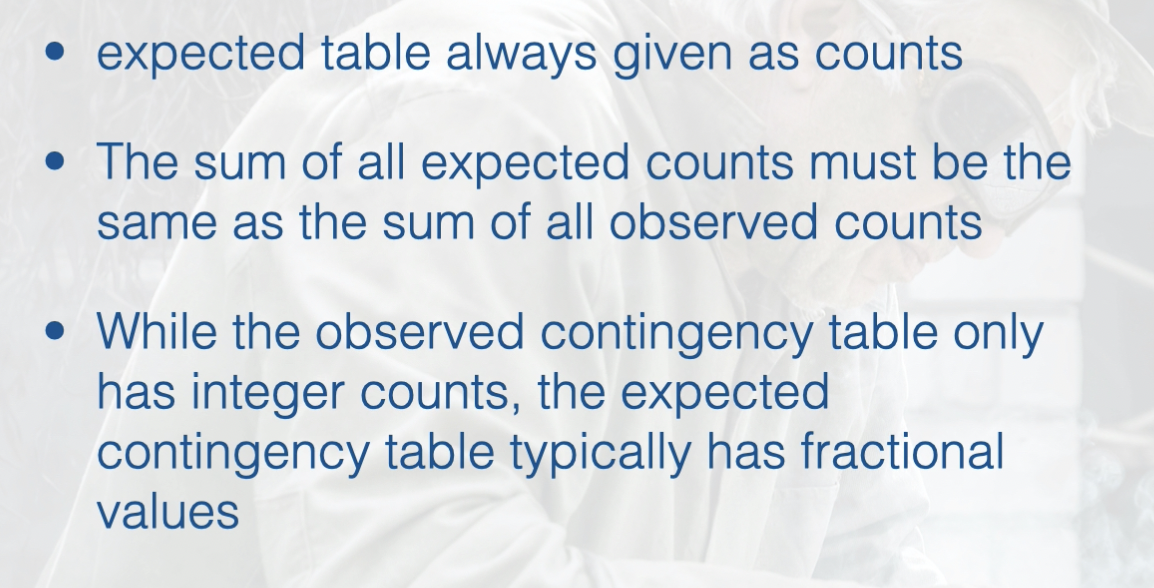
The expected contingency table is in the form of ——, and the total number of counts in the expected table is the ——- as the observed table.
counts
same
For 1-way contingency tables, the null hypothesis is that the counts are distributed ——— among the cells.
equally
For 2-way contingency tables, the null hypothesis is that the counts are distributed ——- among the cells.
independently
how do you measure a distance between two tables?
chi squared score, it provides a scale to measure the distance between the observed and expected contingency table
what does the chi squared method do?
it provides a scale to measure the distance between the observed and expected contingency table
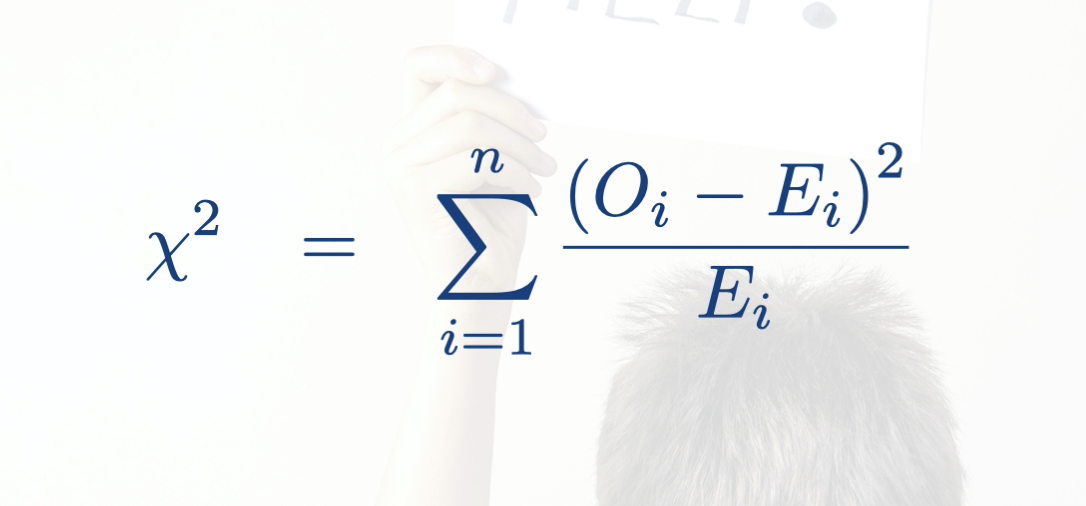
Chi-squared score:
is a measure of the distance between two contingency tables. If the contingency tables are an observed and expected table, then it measures the distance between sample data and the null hypothesis.
Chi-squared distribution:
is the distribution of chi-squared scores expected from repeatedly sampling a statistical population where the null hypothesis was true. It is the null distribution for hypothesis testing with categorical data.
Chi score symbol
X²
what are the four steps to calculate the chi squared score?
calculate the dif between the obs and expec. cell (obs-expected)
square the dif (obs-expected)²
divide by expected value
(obs-expected)²/expected
sum over all cells in the table (x² = (obs-expected)²/expected + (obs-expected)²/expected + (obs-expected)²/expected …..)
T or F: you calc Chi squared score difereenlty for 1 and 2 way tables
F the same way
what is the chi-squared distribution?
it is the null distruibtion, where it is the distrbutin of chi-squared score you would get from an sampling an imagenary stat population where the null hypothesis is true
T or F the chi squared distrbution can be - or + values
F: only positive values because the chi-squared scores
for 1 way tables the chi-squared distribution the degree of freedom are what
df=k-1
k=#cells
for 2 way tables the chi-squared distribution the degree of freedom are what
df = (r-1)(c-1)
r = # rows
c= # colums
Which of the following statements are FALSE?
The null hypothesis for a categorical data is embedded in the calculation of the expected contingency table.
The calculation of a chi-squared score is based on the information in your sample and the null hypothesis.
The calculation of a chi-squared score is different for a 1-way versus 2-way contingency table.
The chi-squared distribution is the null distribution for categorical data.
The chi-squared score is related to the alternative distribution
The calculation of a chi-squared score is different for a 1-way versus 2-way contingency table.
The shape of the chi-squared distribution depends on the ——— ——-, which is determined by the size.
degrees of freedom
table
Hypothesis tests for categorical data are called
Chi-squared tests:
what are the 4 steps of the chi-squared test
determine HO and HA ( 1 way (equality) or 2 way (INDP)
establish null distribution (calc X²)
conduct the statistical test
draw conclusion
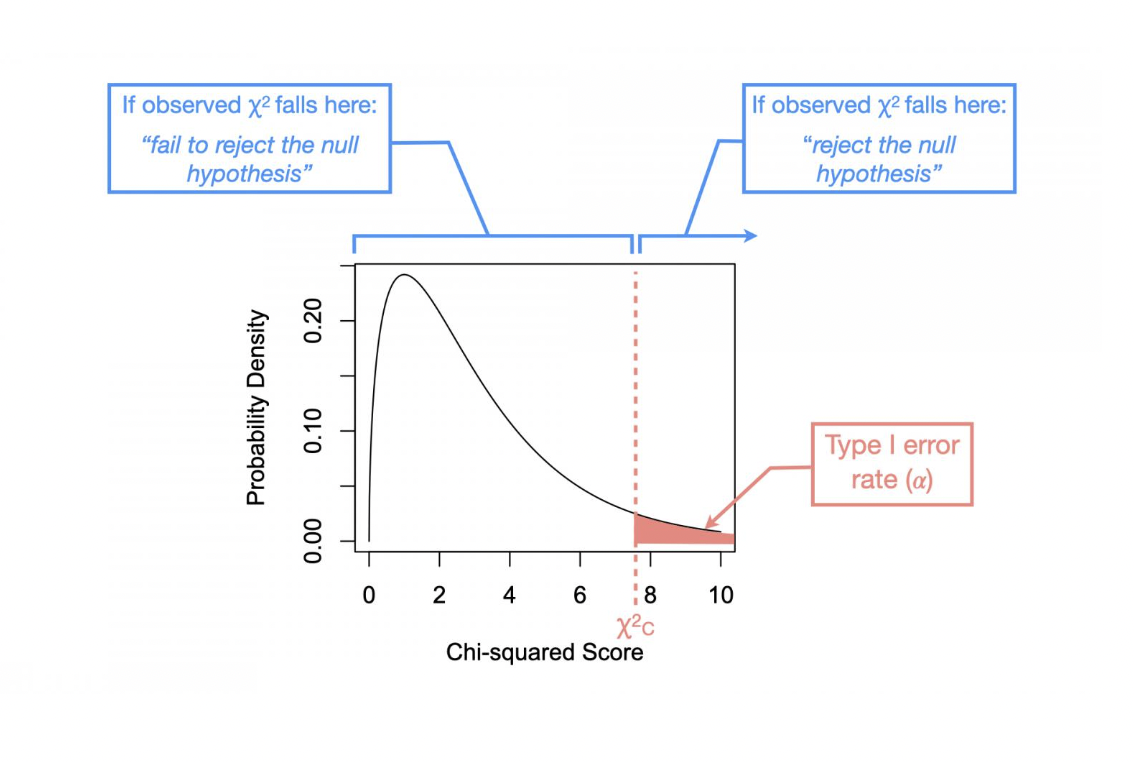
what side of the null distrubition is the type 1 error rate?
right hand side
what is used to find the chi-squared critical value
the type 1 errror rate
What value do we use doing a chi-squared test to see if we reject or fail to reject HO
chi squared critical value
T or F: we can use p-value compared to the alpha value or chi squared scores to see if we reject or fail to reject HO
T
T or F scientific conclusion for 1 and 2 way tables difer
T
four steps of chi square test
Define the null and alternative hypotheses
Establish the null distribution
Conduct the statistical test
Draw scientific conclusions
The statistical decision is made as follows:
Reject the null hypothesis if the observed score….
Fail to reject the null hypothesis if the observed score is….
Reject the null hypothesis if the observed score is greater than the critical score (i.e., ꭓ2O>ꭓ2C) or if the p-value is smaller than the Type I error rate (i.e., p<⍺).
Fail to reject the null hypothesis if the observed score is less than or equal to the critical score (i.e., ꭓ2O≤ꭓ2C) or if the p-value is larger or equal to the Type I error rate (i.e., p≥⍺).
For 1-way tables, the conclusions are either:
Reject the null hypothesis and conclude that there is evidence to support that the counts are not equal among cells.
Fail to reject the null hypothesis and conclude that there is no evidence to support that the counts are not equal among cells.
For 2-way tables, the conclusions are either:
Reject the null hypothesis and conclude that there is evidence to support that the variables are not independent of each other.
Fail to reject the null hypothesis and conclude that there is no evidence to support that the variables are not independent of each other.
The reporting of a chi-square test should include the following:
Short name of the test (i.e., ꭓ2)
Degrees of freedom
Total count in the observed table
The observed chi-squared value (two decimal places)
p-value (three decimal places)
ꭓ2(df=3,N=40)=3.9; p=0.270
Researchers were interested in studying whether bystanders are more likely to help others depending on the kind of help that was needed. For this study, they interviewed random people in a local shopping mall. Each person was asked if they had seen someone needing help in the past year. If so, they were asked what kind of help the person needed and whether they stopped to help. The researchers are interested in whether the ‘type of help’ needed was independent of whether the bystander offered helped. The following table shows the data collected.
Which of the following statements is FALSE for this dataset?
OBSERVED | Dropped an object | Fell down | Looked ill | Other |
Helped | 10 | 1 | 2 | 1 |
Did not help | 2 | 6 | 3 | 1 |
We reject the null hypothesis because the observed score (χ2O) is greater than the critical score (χ2C).
The observed score is χ2O=9.0
The degrees of freedom for the null hypothesis are df=3.
We fail to reject the null hypothesis because the observed score (χ2O) is greater than the critical score (χ2C).
None of the above
We fail to reject the null hypothesis because the observed score (χ2O) is greater than the critical score (χ2C).
Conduct the appropriate hypothesis test for this contingency table.
Which of the following statements is FALSE for this dataset?
Asthma | 201 |
Rhinitis | 339 |
Hay fever | 90 |
Eczema | 212 |
We reject the null hypothesis because the observed score (χ2O) is greater than the critical score (χ2C).
The observed score is χ2O=137.1
The degrees of freedom for the null hypothesis are df=3
The expected cell frequency is 210.5
None of the above
The observed score is χ2O=137.1
There is increased awareness of diet choice when it comes to eating meat and dairy. You suspect that restaurants have more diet options now, but are curious if it is different between the type of restaurant (fast food versus family restaurant). You decide to test this by randomly selecting restaurants in Toronto that were not part of a franchise. You categorized them by their diet option and whether they were fast food or family restaurant. The table below shows the data.
Which of the following statements is FALSE for this dataset?
OBSERVED | No options | Vegetarian | Vegan |
Fast food | 8 | 1 | 12 |
Family restaurant | 11 | 9 | 3 |
We reject the null hypothesis because the observed score (χ2O) is greater than the critical score (χ2C).
The observed score is χ2O=12.2
The degrees of freedom for the null hypothesis are df=2.
We fail to reject the null hypothesis because the observed score (χ2O) is greater than the critical score (χ2C).
None of the above
We fail to reject the null hypothesis because the observed score (χ2O) is greater than the critical score (χ2C).
The following table shows the number of maple syrup producers across different categories of syrup production and soil types.
Which of the following statements is FALSE for this dataset?
Humic soils | Acidic soils | Sandy soils | Bog soils | |
<100L per ha | 8 | 12 | 5 | 4 |
100-200L per ha | 13 | 5 | 1 | 1 |
>200L per ha | 5 | 3 | 1 | 2 |
We fail to reject the null hypothesis because the observed score (χ2O) is less than the critical score (χ2C).
The observed score is χ2O=7.8
The degrees of freedom for the null hypothesis are df=6.
The expected cell frequency is based on independence between the variables
None of the above
None of the above
The null distribution for the hypothesis test is the….
chi-squared distribution.
T or F: Since the null distribution is based on the chi-squared score, it contains all the necessary information about the distance between the observed and expected table under the null hypothesis.
T