Chapter 44.3: Age-Structured Population Growth
1/13
There's no tags or description
Looks like no tags are added yet.
Name | Mastery | Learn | Test | Matching | Spaced |
|---|
No study sessions yet.
14 Terms
Age Structure
How many individuals are in each age group
Aids ecologist in predicting if a population will grow or shrink in the future → Some ages reproduce more or less
Eg, tons of young adults = large growth or tons of youth = large growth in the future
Measurement of Age Structures:
Divide the population into age classes
Age determination methods:
Direct anatomical markers: Where there is a known method for checking the age precisely
Size Proxies: where size correlates with its age
Visual Cues of populations
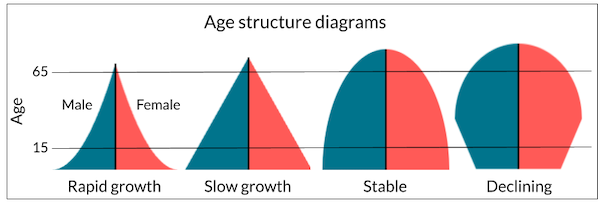
Visual cues in age strcutures
Growing populations: Pyramid shape graph → more young than old
Stable population: Even shape → equal in all age groups
This can be skewed with external factors
Eg, fishing → takes older fish leaving only the young that cant survive
Demography
Study of the size, structure and distribution of a population over time
Life Tables
tracks how many individuals survive at each stage of life
Cohort: all individuals born at the same time
Survivorship: proportion of that cohort still alive at each stage
Reproductive patterns and environmental predictability
R-Strategists:
K-Strategists:
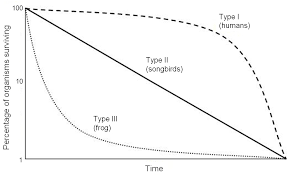
Survivorship Curves
uses information from life tables to show how survival probability changes with age
Type I: Most survive early and then die later in life
High parental care; few offspring
Type II: Consistent death rate
Death equally likely at all ages
Type III: Many die young and a few make it to adulthood
Many offspring, little parental care
R-Strategists:
Traits: many offspring, little parental care, fast growth, early maturity
Environment: unpredictable or high juvenile mortality
Selection favors high intrinsic rates of increase (r ≈ r_max)
Survivorship type: Type III
Eg Fish
K-Strategists:
Traits: few offspring, large parental investment, slower development, longer lifespan
Environment: predictable with populations often near carrying capacity K
Survivorship type: Type I
Eg Humans
Trade-offs: Resource Allocation
Finite energy/resources must be allocated to…
Growth
Maintenance
Reproduction
When allocation increases in on function it reduces resources available for the others → hence the name trade-off
Flexible allocation
In galapagos lava lizards
Adjust the allocation of fat and protein for egg production based on rainfall and prey availability
Dry years → larger eggs and less amount of eggs with larger hatchlings
High predation → more and small eggs
No resources → No reproduction and focus on survival/growth
Life History
Typical pattern of resource investment across an organisms lifetime
Allocation patterns are evolved traits shaped by natural selection
Shows at what stages which function is prioritized
Phenotypic and Physiological Plasticity
The ability of a single genotype to produce different phenotypes (observable characteristics) and physiological states in response to different environmental conditions