CH 5 - Genetic Linkage and Mapping
1/26
There's no tags or description
Looks like no tags are added yet.
Name | Mastery | Learn | Test | Matching | Spaced | Call with Kai |
|---|
No analytics yet
Send a link to your students to track their progress
27 Terms
Syntenic genes
genes on the same chromosome
Alleles on these genes can cross over to produce recombinant chromosomes
They can be close that they can’t sort independently
They’re linked genes
Not all of them though
Genetic Linkage Map
Plots the positions of genes and their relative distances from each other on chromosomes
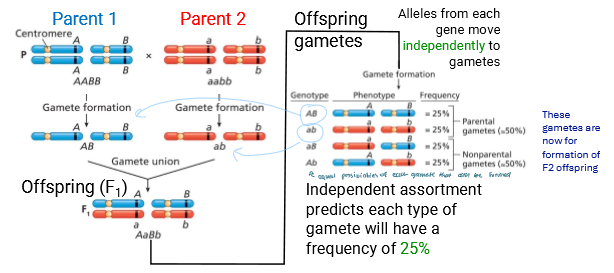
Unlinked genes assort independently
Alleles from each gene move independently to gametes
Each gamete has a frequency of 25% bc there’s 4
2 are the same as the parents (parental)
2 are non-parental (has recombined)
Has a RF = 50% (Recombination Frequency)
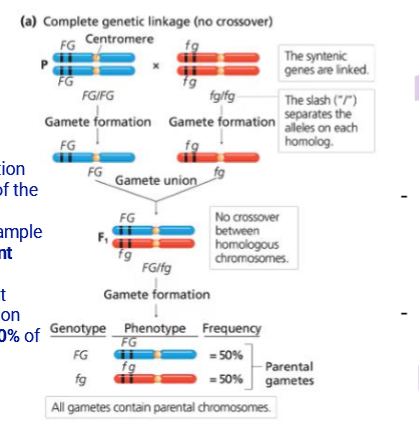
Complete Genetic Linkage
Genes are located so close they’re never separated by crossing over
The offspring thus only display the parental traits
This is rare in nature but can be seen in male drosophila where crossing over doesn’t occur
These genes are thus in linkage disequilibrium
Has a RF = 0% (Recombination Frequency)
Incompletely Linked Genes
Come recombination occurs
However there’s more of an abundance of non-recombined (parental) gametes
Linkage Disequilibrium
It’s less likely for them to be separated, so it’s like parental genes
Has a RF = < 50% (Recombination Frequency)
How do you detect linkage?
Quantify how alleles are associated in gametes/offspring
Compare this to expectations based on independent assortment of alleles at each gene
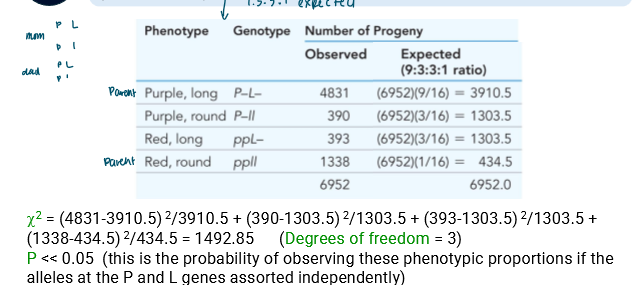
So perform chi-squared test (expected is 9:3:3:1)
You’ll see p « 0.05 meaning there’s a significant difference
So there’s another system at play than 9:3:3:1
The ratios then suggest linkage and not independent assortment
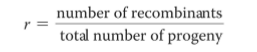
Recombination Frequency ( r )
r = # recombs / total # progeny
It’s (+) correlated with physical distance between genes on a chromosome
Longer distance means more recombination
When r is small, the closer the genes are
Two-Point Test-Cross Analysis
Two-Point: 2 genes
Test-Cross: Hetero x homo rec
Determines whether two genes are linked
Estimate the distance between them on a chromosome.
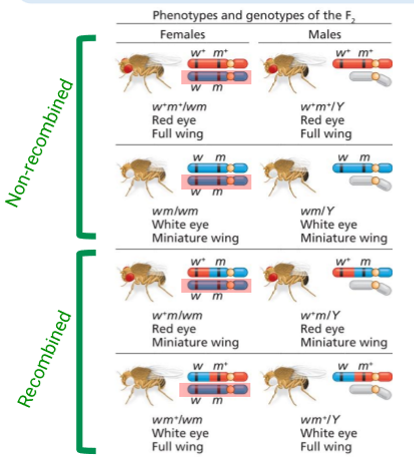
Two-Point Test-Cross Analysis: Drosophila Example
Examines recombination between 2 genes in the female during oogenesis
w (eye colour), m (wing size)
In fruit flies, recombination doesn’t occur in spermatogenesis
Parents: w+m+/wm (red eye large wing mom) and w+m+/Y (white eye small wing dad)
So the progeny has geno/phenotypes as depicted by the diagram
Unrecombined
Females: w+m+/wm OR wm/wm
Males: w+m+/Y OR wm/Y
Recombined
Females: w+m/wm OR w+m/Y
Males: wm+/wm OR wm+/Y
Dad’s one X chromosome contribution never recombines, as shown in one of the daughter’s X
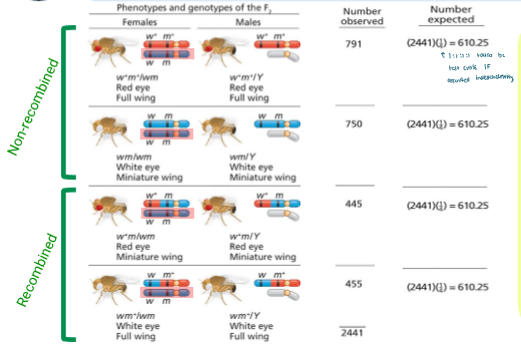
Two-Point Test-Cross Analysis: Drosophila Chi-Squared Linkage Analysis
Under independent assortment, you’d expect 1:1:1:1 ratio
So for expected value, you use ¼ to find it
df = 3 and P < 0.005
So the null hypothesis that the genes assort independently is rejected
So they must be linked
How do you quantify genetic linkage?
Find the rates for each trait in comparison to another until you’ve compared them all
Find the recombination rates for each trait in comparison to the other
Lower r = closer together
Find the closest ones and start there
1% recombination = 1 map unit = 1 cM (centiMorgan)
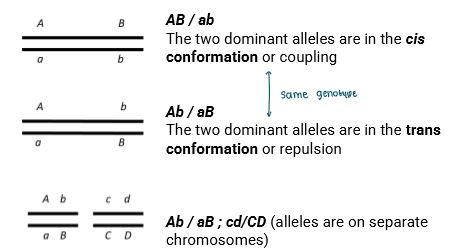
Notation for Linked Genes
AB/ab
The two dominaint alleles are in the cis conformation
Coupling
Ab/aB
The two dominant alleles are in the trans conformation
repulsion
Ab/aB ; cd/CD
Alleles are on seperate chromosomes
Three-Point Test-Cross
Parent 1 is trihybrid, Parent 2 is homo rec for all loci
The rarest progeny phenotypes result from double crossovers
Only the middle is different
It’s rare bc event one AND event 2 has to happen
If RF between allele 1 and 2 is 0.18
And RF between allele 2 and 3 is 0.12
then the probability is (0.18)(0.12) = 0.02
This means out of 1000, only 20 display it
10 for each reciprocal phenotype
Recombination Interference
In trihybrid crosses, the # of observed double crossovers is less than expected
This is caused by recombination interference (I)
Higher values of I indicate more interference
Interference Calculation
I = 1 - Coefficient of coincidence
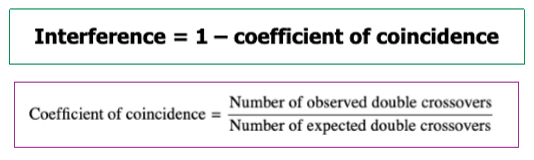
Coefficient of Coincidence Calculation
Coefficient = # of observed double crossovers / # of expected double crossovers

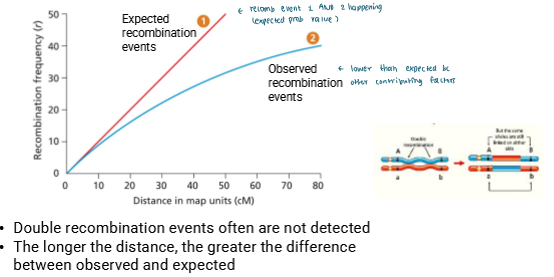
Why is the map distance based off observed recombination events less than the actual distance?
Double recombination events are often not detected
Only middle changes
If you look at 2 traits on the edges of the replaced portion, it’ll look the same
So you don’t see it and don’t count it with observed recombination events
Longer the distance, the greater the difference between observed and expected
more distance means more opportunity for multiple crossovers
Each of those hide a recombination event bc it looks like parental phenotype
So observed recombination frequency is less than expected bc you don’t count it
Heterogenous Recombination Landscape
Recombination hotspot: Genomic regions where recombination happens more frequently
Recombination coldspot: Genomic regions without frequent recombination events
It can be influenced by env factors
age, temp, diet
Recombination rate may differ between sexes
More during oogenesis than spermatogenesis
Recombination locations differ between sexes
More frequent on chromosome tips in males than females
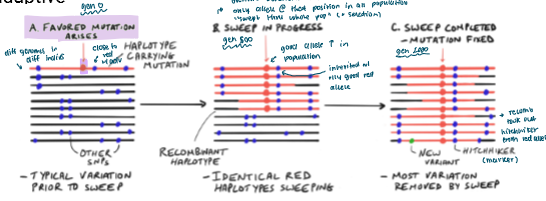
NS and Recombination
Natural selection may affect recombination
So higher recombination rates may be adaptive
A favoured mutant may arise in a population
It eventually sweeps throughout the population bc it’s good (through NS)
This mutation may be inherited with a gene it’s linked to
Recombination can seperate them if the linked “hitchhiker” is bad
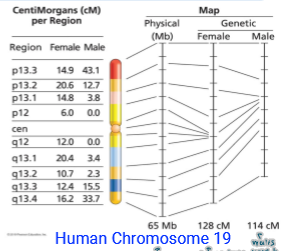
Sex and Recombination
Genome-wide recombination rate is lower in males
So males have a smaller genetic map BUT the physical maps are the same
Physical map: measured actual # of bp for precise DNA length (exact distance)
Genetic map: measures relative distance based on frequency of crossing over (relative distance)
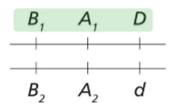
Allelic Phase
Refers to which alleles are physically attached to eachother on same chromosome
Disease-causing genes can be identified by looking at these linked polymorphisms
Ex. disease allele D might be frequently associated with A1/B1
Sometimes it may not bc recombination, but it usually is
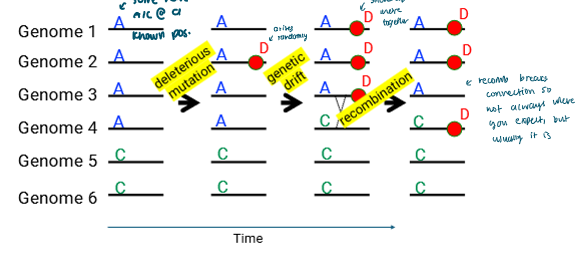
Genetic Linkage of Disease-Causing Allele
A deleterious mutation may arrive on an individual
It will be passed down through genetic drift
It’s close to allele A so we can tell it’s more likely to be near A than C
Recombination may change that fact so it’s not always associated with A
Mapping variants associated with a phenotype
A marker locus can be closely linked to a disease-causing allele
Specific alleles at that marker locus would be significantly associated with the disease allele throughout a population
GWAS can be used to locate these associations
GWAS
Genome-wide association study
It discovers associations between certain variations in our genetic code and a certain phenotype of interest
How is a GWAS performed?
You sequence the complete genomes of as many people as you can
Controls → health people
Cases → people all with the same disease
You test whether single nucleotide polymorphisms (SNP) tend to be significantly found with the disease
Each SNP is plotted, can be millions
The P-value (significance) is found
The slope (effect size of disease likelihood) is found
This is done computationally accounting for covariates (like age or sex)
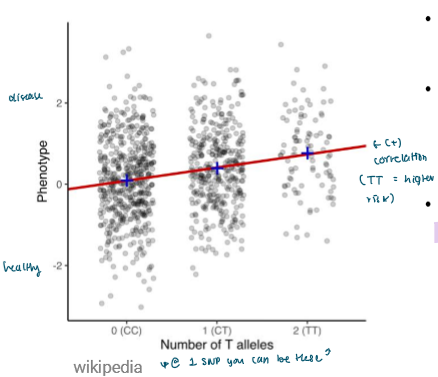
Axes:
x: the possible allele combinations at one SNP
y: the associated phenotype
Factors Affecting GWAS Results
Statistical power (sample size)
Bigger studies = more chance to accurately detect associations
Variation in biology
Some diseases can have big effects with 1-2 genes contributing
Other diseases have many genes with small effects adding up
Environmental Influence
Traits heavily influenced by the env, the weaker genetic signal
Low heritability means the env explains most of the variation
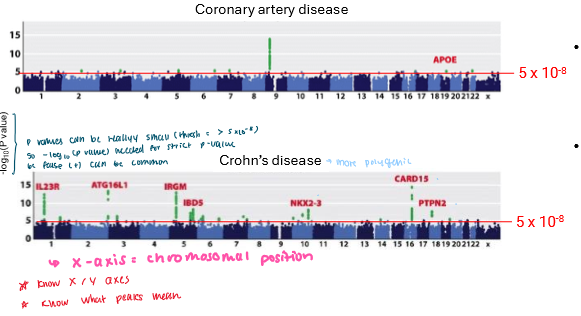
Manhattan Plot
A graph used in GWAS to show which genetic variants (usually SNPs) are associated with a trait.
x-axis: Chromosomal Position
y-axis: -log(P-value)
strength of association
The P value must bc reallyyyy small for it to be significant bc there’s a high chance of false (+)
So these values are easier to work with on a log scale
The green peaks indicates stronger statistical evidence that this SNP is associated with the trait
Can involve one (coronery artery disease)
Can be polygenic (Crohn’s disease)