Real-life Graphs
Distance-Time graphs
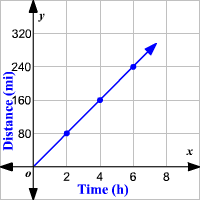
- A distance-time graph shows how distance changes with time
- The shape of the graph gives you information about what’s happening
Rates of change
- The gradient on a distance-time graphs tells you the rate of change of distance with time
- This is also called speed
- You can use graphs to find other rates of change
- The graphs show how something happens with time
- It would show multiple options and their rates with a graph and you usually have to find the graph that fits the question \n