Understanding Supply and Demand Dynamics
1/48
There's no tags or description
Looks like no tags are added yet.
Name | Mastery | Learn | Test | Matching | Spaced |
|---|
No study sessions yet.
49 Terms
Demand
Willingness and ability to purchase goods/services.
Law of Demand
Price increase leads to lower quantity demanded.
Quantity Demanded
Specific units buyers will purchase at price.
Demand in symbols
p(arrow up)Qd(arrow down) P(arrow down)Qd(arrow up) ceteris paribus
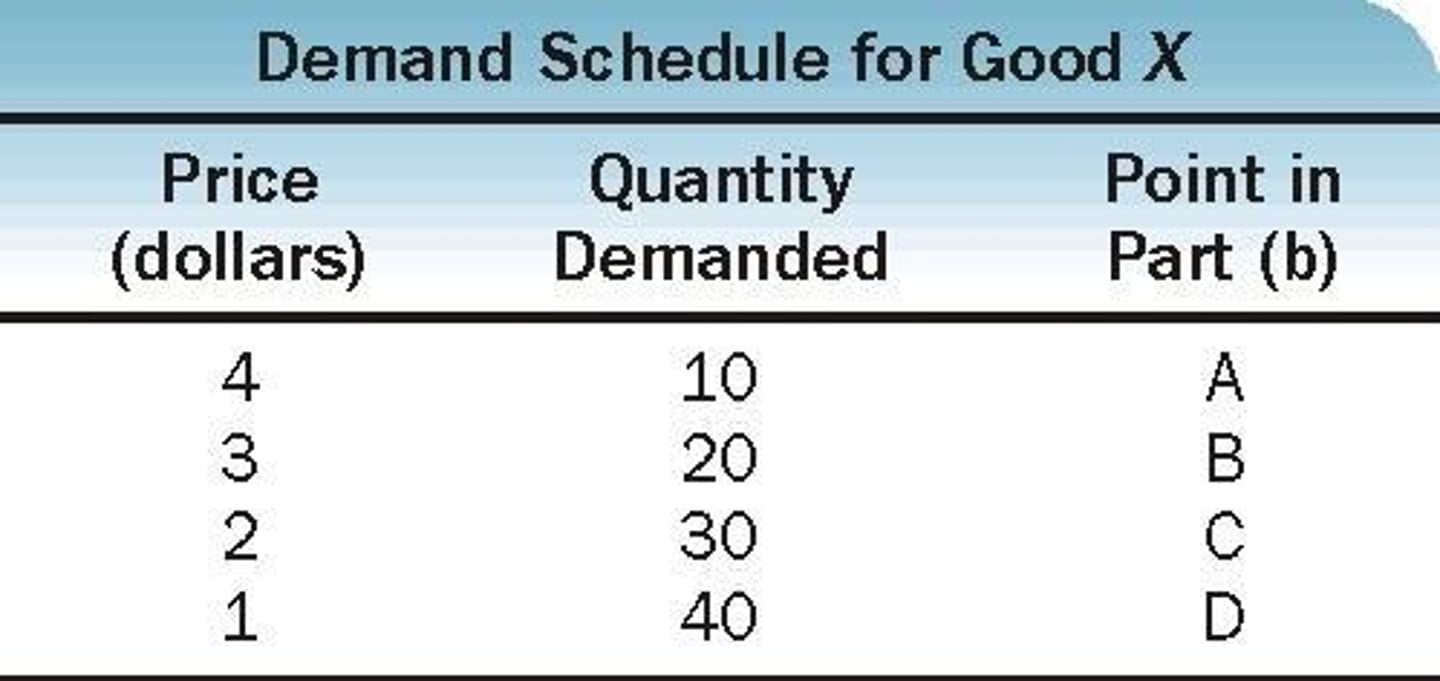
Demand Schedule
Numerical representation of the law of demand.
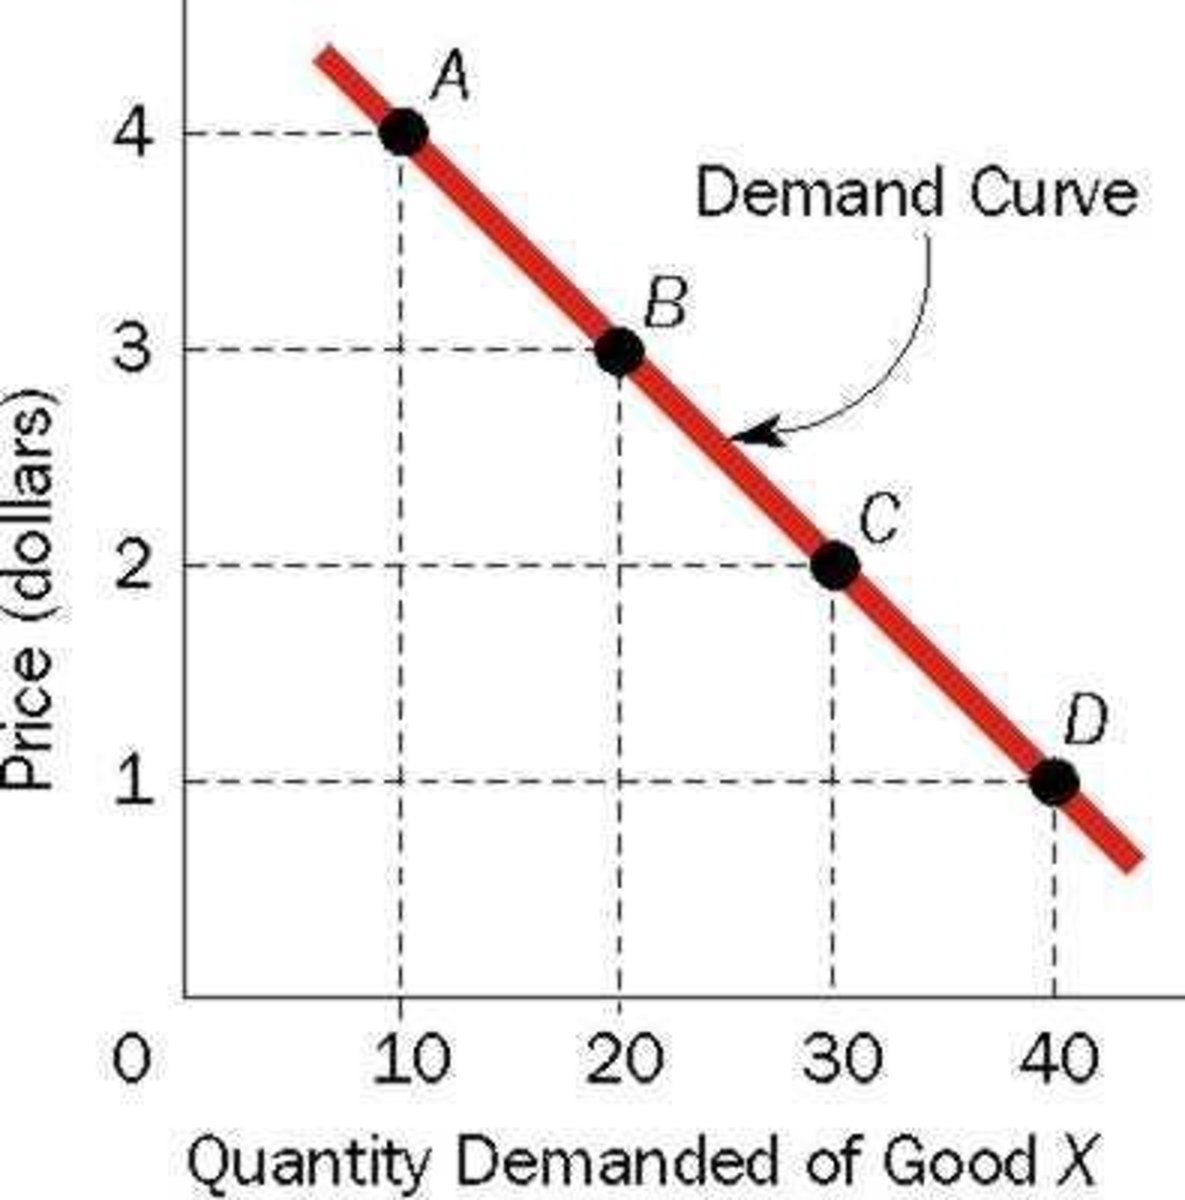
Demand Curve
Graphical representation of price-quantity relationship.
Law of Diminishing Marginal Utility
For a given time period, the marginal utility gained will decline as the amount consumed increases. Satisfaction decreases as consumption increases.
Individual Demand Curve
Price-quantity combinations for a single buyer.
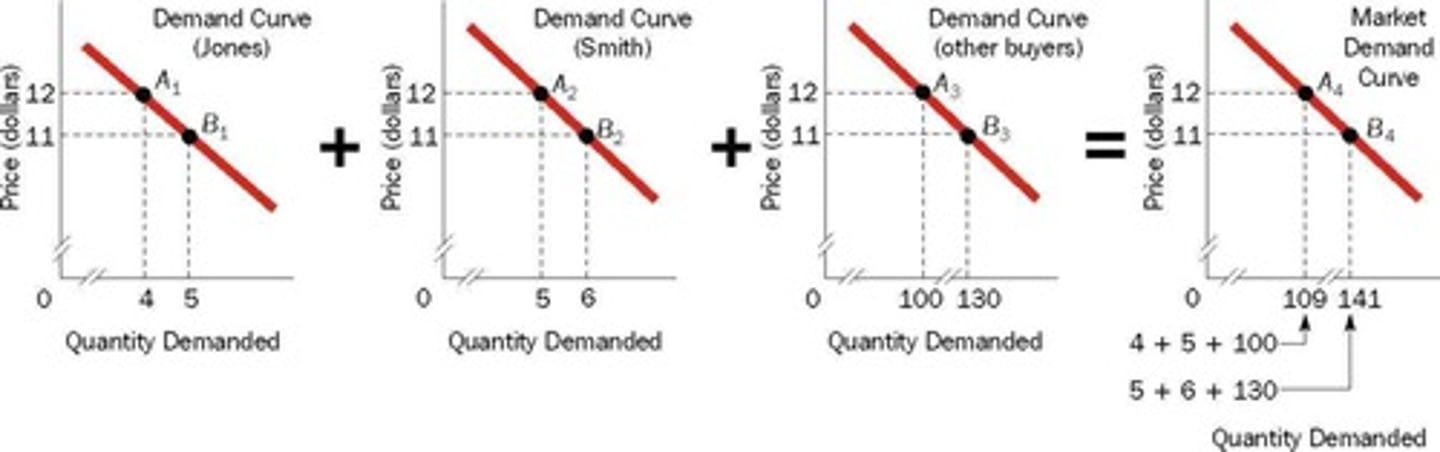
Market Demand Curve
Aggregate price-quantity combinations for all buyers.
Change in Quantity Demanded
Movement along the same demand curve due to price.
Change in Demand
Shift in demand curve at all price levels.
Increase in Demand
Rightward shift in the demand curve.
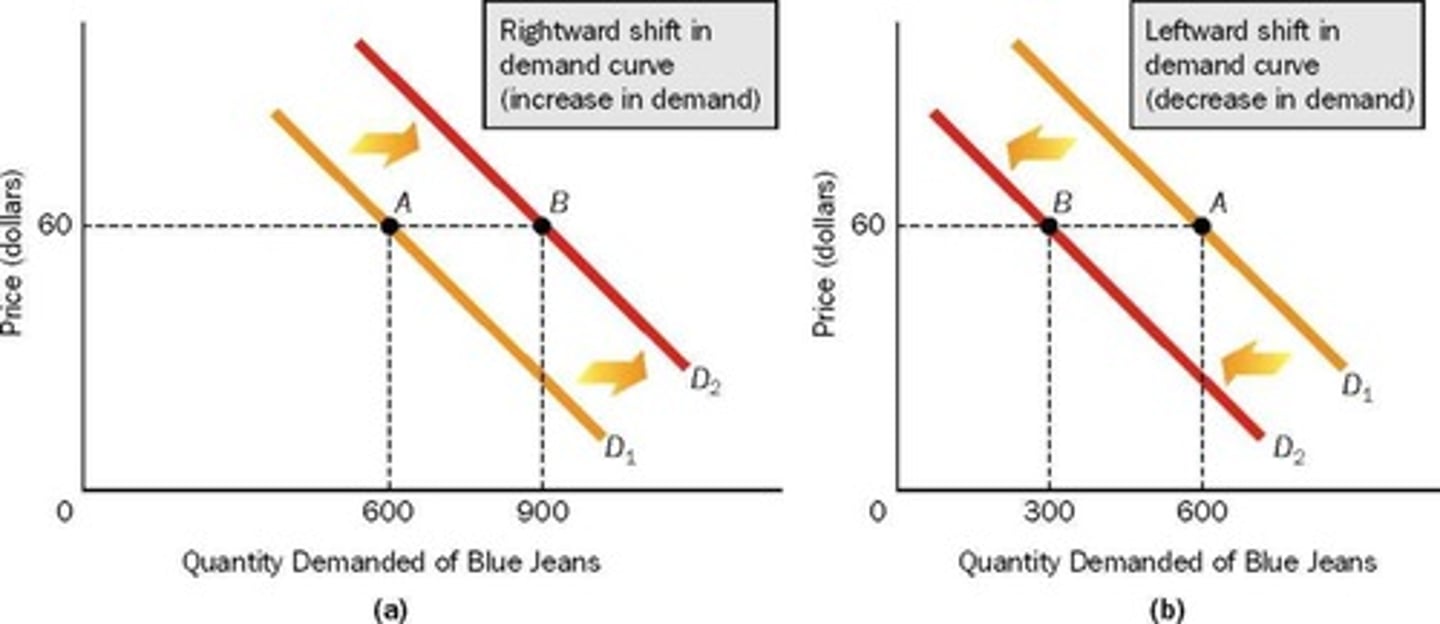
Decrease in Demand
Leftward shift in the demand curve.
Factors Shifting Demand
Income, preferences, related goods, buyers, expectations.
Market-Clearing Price
Price at which quantity supplied equals quantity demanded.
Normal Good
Demand rises as income increases.
Inferior Good
Demand falls as income increases.
Neutral Good
Demand remains unchanged with income changes.
Preferences
Consumer tastes affecting demand for goods.
Substitutes
Goods satisfying similar needs; demand rises together.
Complements
Goods consumed jointly; demand inversely related.
Number of Buyers
More buyers increase demand; fewer decrease demand.
Supply
Willingness to produce and sell goods at prices.
Law of Supply
Price increase leads to higher quantity supplied.
Quantity Supplied
Specific units sellers are willing to sell.
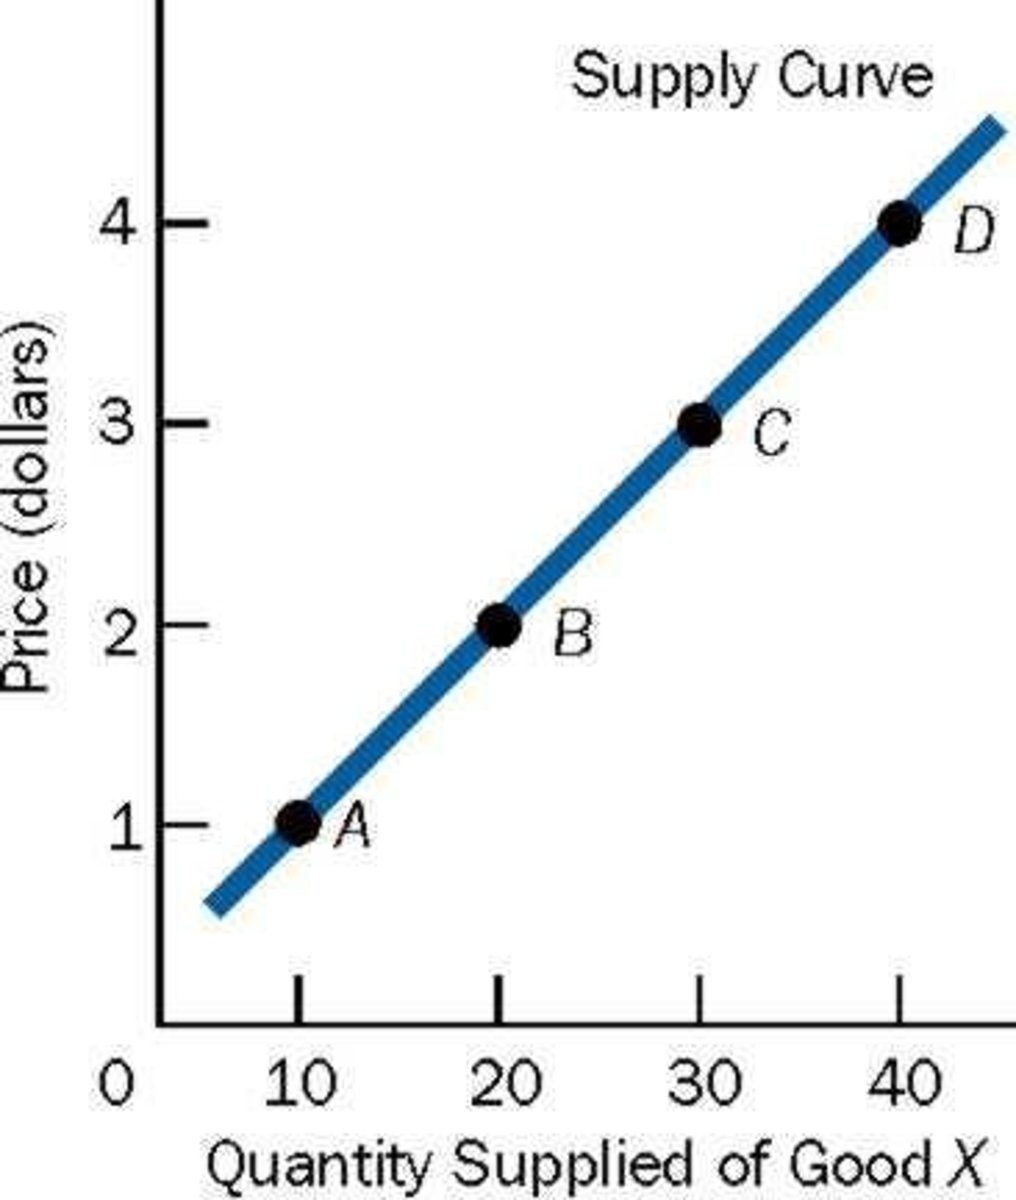
Supply Curve
Graph showing price-quantity relationships for sellers.
Law of Diminishing Marginal Returns
The specific number of units of a good that individuals are willing and able to sell at a particular price.
Individual Supply Curve
Price-quantity combinations for a single seller.
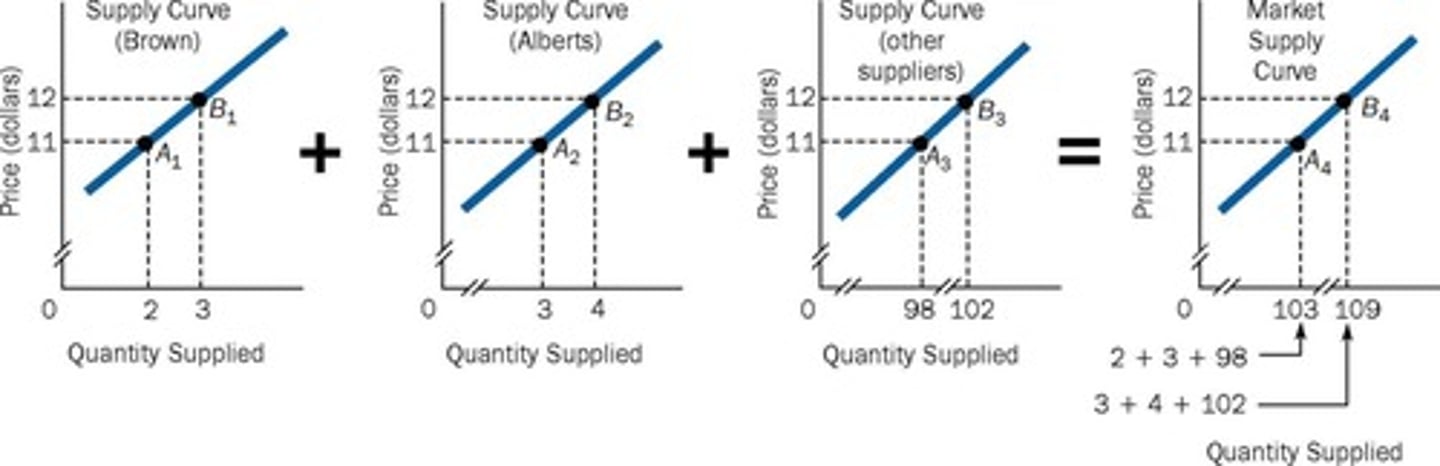
Market Supply Curve
Aggregate price-quantity combinations for all sellers.
Supply Schedule
Numerical representation of quantity supplied at prices.
Output Increase
More goods produced with same resources.
Prices of Relevant Resources
If the price of a resource falls, producing the good becomes less costly
Technology
is the body of skills and knowledge concerning the use of resources in production
Price of Other Goods
Change in one good's price affects another.
Number of Sellers
More sellers increase overall supply.
Future Price Expectations
Anticipated price changes affect current supply.
Taxes
Higher taxes increase per-unit production costs.
Subsidies
Government payments increase supply at each price.
Government Restrictions
Regulations limiting supply, like import quotas.
Surplus
Excess supply; quantity supplied exceeds demand.
Equilibrium Price
Point where supply equals demand.
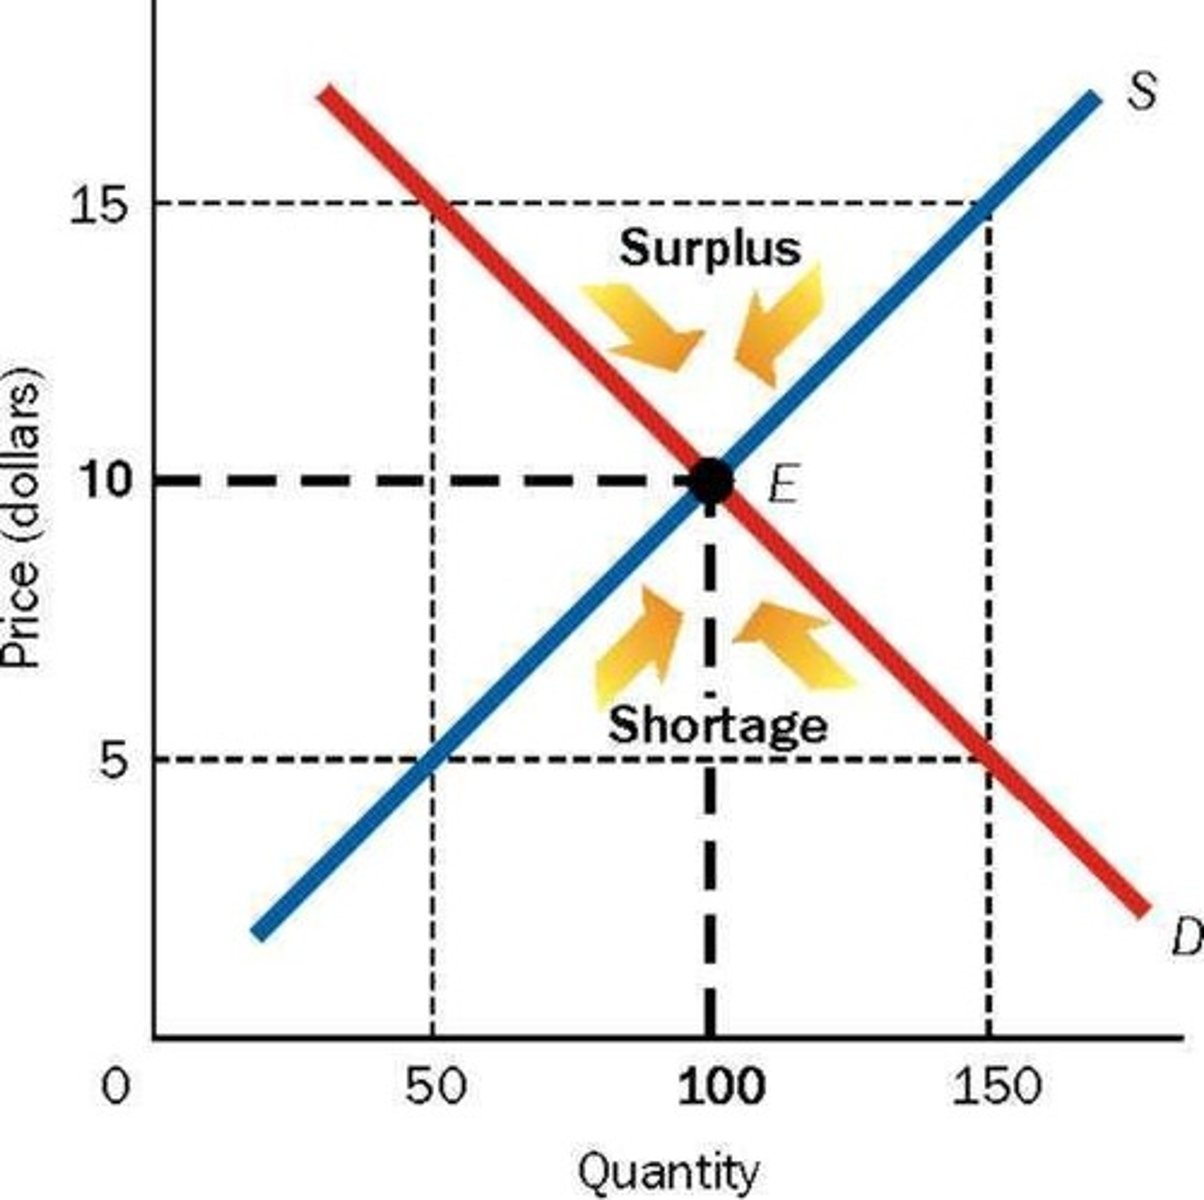
Shortage
Condition where quantity demanded exceeds quantity supplied.
Equilibrium Quantity
Quantity at which supply equals demand.
Disequilibrium Price
a price other than equilibrium price; a price at which the quantity demanded does not equal the quantity supplied
Disequilibrium
a state of either surplus or shortage in a market
Equilibrium
"at rest"; the price-quantity combination from which buyers or sellers do not tend to move away; the intersection point of the supply and demand curve (Qs = Qd )
Consumers' Surplus
is the difference between the maximum price a buyer is willing and able to pay for a good or service and the price actually paid for it
Producers Surplus
is the difference between the price sellers receive for a good and the minimum or lowest price for which they would have sold the good
Total Surplus
Consumers' Surplus + Producers' Surplus