Economics Key Concepts: Scarcity, GDP, Unemployment, Money, and AD/AS
1/101
There's no tags or description
Looks like no tags are added yet.
Name | Mastery | Learn | Test | Matching | Spaced |
|---|
No study sessions yet.
102 Terms
Scarcity
The basic economic problem that resources are limited while wants are unlimited, forcing societies to make choices about how to allocate resources.
Opportunity Cost
The value of the next best alternative that is given up when a choice is made.
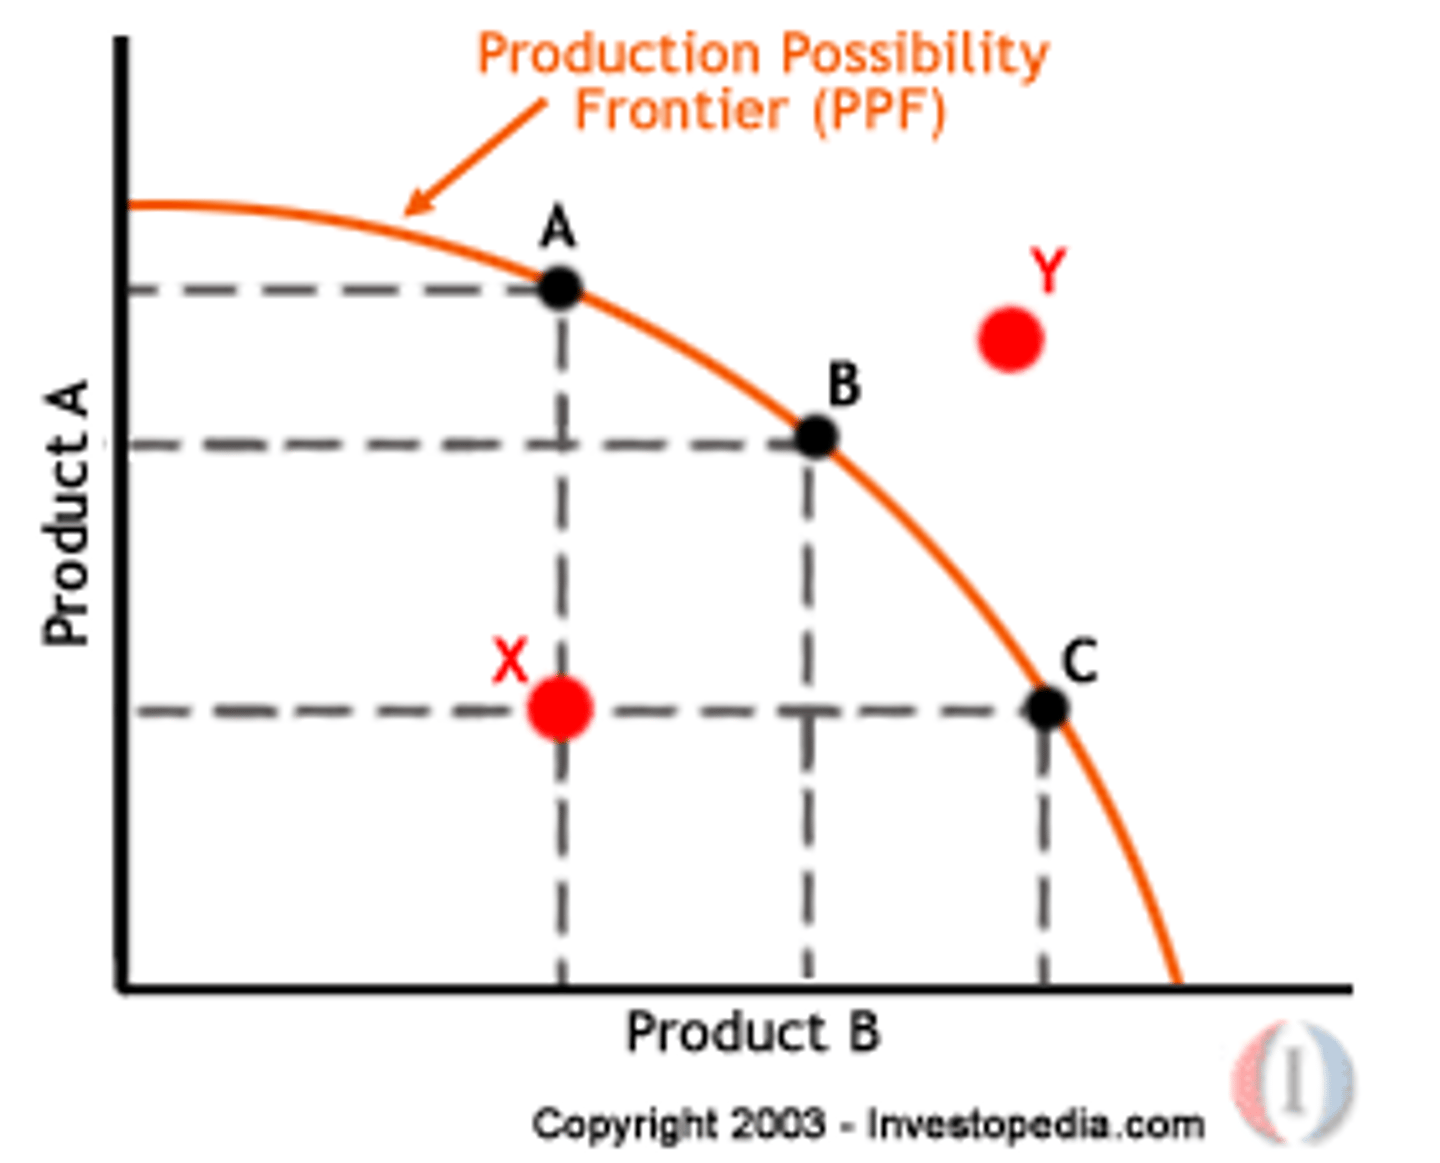
Production Possibilities Frontier (PPF)
A curve showing the maximum combinations of two goods an economy can produce with available resources and technology; illustrates scarcity, efficiency, and opportunity cost.
GDP (Gross Domestic Product)
The total market value of all final goods and services produced within a country in a given time period.
Nominal GDP
GDP measured using current prices; not adjusted for inflation.
Real GDP
GDP measured using constant prices; adjusted for inflation.
GDP Deflator
A price index that measures the level of prices of all new, domestically produced final goods and services in an economy.
CPI (Consumer Price Index)
A measure of the average change over time in the prices paid by consumers for a fixed basket of goods and services.
Inflation Rate
The percentage change in the overall price level over time, typically measured by CPI or GDP deflator.
Unemployment Rate
The percentage of the labor force that is unemployed and actively seeking work.
Frictional Unemployment
Unemployment that occurs when people are temporarily between jobs or entering the labor force.
Structural Unemployment
Unemployment caused by mismatches between workers' skills and job requirements.
Cyclical Unemployment
Unemployment caused by downturns in the business cycle.
Natural Rate of Unemployment
The normal rate of unemployment consisting of frictional + structural unemployment; exists even at full employment.
Labor Force Participation Rate
The percentage of the adult population that is either working or actively looking for work.
Economic Growth - Increases in real GDP or real GDP per capita over time.
Productivity
Output produced per worker; the main driver of long-run economic growth.
Physical Capital
Tools, machinery, and equipment used in production.
Human Capital
Skills, education, and experience possessed by workers.
Technological Progress
Improvements in knowledge and methods that increase productivity.
Saving
Income not spent; helps finance investment.
Investment
The purchase of capital goods that increase future productive capacity.
Loanable Funds Market - A market that shows how savers supply funds and borrowers demand funds; determines the real interest rate.
Supply of Loanable Funds - Comes from saving; upward slope shows that higher interest rates incentivize more saving.
Demand for Loanable Funds - Comes from investment; downward slope shows that lower interest rates make borrowing cheaper.
Crowding Out
When government borrowing increases interest rates and reduces private investment.
Budget Deficit
When government spending exceeds government revenue.
National Debt
The total accumulated deficits minus surpluses over time.
Money - Anything that serves as a medium of exchange
unit of account, and store of value.
M1 Money Supply
The most liquid forms of money (cash, checking deposits).
M2 Money Supply
M1 plus savings deposits, time deposits, and other near-monies.
Fractional-Reserve Banking
A system where banks keep only a fraction of deposits as reserves and loan out the rest.
Required Reserves
The minimum amount of deposits a bank must hold (set by the Fed).
Excess Reserves
Reserves banks hold beyond the required minimum; used to create loans.
Money Multiplier
The amount by which the money supply can increase based on new reserves; equal to 1 / reserve ratio.
Federal Reserve (Fed)
The central bank of the United States responsible for regulating money supply and financial stability.
Open Market Operations
The Fed's buying or selling of government bonds to change the money supply.
Discount Rate
The interest rate the Fed charges banks for short-term loans.
Reserve Requirement
The Fed-set minimum fraction of deposits banks must hold as reserves.
Interest on Reserves
The interest rate the Fed pays banks on reserves held at the Fed.
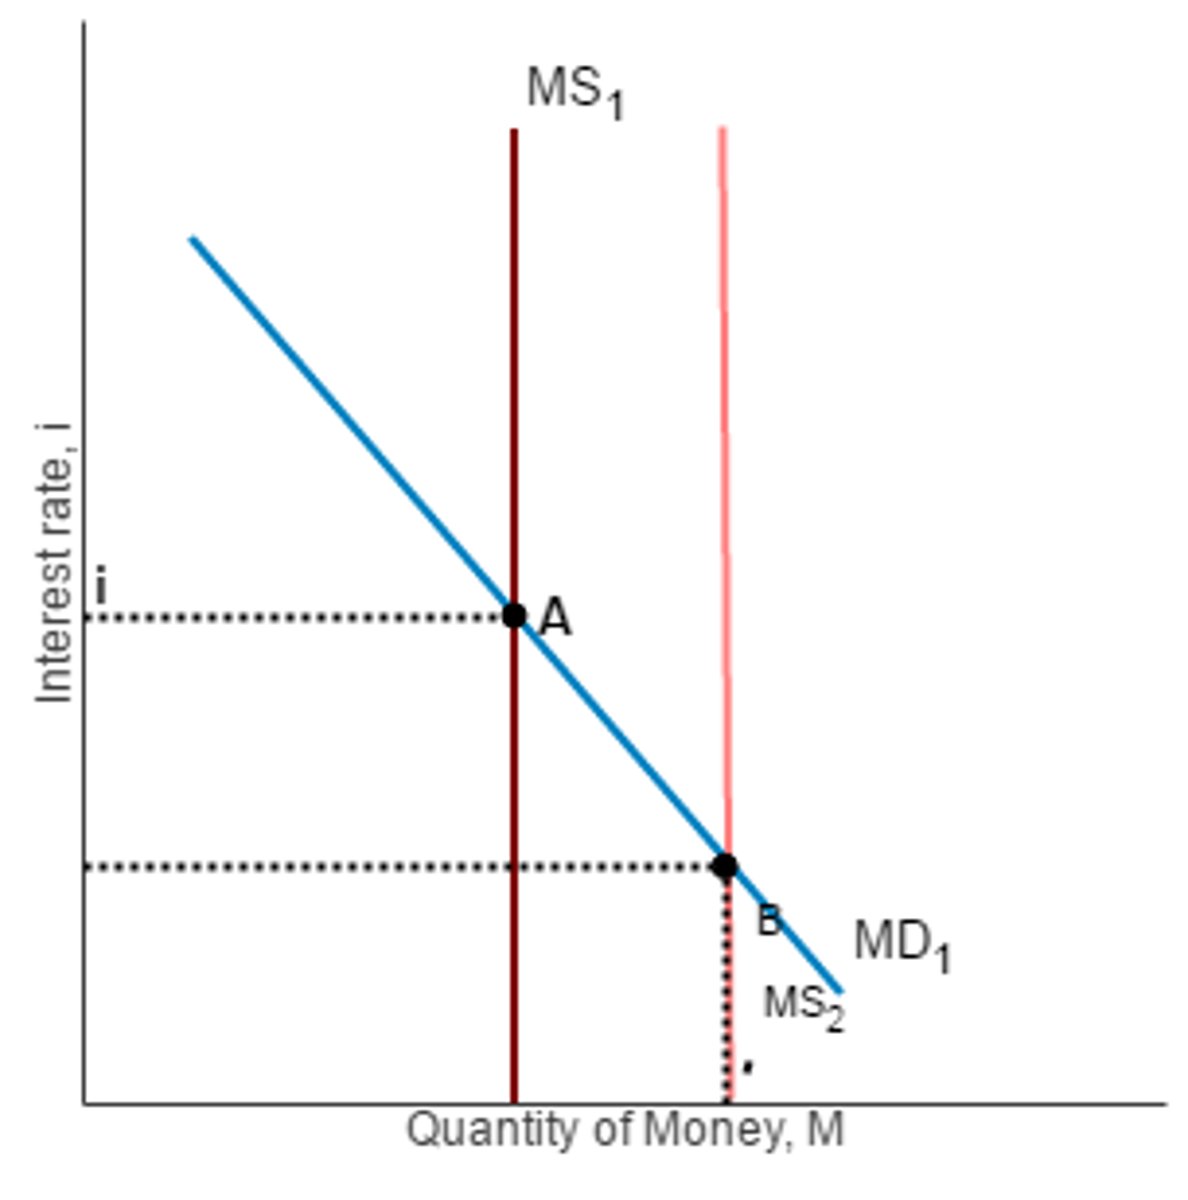
Money Market Graph
A graph where money supply is vertical and money demand is downward sloping; determines the nominal interest rate.
Expansionary Monetary Policy
Policy that increases the money supply and lowers interest rates to stimulate spending and AD.
Contractionary Monetary Policy
Policy that decreases the money supply and raises interest rates to reduce spending and AD.
Liquidity Trap
A situation where interest rates are near zero and monetary policy is ineffective.
Aggregate Demand (AD)
The total quantity of goods and services demanded at different price levels; downward sloping.
Wealth Effect
Higher price levels reduce the purchasing power of wealth, lowering consumption.
Interest Rate Effect
Higher price levels increase interest rates, reducing investment.
Exchange Rate Effect
Higher domestic prices raise exchange rates, reducing net exports.
Shifters of AD
Changes in consumption, investment, government spending, or net exports.
Short-Run Aggregate Supply (SRAS)
Shows the quantity of goods and services firms produce in the short run; upward sloping because of sticky wages/prices.
Long-Run Aggregate Supply (LRAS)
Vertical line at full-employment output; reflects the economy's maximum sustainable output.
Shifters of SRAS
Changes in resource costs, productivity, expectations, or supply shocks.
Shifters of LRAS
Changes in technology, capital, labor, or natural resources.
Short-Run Macroeconomic Equilibrium
The point where AD intersects SRAS.
Long-Run Macroeconomic Equilibrium
The point where AD, SRAS, and LRAS intersect.
Demand Shock
A sudden change in AD due to shifts in spending.
Supply Shock
A sudden change in SRAS due to cost or productivity changes.
Stagflation
A combination of high unemployment and high inflation caused by negative supply shocks.
Self-Correction
The process where wages and prices adjust, moving SRAS back to long-run equilibrium.
Fiscal Policy
The use of government spending and taxation to influence the economy.
Expansionary Fiscal Policy
Increases government spending or decreases taxes to raise AD.
Contractionary Fiscal Policy
Reduces government spending or raises taxes to lower AD.
Government Spending Multiplier
The idea that $1 of gov't spending leads to more than $1 increase in GDP.
Tax Multiplier
The idea that $1 change in taxes leads to a multiplied change in spending (weaker than spending multiplier).
Automatic Stabilizers
Government programs (like unemployment benefits or progressive taxes) that automatically counteract economic fluctuations.
Demand-Pull Inflation
Inflation caused by increases in aggregate demand.
Cost-Push Inflation
Inflation caused by rising production costs or negative supply shocks.
Expected Inflation
The inflation rate people expect in the future.
Unexpected Inflation
Inflation that was not anticipated, causing redistribution between borrowers and lenders.
Menu Costs
Costs associated with changing prices.
Shoe-Leather Costs
Costs of holding less cash and making more trips to the bank during high inflation.
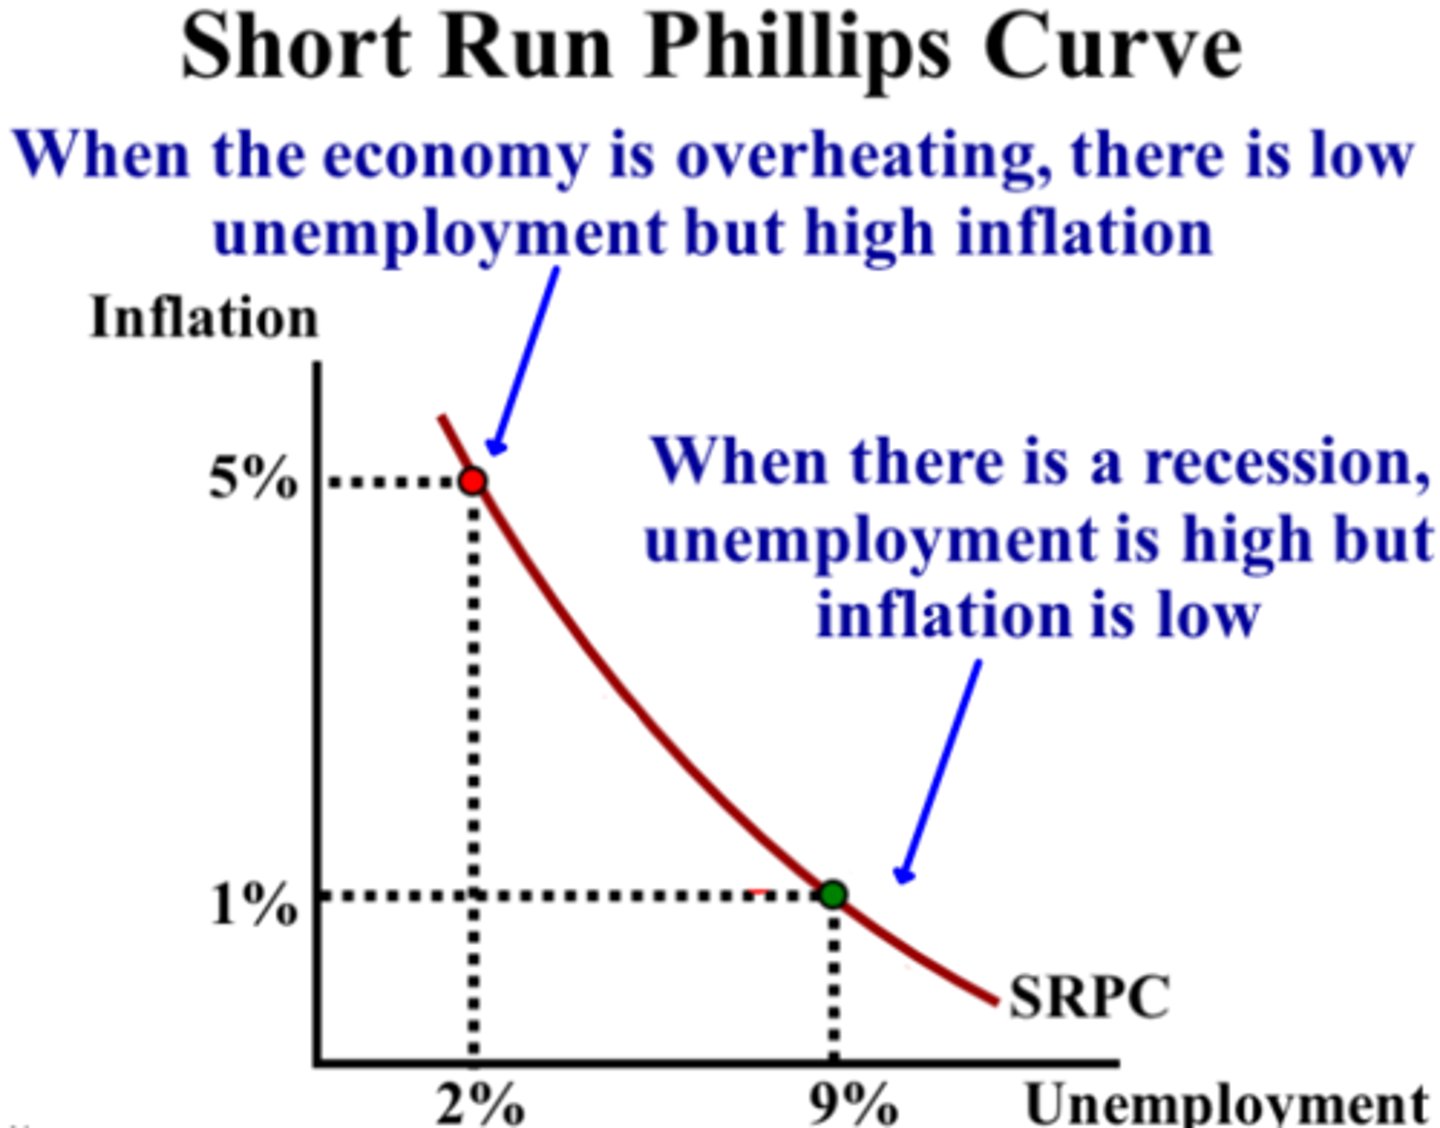
Phillips Curve (Short Run)
Shows an inverse relationship between inflation and unemployment.
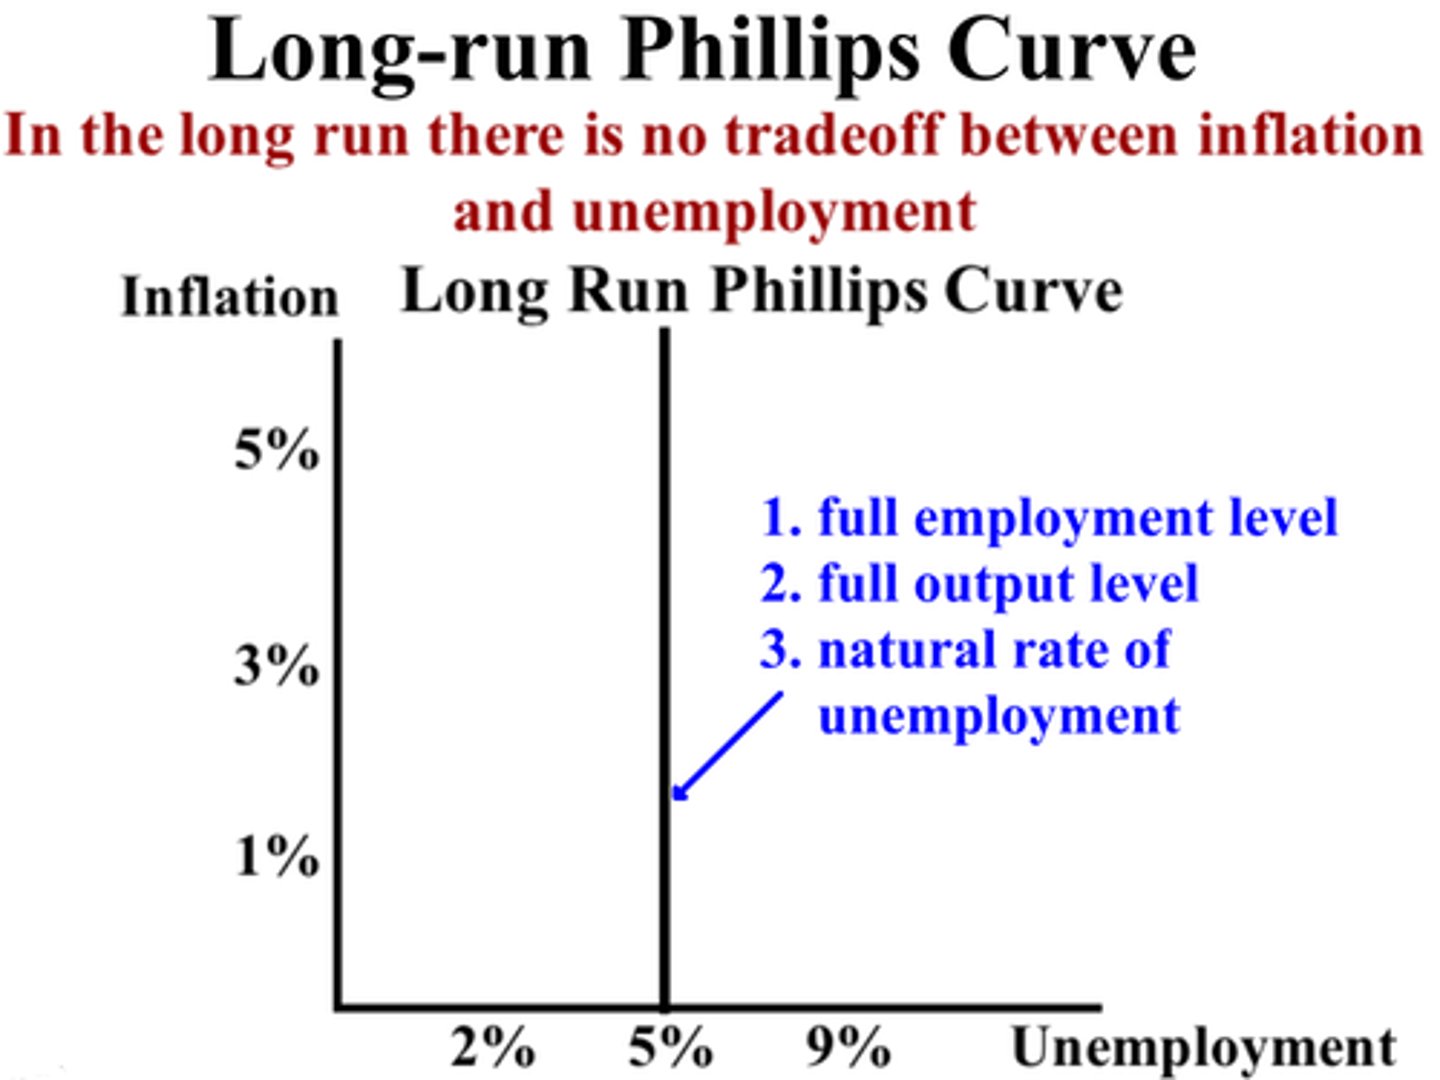
Phillips Curve (Long Run)
Vertical line at the natural rate of unemployment; shows no long-run tradeoff.
Expectations-Augmented Phillips Curve
Shows how inflation expectations shift the short-run Phillips Curve.
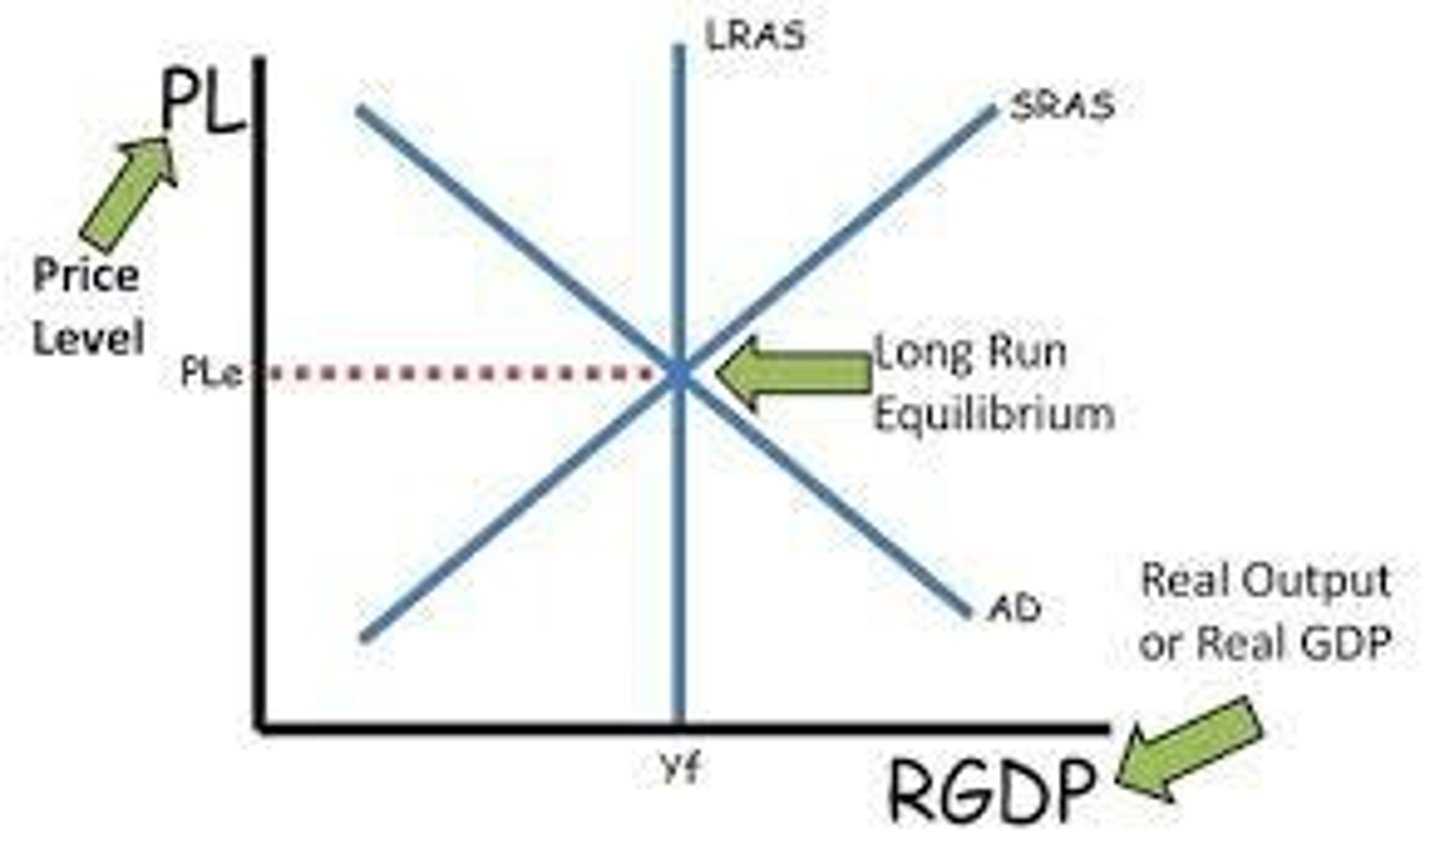
Aggregate Demand & Aggregate Supply (AD-AS Model)
A model showing the relationship between the overall price level and real GDP. The AD curve slopes downward, the SRAS curve slopes upward, and the LRAS curve is vertical at full employment. Used to analyze recessions, inflation, and economic growth. Rightward shifts of AD or SRAS increase output; leftward shifts cause contractions or inflation.
Short-Run Phillips Curve (SRPC)
A downward-sloping curve showing the short-run inverse relationship between inflation and unemployment. Movements along the curve come from AD shifts; the curve shifts from changes in inflation expectations or supply shocks.
Long-Run Phillips Curve (LRPC)
A vertical line at the natural rate of unemployment indicating that in the long run, there is no tradeoff between inflation and unemployment. Shifts in inflation expectations move the SRPC but do not affect the LRPC.
Money Market Graph
A graph showing the equilibrium interest rate based on the money supply and money demand. Money supply is vertical (set by the central bank) and money demand slopes downward. Increasing money supply lowers interest rates; decreasing it raises interest rates.
Production Possibilities Frontier (PPF) Graph
A curve showing the maximum combinations of two goods that can be produced with available resources. A bowed-out shape reflects increasing opportunity costs. Points inside are inefficient, points on the curve are efficient, and points outside are unattainable. Outward shifts represent economic growth.
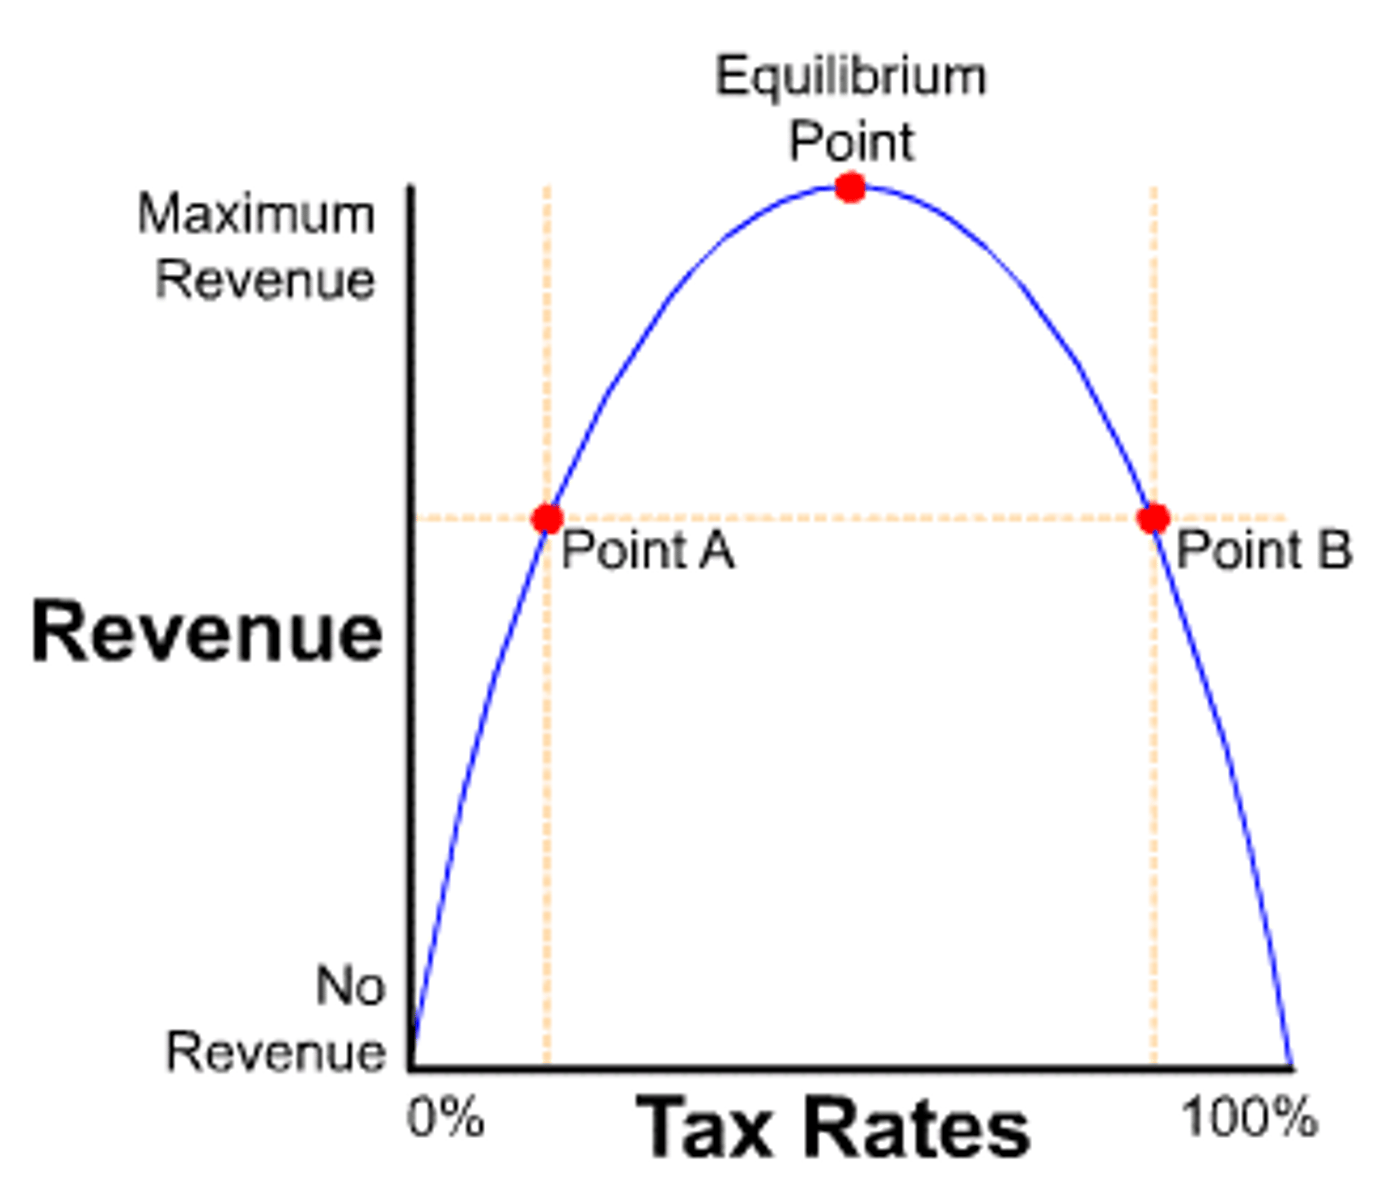
Laffer Curve
An inverted U-shaped curve showing the relationship between tax rates and tax revenue. Revenue increases as tax rates rise until a peak; beyond that point, higher taxes reduce incentives to work or produce, lowering tax revenue.
Future Value
FV = PV × (1 + r)ⁿ
Present Value
PV = FV / (1 + r)ⁿ
Market Capitalization Equation
GDP Equation
GDP = C + I + G + NX; the sum of consumption, investment, government spending, and net exports.
Federal Reserve Duty
Keep inflation rates low and maximize employment. They accomplish this through monetary policy
Federal Reserve Cities
New York, Philadelphia, Boston, Dallas, Chicago
Stock Market Indices
S&P 50, Dow 30, Nasdaq
Largest U.S Private Sector Employers
Walmart,
3 Rating Credit Rating Agencies
S&P, Fitch, Moody's
Translation of basis points to percent
50 points = .50
Leading Indicators
Lagging Indicators
3 Influences of Labor Productivity
3 Financial Statements
EBITDA
Earnings before interest, taxes, depreciation, and amortization
3 U.S Companies w Market Cap over $3T
Apple, Microsoft, Nvidia
Largest U.S Retailers
Walmart, Amazon, Costco
Quantitative Easing
A monetary policy instrument where the central bank buys financial assets in exchange for money in order to increase borrowing and lending in the economy.
Quantitative Tightening
The opposite of quantitative easing. An open-market operation in which bonds are sold by a central bank in order to decrease the quantity of excess reserves held by commercial banks and thereby (hopefully) restrain the economy by decreasing the amount of lending undertaken by commercial banks. The bond sales also raise interest rates by decreasing bond prices.
Supply Side Inflation
privatisation/deregulation, investment in education/training, more flexibile job markets, reduced tax rates, reduced power of trade unions