Module 7-8: Image Interpretation, Land Cover Classification, and Accuracy Assessment
1/46
Earn XP
Description and Tags
Lecture 09-11
Name | Mastery | Learn | Test | Matching | Spaced |
|---|
No study sessions yet.
47 Terms
Image Interpretation
This is the process of identifying objects or conditions in images and determining their meaning/significance
Subject
Geographic Region
Remote Sensing System
Image interpretation is based on three separate kinds of knowledge:
Classification, Enumeration, Measurement, and Delineation
Tasks of Image Interpretation
Classification
It is the assignment of objects, features, or areas to classes based on their appearance on the imagery.
Detection, recognition, and identification
Classification follows the process of:
Detection
s the assignment of objects, features, or areas to classes based on their appearance on the imagery.
Recognition
s the assignment of objects, features, or areas to classes based on their appearance on the imagery.
Identification
means that the identity of an object or feature can be specified with enough confidence and detail to place it in a specific class.
Enumeration
This task means that the identity of an object or feature can be specified with enough confidence and detail to place it in a specific class
Photogrammetry and photometry
Measurment Can be done either:
Photogrammetry
measurement of distance and height and, by extension, the measurement of volumes and areas
Photometry
measurement is quantitative assessment of image brightness.
Delineation
delineate, or outline, regions as they are observed on remotely sensed images.
- SIze - Shape - Tone/Hue/Color - Texture - Shadow - Pattern - Association - Site/Location
Elements of Image Interpretation
. Look for a scale
Look for patterns, shapes, and textures
Define the colors (including shadows)
Find North
Consider your prior knowledge
5 tips and strategies for Image Interpretation
Image Classification
The task of assigning pixels in an image to specific categories or classes of interest (e.g., land cover types)
Unsupervised classification and Supervised classification
There are 2 classification methods:
Unsupervised Classification
involves the algorithm dividing/classifying the image into classes without using any training samples
The algorithm identifies clusters of pixels with similar spectral signatures without prior knowledge of what those clusters represent.
Supervised Classification
involves the use of training samples/data with known classes to train a classification algorithm.
The algorithm "learns" the spectral signatures of different classes based on the p
Accuracy Assessment
Quantitatively assess how well a classification worked.
Evaluate errors for each class, ultimately, determining the reliability of the produced map.
Aerial photo
Ground truth data (with GPS information)
Other GIS files
Some possible reference data include:
true
T/F. The dates on the remote sensing data (e.g. satellite data used for classification) and your validation data must be the same or does not have a significant gap.
Create our own validation data.
What if ground truth data is unavailable?
Human errors such as, but not limited to:
a. Misinterpretation of some features (due to low resolution image) b. Personal biases in selecting the regions of interest or ROIs.
But there are some implications of using this method (creation of own validation data)
Difference in resolution (Landsat 8 has 30m spatial resolution)
Map products like Google Earth “mosaics” several images from different time frames to produce a “cloudless” data.
Why not use high resolution imagery like Google Earth or Bing?
error matrix
Examines the relationship between the reference data and the predicted outputs per class.
One of most common methods to evaluate accuracy.
confusion matrix or contingency table
the error matrix is also called as
Reference Class; Predicted Class
In error matrix, A table of nxn cells corresponding to the number of classes, where the columns represent the —and the rows represent the —.
Total Accuracy, User’s Accuracy, Producer’s Accuracy, and Kappa Statistics
What are the types of Metrics
. Total (Overall) Accuracy
Calculated by dividing the total number of correctly classified samples by the total number of reference pixels
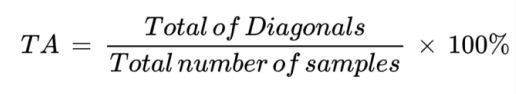
Formula for Total Accuracy
Only shows the overall performance of the classifier (average) and does not give insight on the distribution of error along all classes.
What is the main problem in total accuracy
User’s Accuracy
Corresponds to the error of commission (inclusion) - considers the number of pixels which does not actually belong to that specific classification.
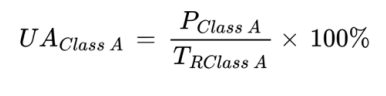
Formula for User’s Accuracy
the class is over-represented
what does a low user’s accuracy mean?
—> many pixels labeled as that class actually belong to others.
Producer’s Accuracy
Corresponds to the error of omission (exclusion) - considers the number of pixels not included in the correct classification.
Represents the probability that a reference (ground truth) pixel of a given class was correctly mapped in the classification.
It evaluates how well the classifier captured actual ground conditions.
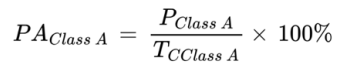
Formula for Producer’s accuracy
many reference samples of that class were placed in other categories on the map.
What does a low producer’s accuracy
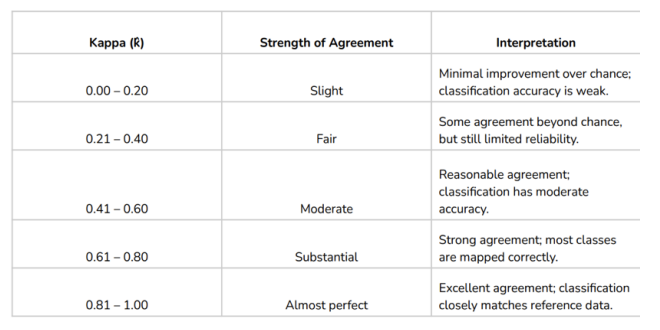
Kappa Statistic
Is a discrete multivariate method for accuracy assessment.
considers the expected agreement by chance, taking into account the class distribution and preventing biased results. (ex more vegetation than bare soil)
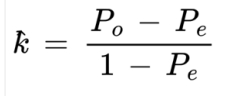
Formula for Kappa Statistic
k
In Kappa Statistic, this is a measure of agreement of accuracy between two measures.
+1.0
Kappa Statistic Interpretation:
A value of — indicates perfect agreement,
0
Kappa Statistic Interpretation:
indicates agreement equivalent to random chance,
negative values
Kappa Statistic Interpretation:
negative values indicate less agreement than expected by chance
-1.0
Kappa Statistic Interpretation:
is a perfect disagreement.
Incorrect training data
Misregistration between the map and reference imagery
Poor classifier performance (e.g., wrong spectral signatures)
Heavily unbalanced class distributions causing spurious results
A negative k often arises from:
Positive kappa