APES Unit 4
1/26
There's no tags or description
Looks like no tags are added yet.
Name | Mastery | Learn | Test | Matching | Spaced | Call with Kai |
|---|
No analytics yet
Send a link to your students to track their progress
27 Terms

Which of the following abiotic factors, when graphed on the x-axis, leads to the curved line in the graph due to variation in the different layers of the atmosphere?
Temperature gradients

The vast majority of ozone (O3) is found in a thin layer due to a lack of circulation in which of the following atmospheric layers?
Stratosphere
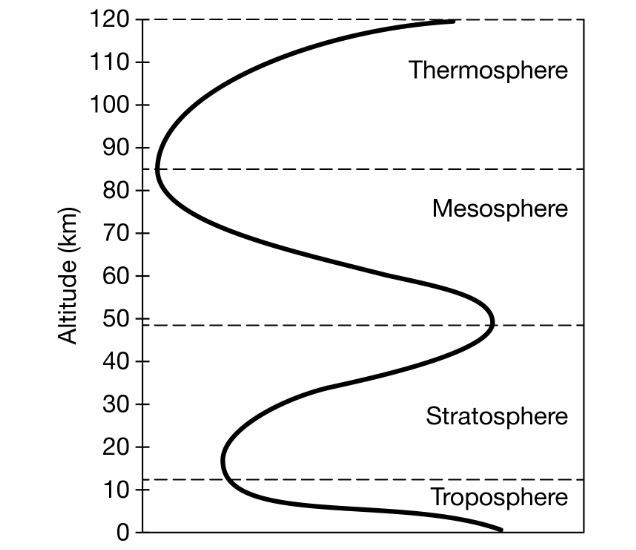
Which of the following layers of the atmosphere contains charged gas molecules that glow and produce light when hit by solar energy, leading to glowing gases such as the northern lights, found over 90 kilometers above Earth's surface?
Thermosphere

A group of students wanted to determine if soil texture can vary by location. Several students brought in a sample of soil from their backyards. Each student added their soil sample of equal mass to a jar with exactly the same amount of water, shook the contents so that all soil particles were suspended in the water, and left the jars covered overnight. The next morning, the soil particles had settled out into layers and students could determine the percentage of each type of particle. The results of their soil test are shown below. Which of the following describes the independent variable in this investigation?
Soil samples taken from different locations

Which of the following describes the dependent variable in this investigation?
Percentage of each particle size in each soil sample
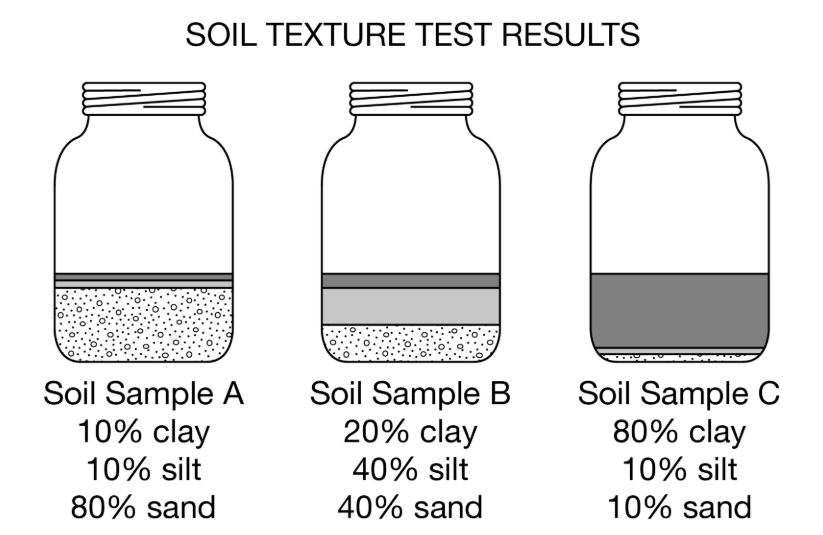
A student claims that soil sample B would be classified as a loam. Which of the following best describes the method used by the student to reach this conclusion?
The student used a soil triangle to determine where the lines intersect for sand, silt, and clay for the soil sample.
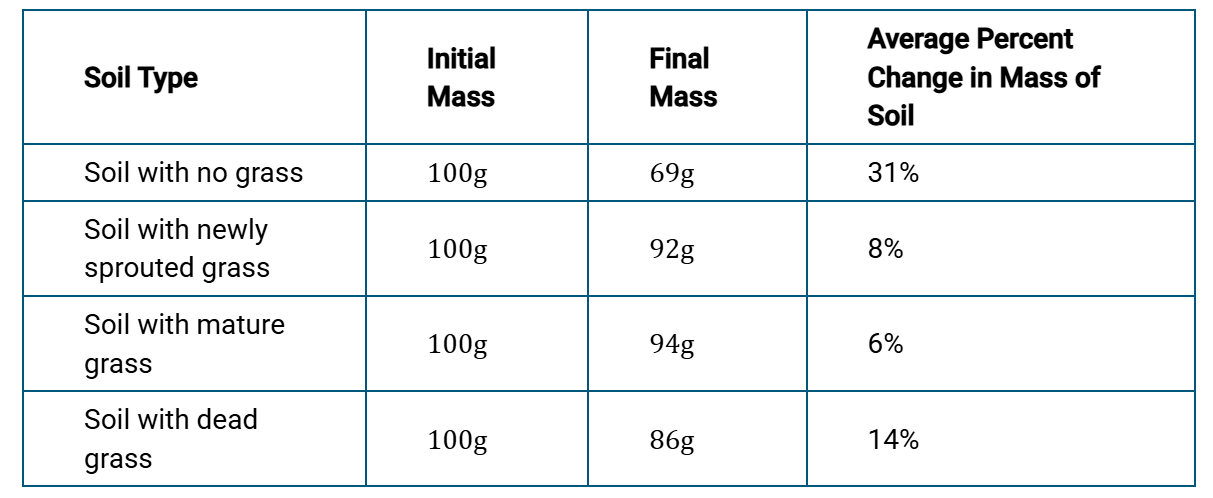
Students want to determine how vegetation affects soil erosion. They collect four soil samples of equal starting mass with different types of vegetative cover, as seen in the table below. Each sample is placed in a three-sided plastic dish that can drain into a beaker and is exposed to the same amount of consistent, steady rainfall for ten minutes. The water and soil runoff are collected in the beaker and separated. The average values for each sample are provided below. Which of the following is the control group for this experiment?
Soil with no grass

Which of the following is a dependent variable in the experiment?
Percent change in mass of the soil sample
The Mississippi watershed is the largest in North America, draining all or part of thirty-two states in the United States and two Canadian provinces. A new apartment complex is being built on a steep slope near the source of the Mississippi River outside of Minneapolis, Minnesota. Which of the following measures should be taken to best reduce erosion at the construction site to protect the Mississippi watershed?
Plant grass and shrubs on the slope
During a La Niña event, what environmental changes would the tropical Pacific Ocean and its surrounding landmasses most likely experience?
Increased upwelling off the coast of South America resulting in increased productivity of fisheries
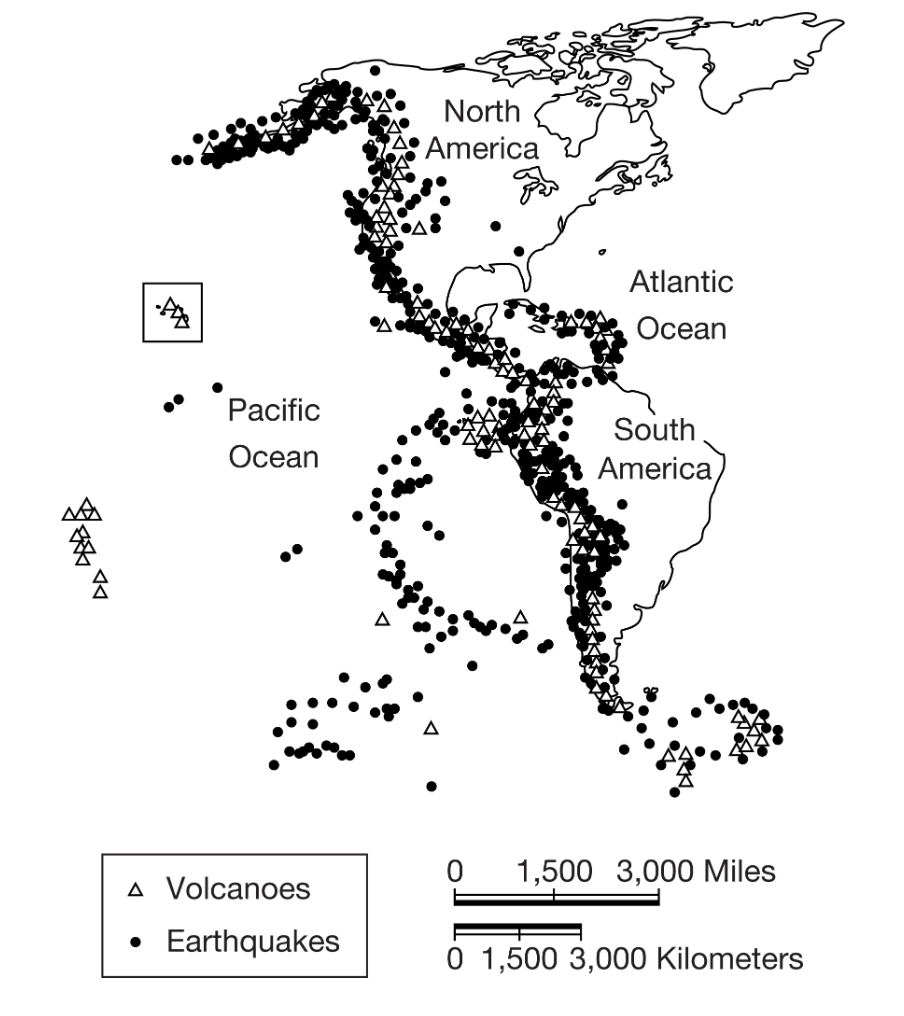
The map above shows the locations of known volcanoes and earthquakes. Which of the following explains what is being illustrated in the enclosed area in the northwest portion of the map?
The enclosed area shows a hot spot in the middle of the Pacific Plate in the Hawaiian Islands.
A developer wants to develop a large tract of land near a watershed, which will require the removal of several large trees. Which of the following statements best describes the impact that the development would have on the watershed?
Removing large trees would cause an increase in temperature and keep the surrounding water and soil warmer.
The Chesapeake Bay is a watershed that is located in six states and the District of Columbia. Which of the following can cause an increase in water pollution in the watershed?
An increase in stormwater runoff in urban areas

Which of the following is the best explanation for the formation of Hadley cells in the tropics, as seen in the diagram, between 30°N and 30°S latitude?
The Sun warms the moist air at the equator and causes it to rise because of its lower density. As the warm air moves away from the equator, it cools, becomes denser, and then sinks.
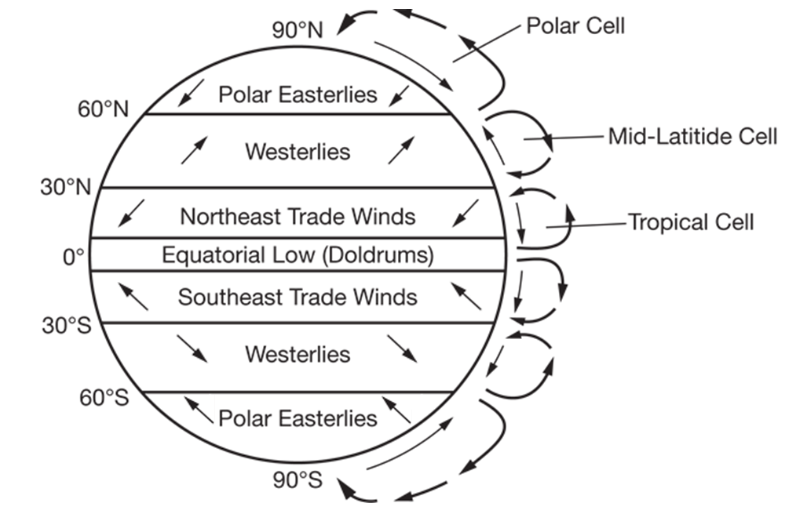
Which of the following is the best explanation for the deflection of the trade winds in both hemispheres, as seen in the diagram above?
The wind is deflected west because of Earth's rotation.
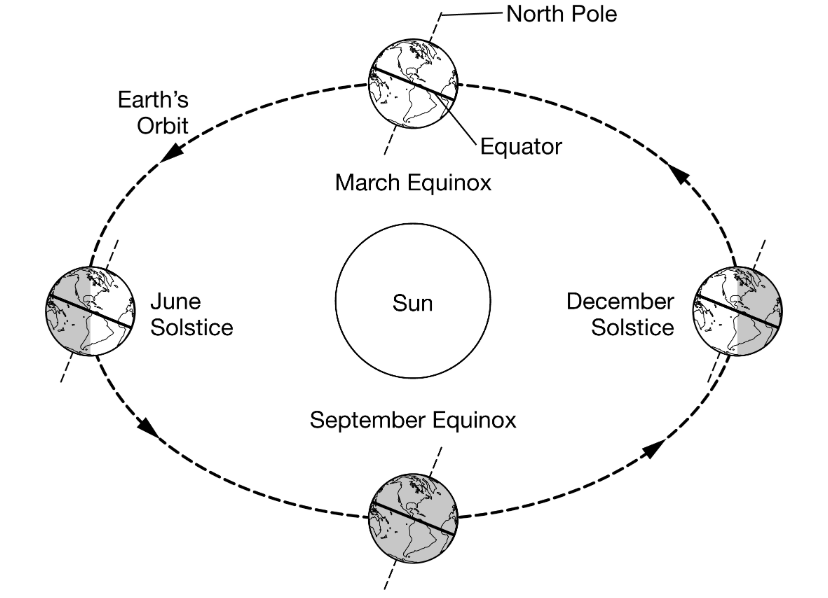
Based on the diagram, which of the following days in Earth's yearly orbit would have the longest period of daylight in the Northern Hemisphere?
June solstice

Which statement is best illustrated in the diagram above regarding how the Sun's energy affects the Earth's surface from June through September in the Northern Hemisphere?
The season changes from summer to autumn, daylight hours decrease, and infrared radiation is the strongest during the June solstice.

Based on the diagram, which of the following describes why the summer solstice in Australia occurs in December and not in June?
At this time of year, the tilt of Earth causes Australia to receive highly concentrated solar radiation.
Peru's commercial anchovy industry would most likely be harmed during an El Niño Southern Oscillation (ENSO) event. Which of the following is the most likely explanation for the decline in anchovy during an El Niño Southern Oscillation (ENSO) event?
Less nutrient-rich water reaches surface waters, disrupting the food web.
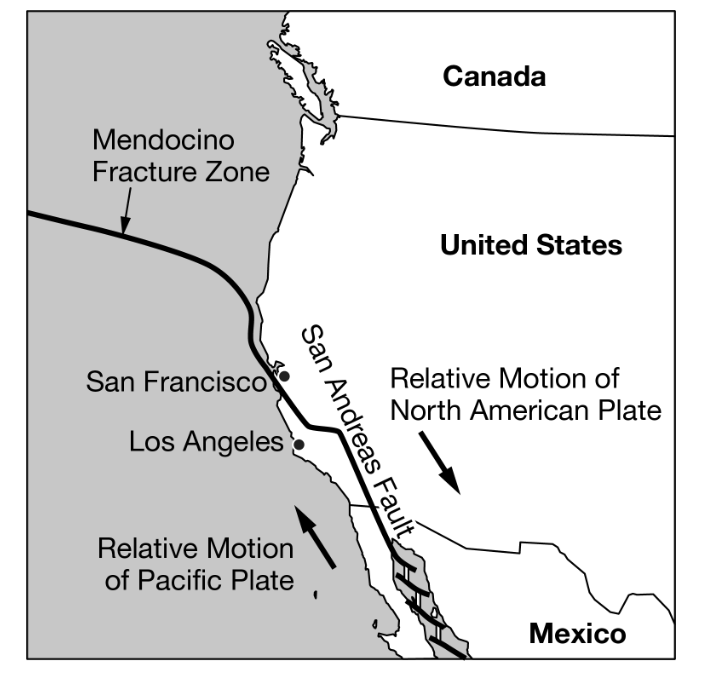
Which of the following statements best describes the boundary between the two tectonic plates seen in the map?
The map illustrates a transform boundary, where tectonic plates slide past each other as the Pacific Plate moves northwest and the North American Plate moves southeast.
During an El Niño event, farmers in the southwestern United Stated often benefit from which of the following climatic changes?
Wetter and warmer weather that increases soil moisture

Based on the map above, which of the following best explains why the Atacama Desert has a consistently arid climate?
It is in the rain shadow of the Andes Mountains.
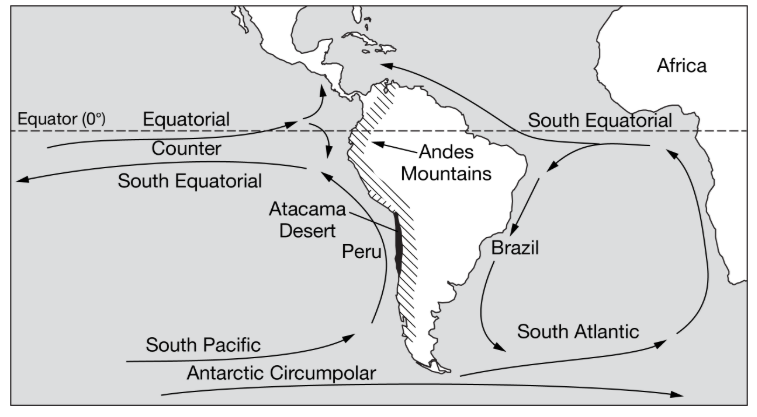
Based on the map above, which of the following best identifies and explains the region of South America that would have a more moderate climate?
The east coast would have a more moderate climate because of the Brazil Current.

Based on the map, which of the following best explains the area of the Andes Mountains that would have the greatest number of rivers?
More rivers would be located on the east side of the Andes Mountains because the trade winds are coming from the east.
Which of the following would be most helpful to determine the soil texture of a sample?
A density gradient tube and a soil triangle
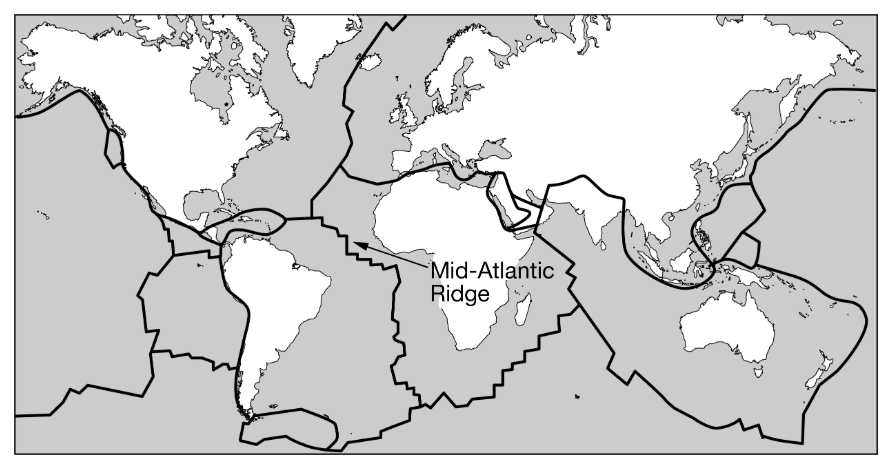
The Atlantic Ocean is expanding as a result of plate tectonics. Which of the following explanations best identifies the type of plate boundary and processes occurring at the Mid-Atlantic Ridge, as shown in the diagram below?
A divergent plate boundary exists at the Mid-Atlantic Ridge where plates move away from one another, leading to seafloor spreading.
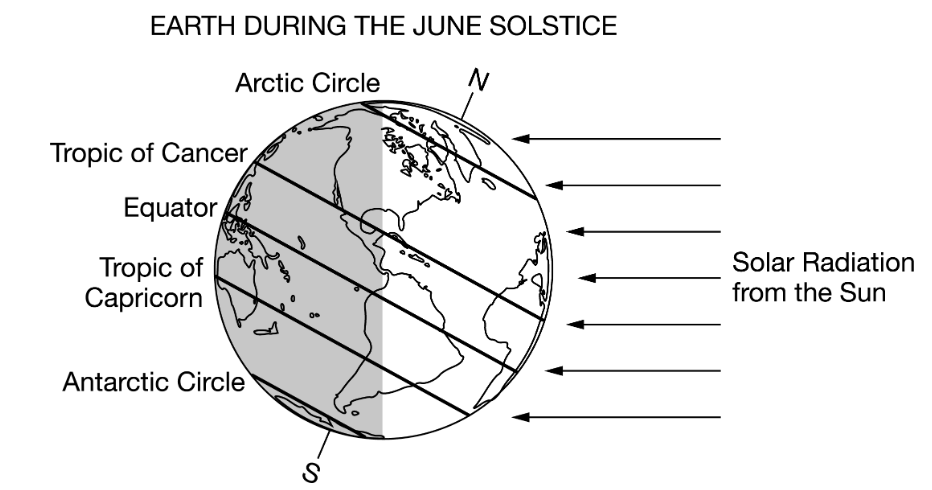
Which of the following combinations correctly identifies and explains the effects of the differences in the distribution of solar radiation on Earth as seen in the diagram above?
Global wind patterns are created because uneven solar radiation results in warm air at low latitudes and cool air at high latitudes, resulting in density differences between the air masses.