H2 Turnbull- Single-species populations I, II + III: Population growth and intraspecific competition, Population limitation and the determinants of population size, + Simple models in discrete time.
1/8
There's no tags or description
Looks like no tags are added yet.
Name | Mastery | Learn | Test | Matching | Spaced | Call with Kai |
|---|
No analytics yet
Send a link to your students to track their progress
9 Terms
what are the different continuous models for population growth and what are their limitations?
linear function:
N = mt + c
dN/dt = m
this means the population growth rate is independent of N, which isn’t sensible
negative values are also possible
exponential model:
Nt = N0 ert
dN/dt = rN
this means the absolute growth rate is proportional to the population size, which is sensible
exponential decay tends towards 0, so negative values aren’t possible
1/N dN/dt = r
the per capita growth rate is constant, no matter how big the population gets, so this doesn’t account for environmental constrictions
logistic model:
dN/dt = rN [(k-N)/k] where k is the carrying capacity of the environment, and r is the instrinsic rate of population increase
this model gives exponential growth in small populations, which decreases to 0 nearing the carrying capacity, which is sensible
1/N dN/dt = r [(k-N)/k)]
so when N is small, the per capita growth rate is equal to the intrinsic growth rate, but decreases linearly with increasing N
this takes into account (negative) density dependence
however this model is still basic
what determines r and k in population modelling?
r is the intrinsic growth rate, which is a life-history dependent trait (picture)
k is the carrying capacity (the maximum number of individuals that the environment can support)- this is not a life-history dependent trait
however it is environment dependent- due to weather, acorn masting events etc
k can then be made a random variable across a normal distribution

what is the discrete time logistic model?
(the continuous time logistic model is dN/dt = rN [(k-N)/k])
this is an iterative model, where the absolute growth rate = Nt+1 - Nt, and the per capita growth rate = (Nt+1 - Nt)/Nt
this can be modified so that K is a variable across a normal distribution, rather than a constant, to account for environmental stochasticity
this is a deterministic equation- if you know the values of Nt, k and r, you will obtain the same population prediction every time, which isn’t realistic
![<ul><li><p>(the continuous time logistic model is dN/dt = rN [(k-N)/k])</p></li><li><p>this is an <strong>iterative </strong>model, where the absolute growth rate = N<sub>t+1</sub> - N<sub>t</sub>, and the per capita growth rate = (N<sub>t+1</sub> - N<sub>t</sub>)/N<sub>t</sub></p></li><li><p>this can be modified so that K is a variable across a normal distribution, rather than a constant, to account for environmental stochasticity</p></li><li><p>this is a <strong>deterministic </strong>equation- if you know the values of N<sub>t</sub>, k and r, you will obtain the same population prediction every time, which isn’t realistic</p></li></ul><p></p>](https://knowt-user-attachments.s3.amazonaws.com/e7b50f57-088a-4e78-88eb-e8ba8a324456.png)
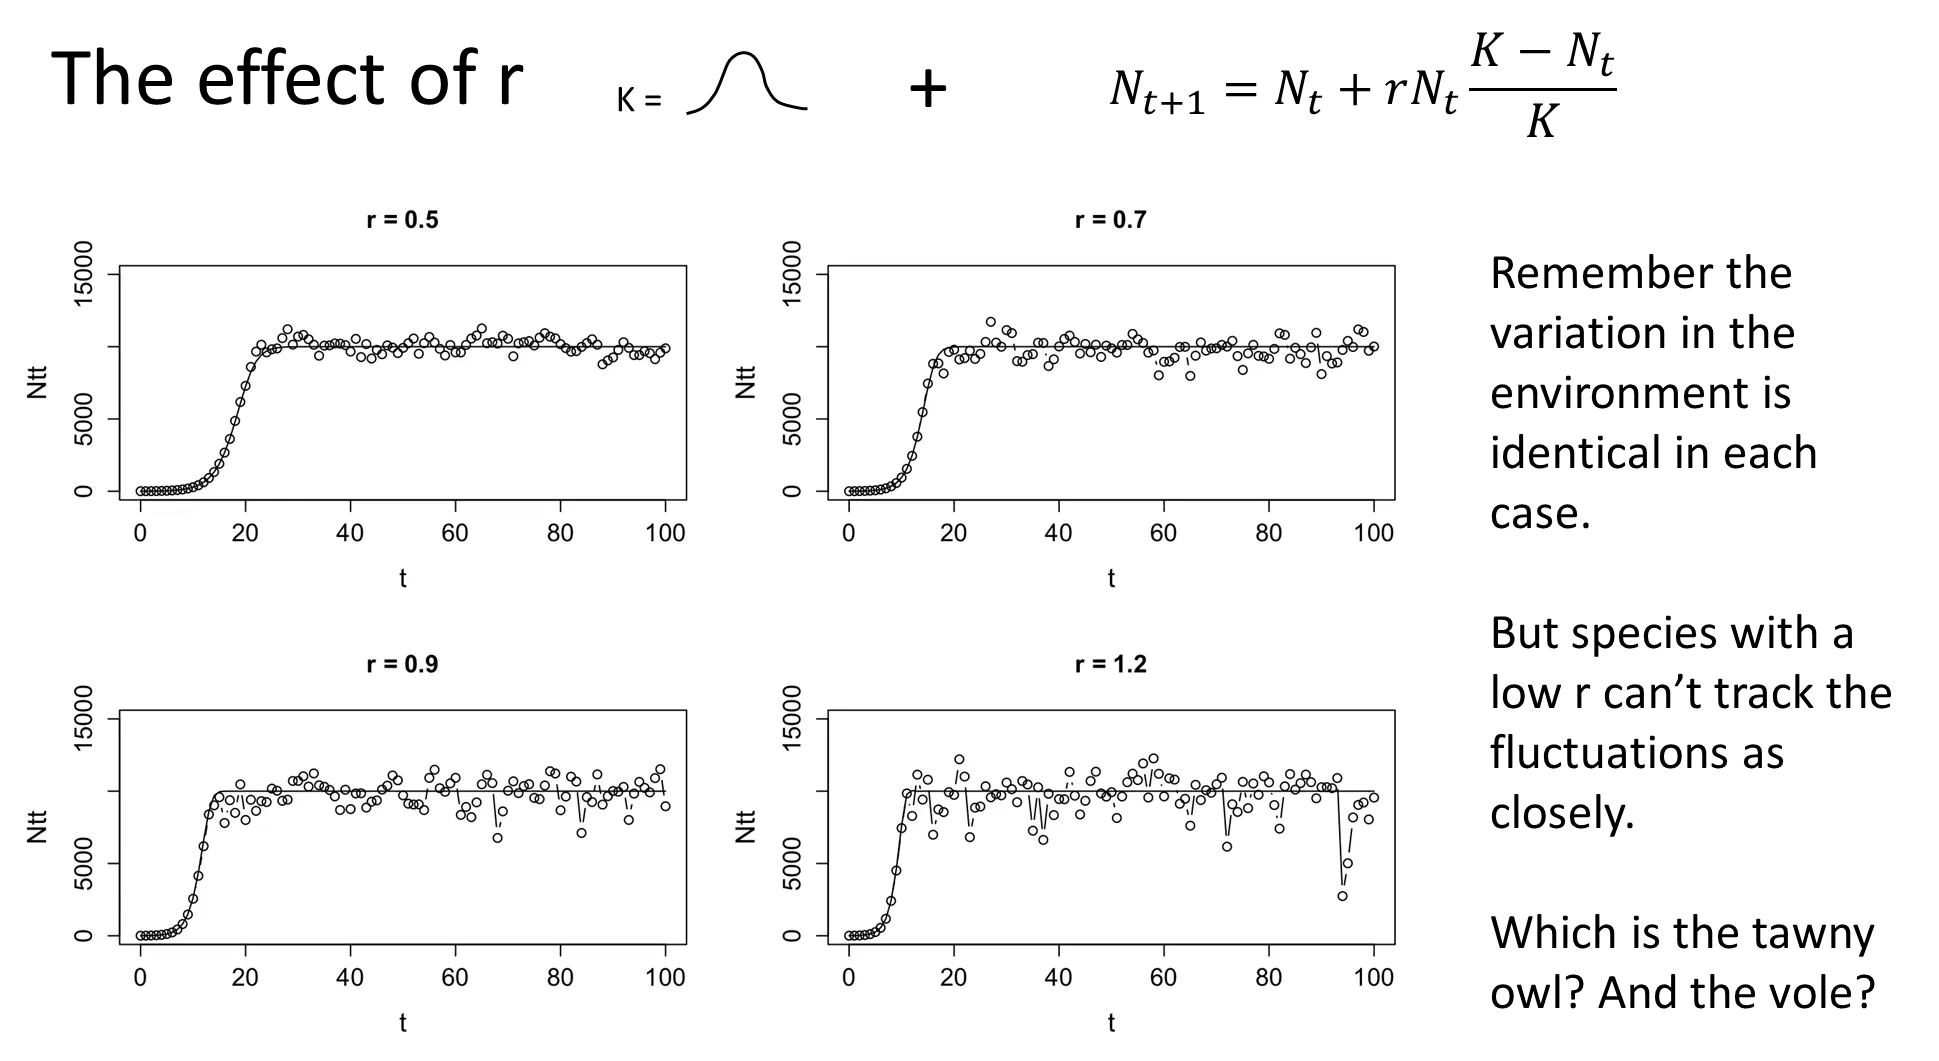
how does r affect the fluctuations in a population and its ability to recover from crashes?
as r increases, the ability of a population to track/follow stochastic variations in the environment increases, so the population fluctuates much more
species with low r are less affected by environmental stochasticity, and vice versa
as r increases, the ability of a population to recover from catastrophic events increases
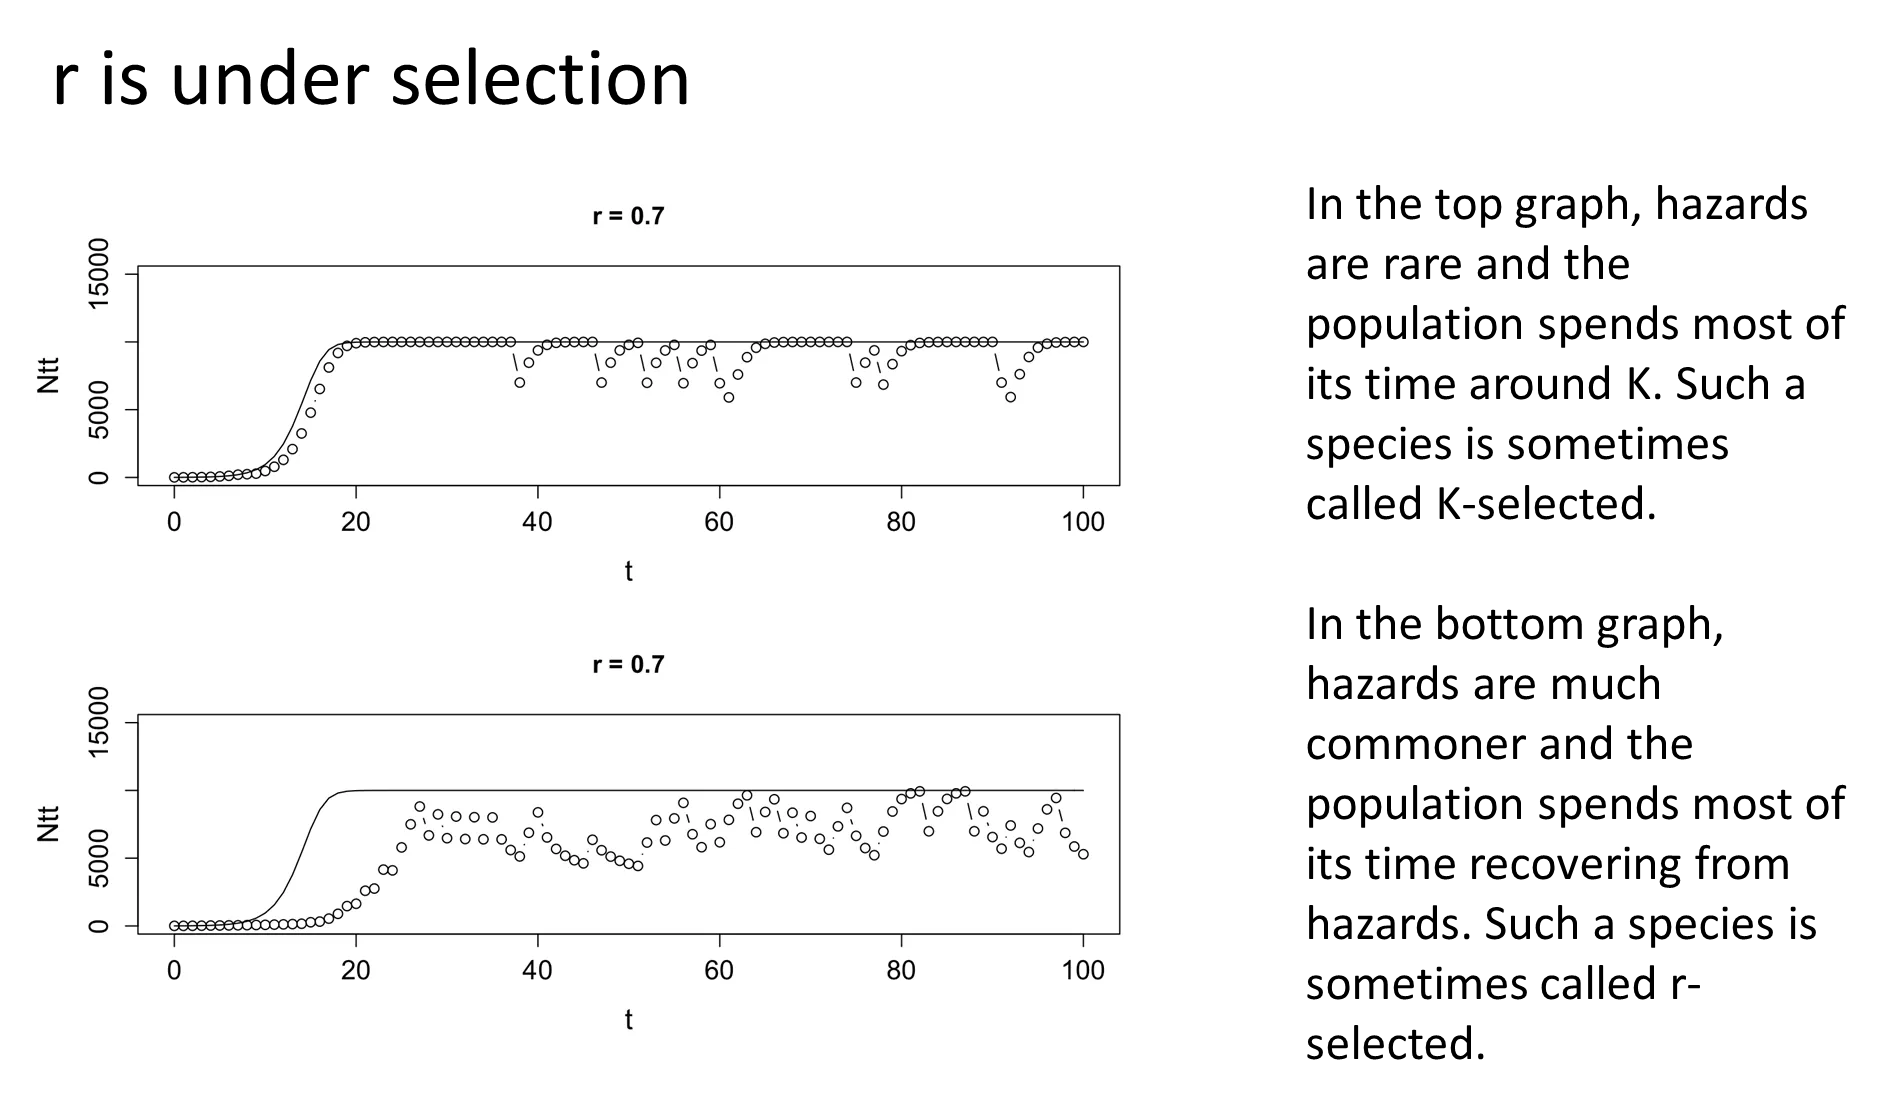
how do species evolve different r values?
r is selected based on the environment a population is in
when you live in a non-hazardous environment, your population is more dependent on stochastic variations of k, so a low r is favoured (k-selected):
resource competition favours large body size, late maturation and few, large offspring eg. seabirds, elephants + whales
when you live in a hazardous environment, your population spends more time recovering from crash events, so a high r is favoured to bounce back faster (r-selected):
recovery phases favours small body size, large, frequent litters and early sexual maturity eg. rabbits + rodents
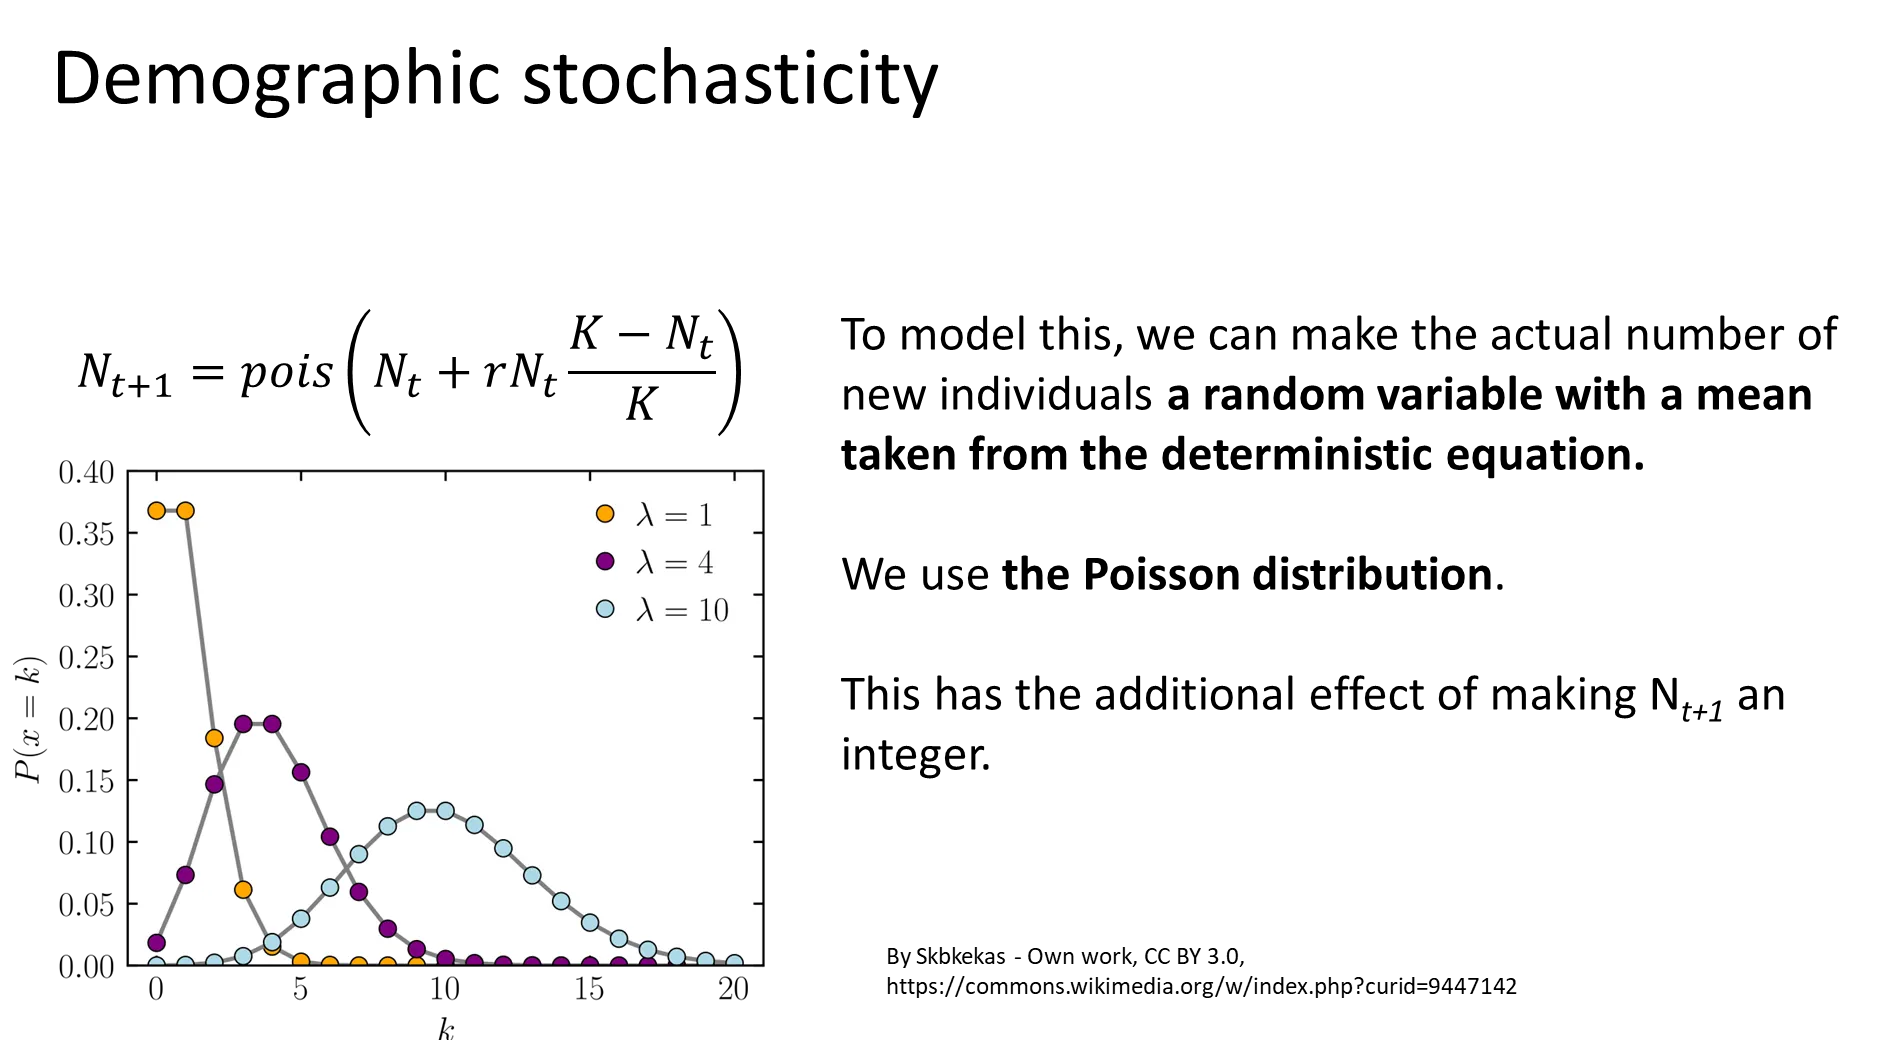
what is demographic stochasticity and why does it matter??
demographic stochasticity is fluctuations in population size that occur because the birth and death of each individual is a random, discrete and probabilistic event eg. can’t have 1.5 children
this is modelled by treating the number of new individuals as a random variable across a normal distribution, rather than as a deterministic quantity (so the same predictions won’t be attained each time)
a poisson distribution is used, because the values are integers and can’t be negative (bounded at 0)
the relative effect of demographic stochasticity is lower in large populations, but it is very influential in small populations, especially those with low r
this type of randomness is endogenous to the population- it's not imposed by the environment
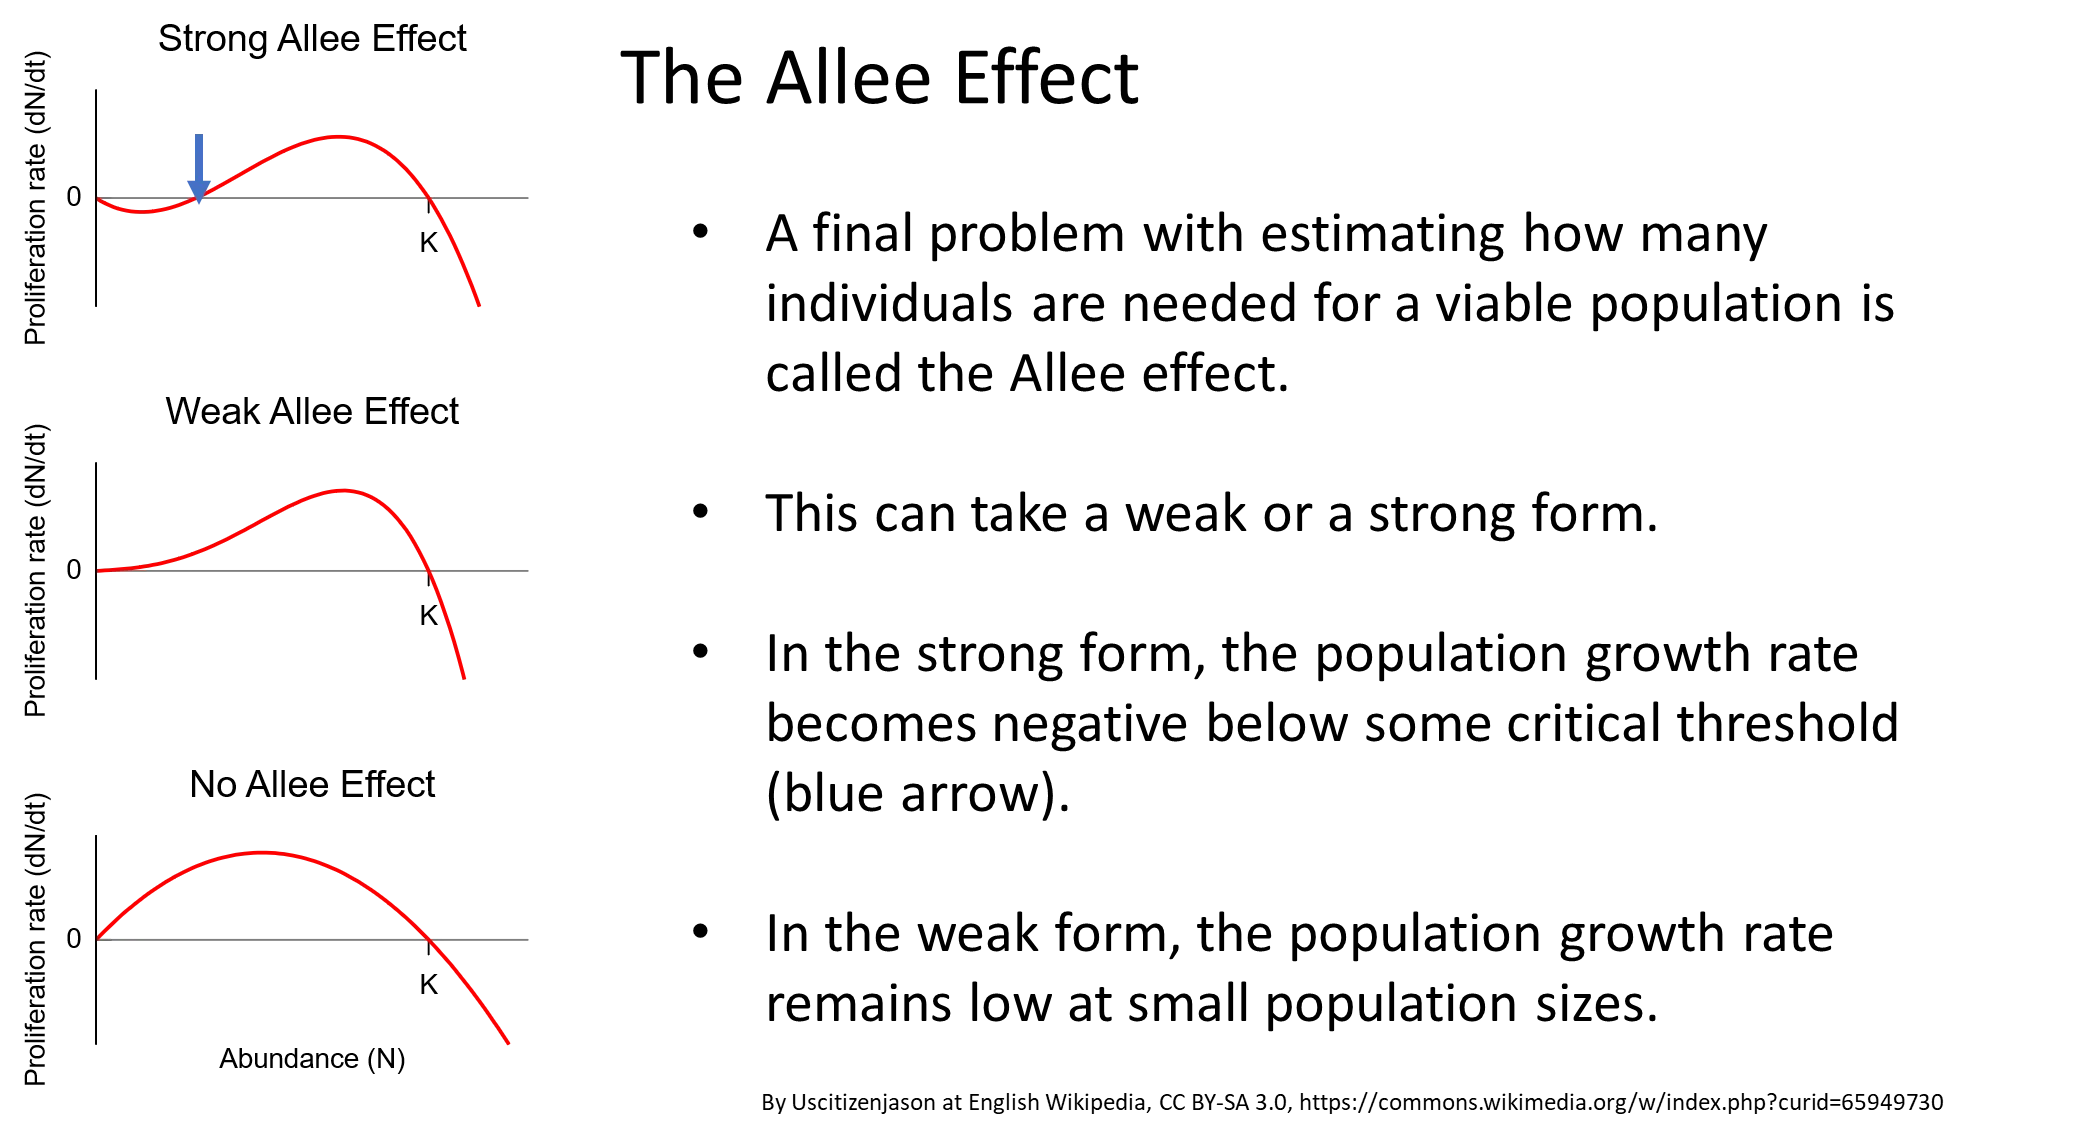
what is the allee effect? give examples
the allee effect states that special, hard to predict problems can occur in small populations, eg:
musk ox- the herd forms a defensive ring around calves to fend off wolves, but when the population becomes too small, they can’t surround the calves properly
african wild dogs- hunting is unsuccessful in small packs because they can’t attack prey that is much larger than they are, like usual
kakapos- females will only be attracted to males when they are in groups
when the allee effect is strong, the proliferation rate decreases, even to the point of causing negative growth rates
describe an example of a k-selected species
the kakapo is a large flightless parrot from new zealand
it is incredibly k-selected because it only breeds every 2-7 years, depending on masting years from its main food source, and adults live for decades
the introduction of mammals and hunting in new zealand devastated the populations
they were thought to have gone extinct, but a small island population was found, and intensive recovery programmes began, yet it is still under threat and vulnerable due to genetic erosion
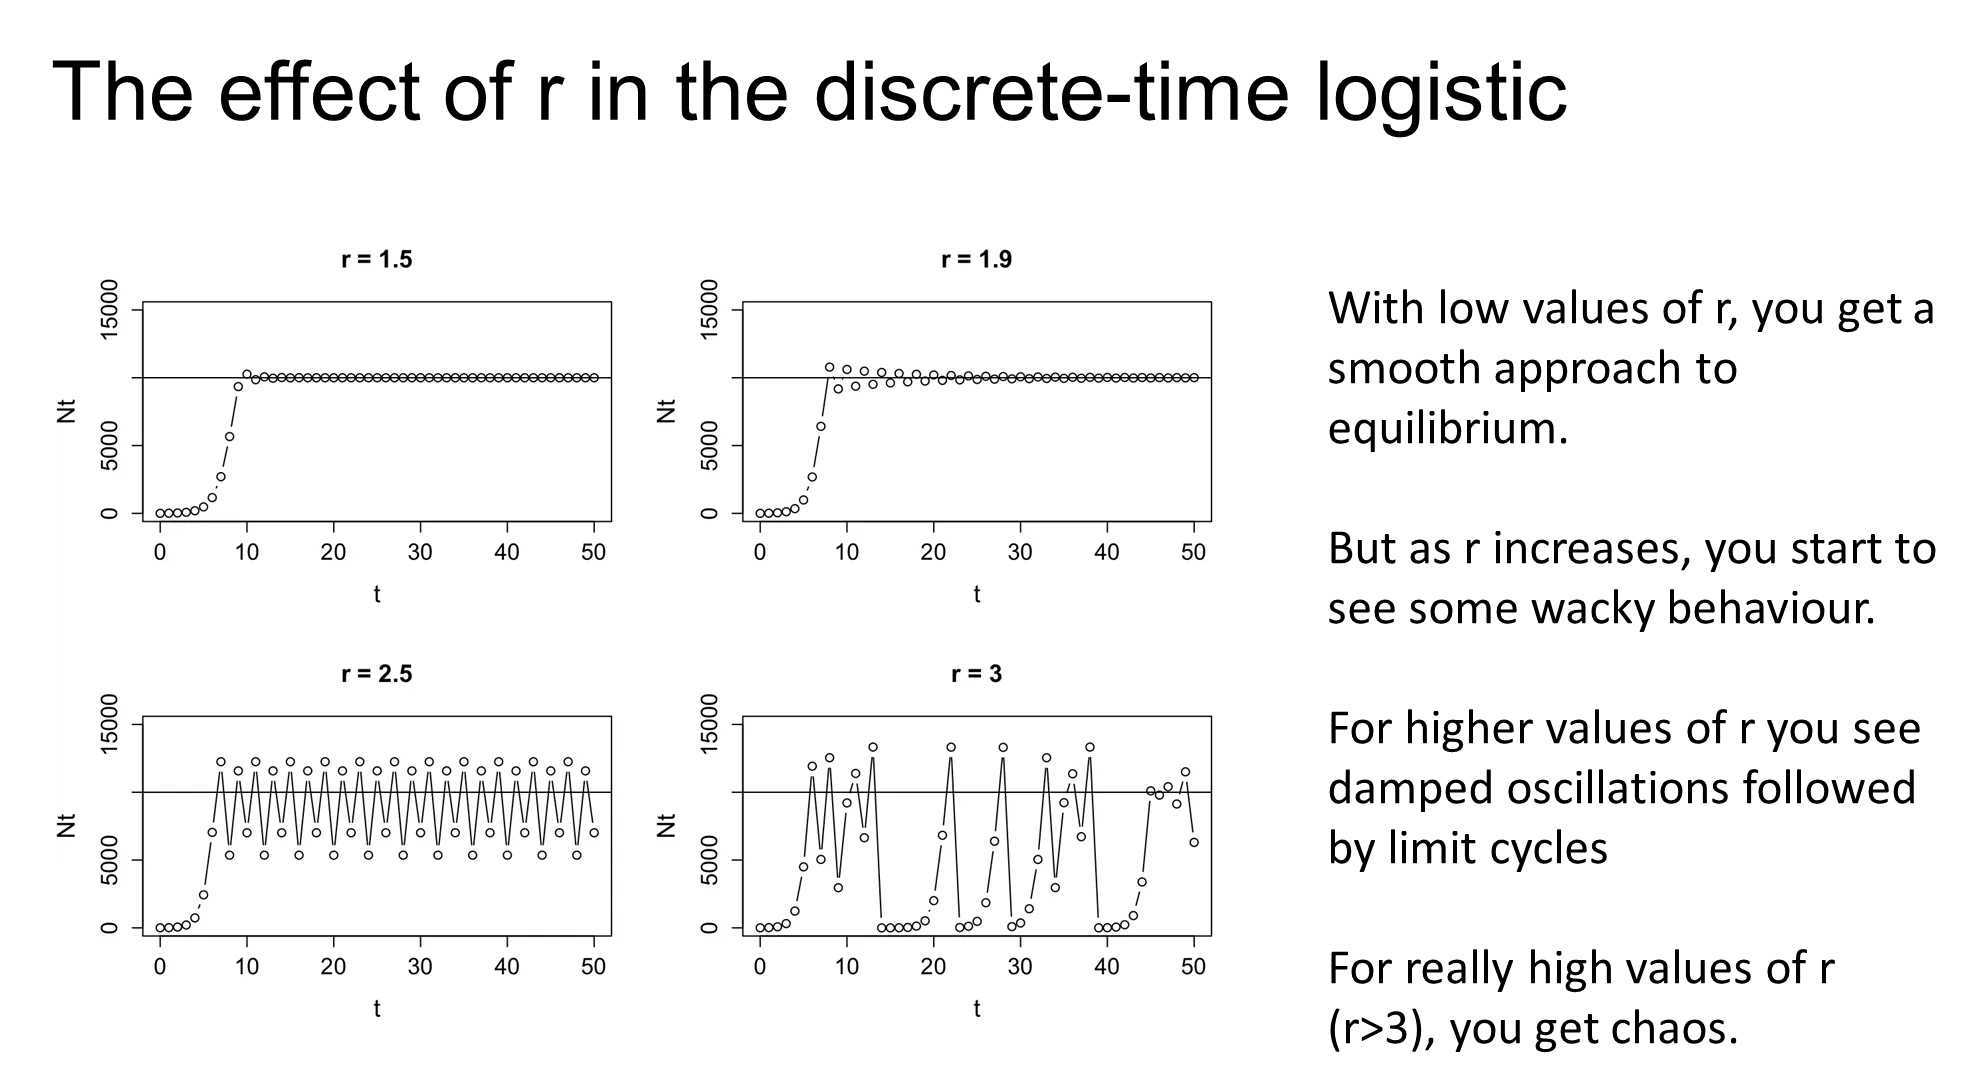
how do high r populations behave in a discrete time logistic model
damped oscillations and limit cycles can happen in high r populations
this is where the population is able to increase above the carrying capacity, which then brings the population right back down
this is overcompensating density-dependence, which can cause catastrophic die offs
in very high r populations, this causes chaos (deterministic not stochastic, but so unpredictable that it appears random)
this may not actually be present in real-life, it is just a phenomenon of the discrete time model