EXST 2201 Lesson 8.3
1/33
There's no tags or description
Looks like no tags are added yet.
Name | Mastery | Learn | Test | Matching | Spaced |
|---|
No study sessions yet.
34 Terms
In the ANOVA method, what is the purpose of the ANOVA table?
a)None of the other answers.
b)To determine if the population means are equal.
c)To determine if the sample averages are equal.
d)To determine if the population variances are equal.
b)To determine if the population means are equal.
In the ANOVA method, how are the assumptions of Randomness and Independence checked to see that they are met?
a)Using the appropriate histogram(s).
b)Using a sum-of-squares table.
c)Calculating the five-number summary and the fences.
d)Checking that the sampling method was appropriate.
d)Checking that the sampling method was appropriate.
In the ANOVA method, how are the assumptions of Normality / Equal Variance checked to see that they are met?
a)Checking the sampling method / Checking the sampling method.
b)Using the Shapiro-Wilk test / Using the Levene’s test.
c)Using the F-test / Using the ANOVA fraction.
d)Using the appropriate histogram(s) / Using a sum-of-squares table.
b)Using the Shapiro-Wilk test / Using the Levene's test.
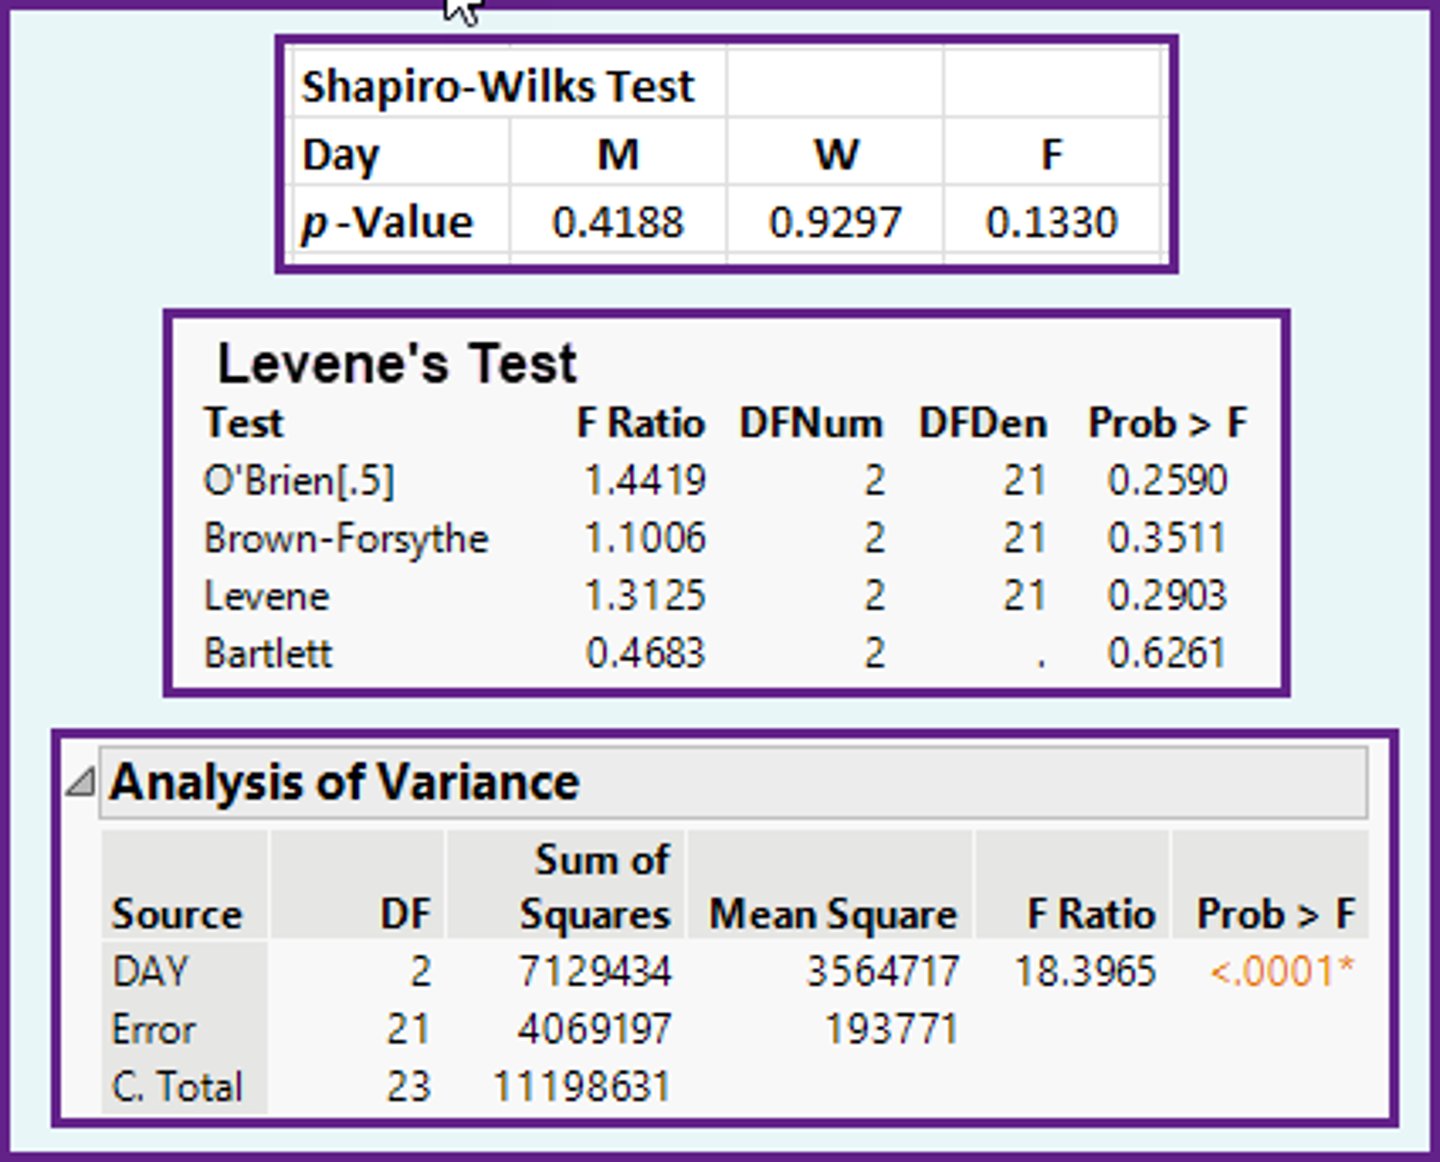
In the ANOVA method, what information does the computer output (shown below) give you?
a)The shape is normal, because 0.418 is greater than 0.05.
b)The shape is normal, because 0.918 is greater than 0.05.
c)The population variances are not equal, because 0.918 is less than 1.0.
d)The population variances are equal, because 0.4188 is greater than 0.05.
a)The shape is normal, because 0.418 is greater than 0.05

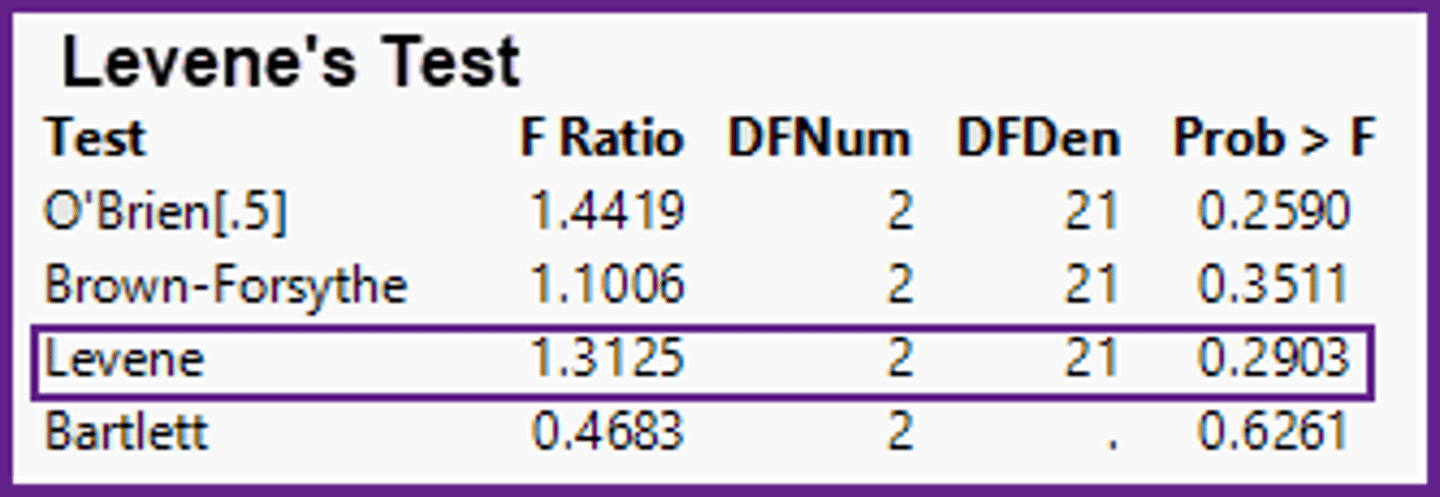
In the ANOVA method, what information does the computer output shown below give you?
a)The shape is normal, because 0.2903 is less than 1.3125.
b)The population variances are not equal, because 1.3125 is greater than 1.0.
c)The population variances are equal, because 0.2903 is greater than 0.05.
d)The shape is normal, because 0.2903 is greater than 0.05.
c)The population variances are equal, because 0.2903 is greater than 0.05.
In the ANOVA table, the bottom row is a check row for the degrees of freedom and the sum-of-squares? What information about spread is given in Row 1 / Row 2?
a)None of the other answers.
b)About the sample averages / About the data values.
c)About the largest sample variance / About the smallest sample variance.
d)About the sample variance / About the pooled sample variance.
b)About the sample averages / About the data values.
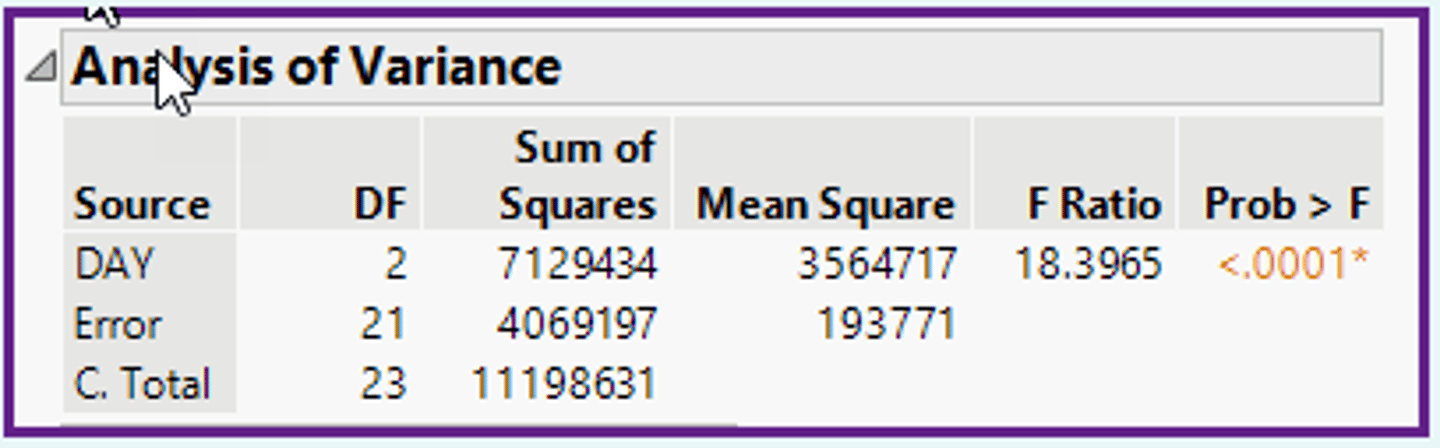
In the ANOVA table (shown below), what information is given in the Degrees of Freedom column?
a)Two of these other answers.
b)The units of information in each row.
c)The number of data values in each row.
d)The amount of spread in each row.
b)The units of information in each row.
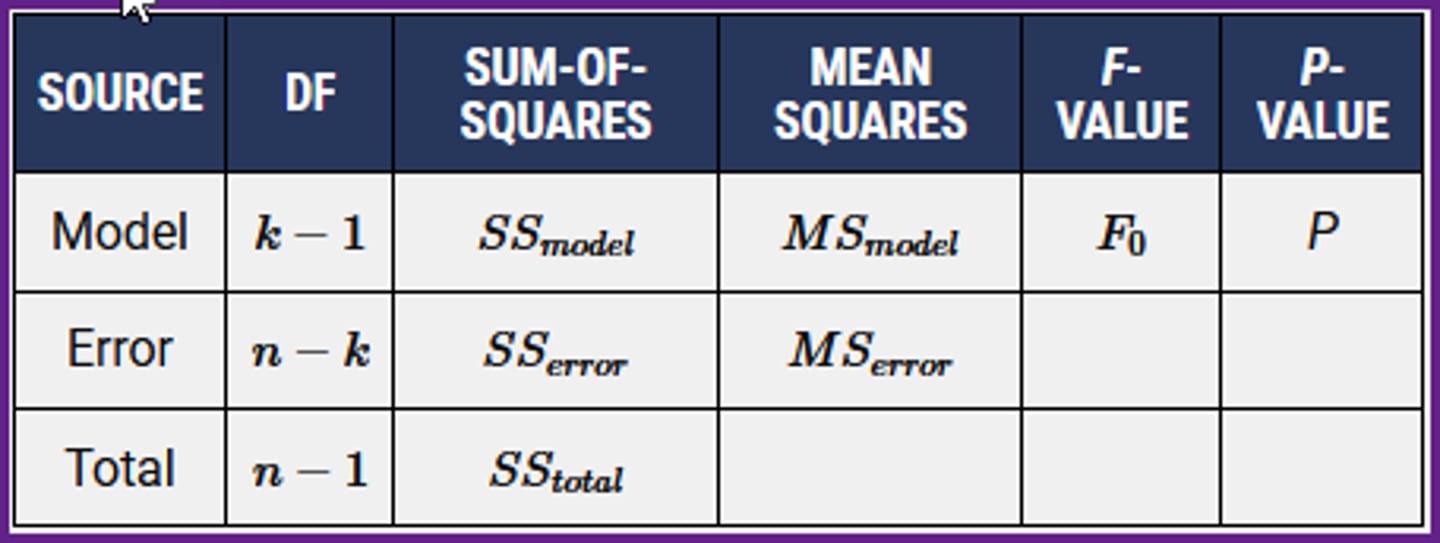
In the ANOVA table (shown below), which column gives the raw measure of spread / the standardized measure of spread, for each row?
a)The Sum-of-Squares / The Mean Squares.
b)The Mean Squares / The Sum-of-Squares.
c)The F-Value / The P-Value.
d)The Model / The Error.
a)The Sum-of-Squares / The Mean Squares.

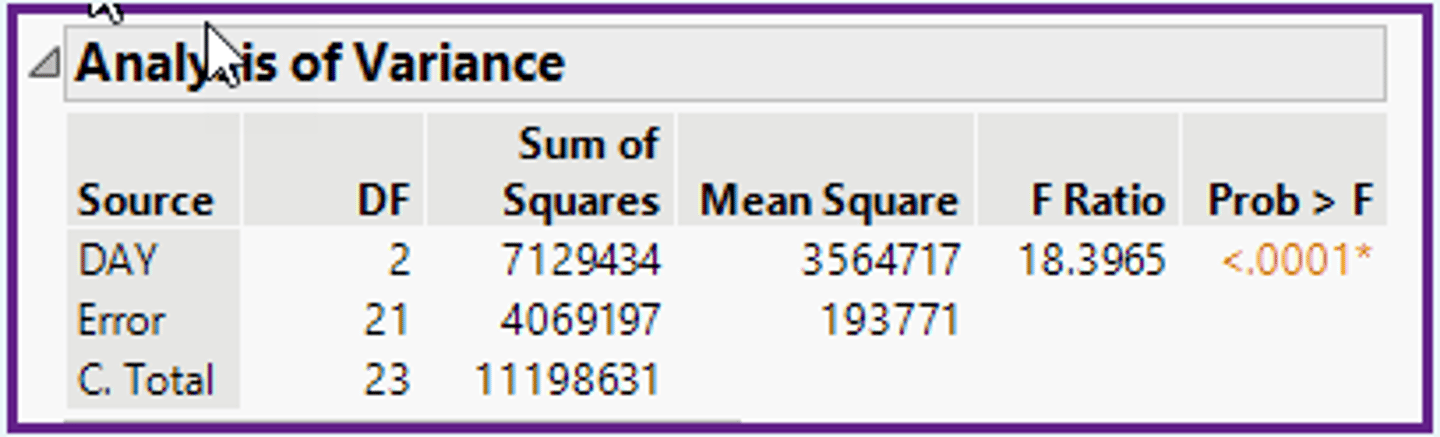
In the ANOVA table (shown below), what is the value of the F-Ratio?
a)F0 = 18.40.
b)F0 = 18.13.
c)F0 = 190.32.
d)F0 = 1.75.
b)F0 = 18.13.
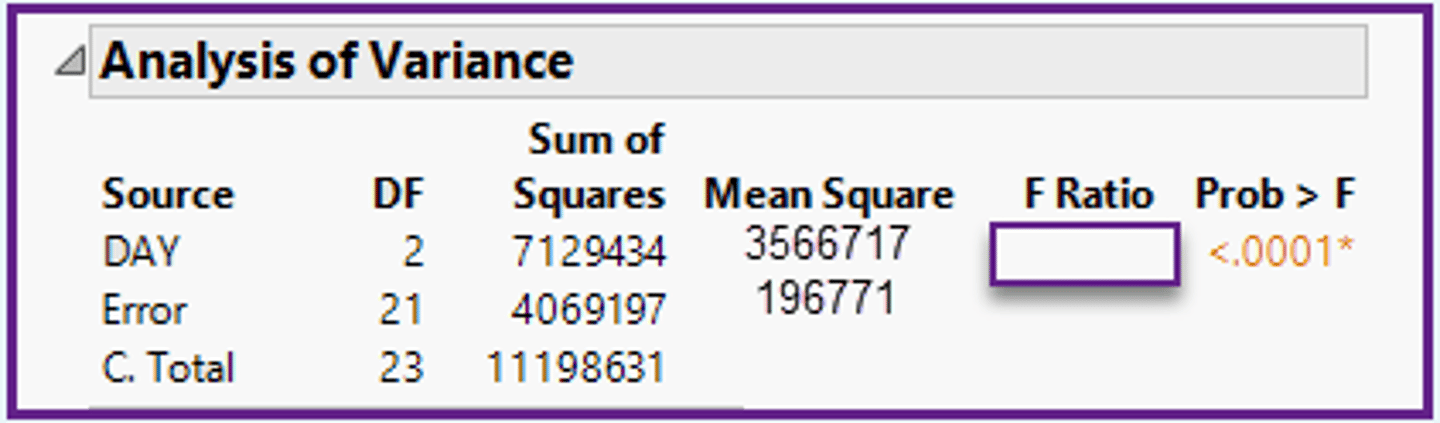
In the ANOVA table (shown below), are the degrees of freedom correct for a situation with three populations and ten data values from each population?
a)Yes, because the degrees of freedom are correct.
b)Yes, because the DF check is met (2+21 = 23).
c)Unknown, because this table does not have that information.
d)No, because the values should be DFerror = 27 and DFc total = 29
d)No, because the values should be DFerror = 27 and DFc total = 29
In the ANOVA table (shown below), how many different population means are indicated?
a)One population mean.
b)More than one population mean.
c)Three or less population means.
d)One or more population means.
b)More than one population mean.
In the ANOVA method, what is the purpose of the Tukey table?
a)To determine if all the population means are equal.
b)To determine which population means are not equal.
c)To calculate the differences between the sample averages.
d)To rank the population means from highest to lowest.
b)To determine which population means are not equal.
In the ANOVA method, how are the sample averages arranged in the Tukey table?
a)In the order in the dataset.
b)In alphabetical order by population name.
c)From highest to lowest.
d)From lowest to highest.
c)From highest to lowest.
In the ANOVA method, how does the Tukey table determine if two population means are equal?
a)The difference in the two sample averages is a positive value.
b)The difference in the two sample averages is greater than the MSD.
c)The difference in the two sample averages is less than the MSD.
d)The difference in the two sample averages equals the MSD.
c)The difference in the two sample averages is less than the MSD.
In the ANOVA method, how many population means are indicated in the Tukey table shown below?
a)One population mean.
b)Three or less population means.
c)Two population means.
d)More than one population mean.
a)One population mean.
In the ANOVA table, which are the two assumptions about the sample data values / about the populations?
a)Randomness and Equal Variance / Independence and Normality.
b)Independence and Normality / Randomness and Equal Variance.
c)Randomness and Independence / Normality and Equal Variance.
d)Randomness and Normality / Independence and Equal Variance.
c)Randomness and Independence / Normality and Equal Variance.
What was the original purpose of the ANOVA table?
a)To make it easy to calculate the F0 test statistic by hand.
b)To present the ANOVA information in a computer output.
c)It was the form required in research papers.
d)To list the values of all the components in the F-test.
a)To make it easy to calculate the F0 test statistic by hand.
In the ANOVA table, the conceptual ANOVA fraction is shown below. How is this fraction modified to a mathematically equivalent form that is used in the ANOVA table?
S2xs2pn
a)Multiply by n/n.
b)Divide by n .
c)Multiply by 1/n.
d)Multiply by n.
a)Multiply by n/n.
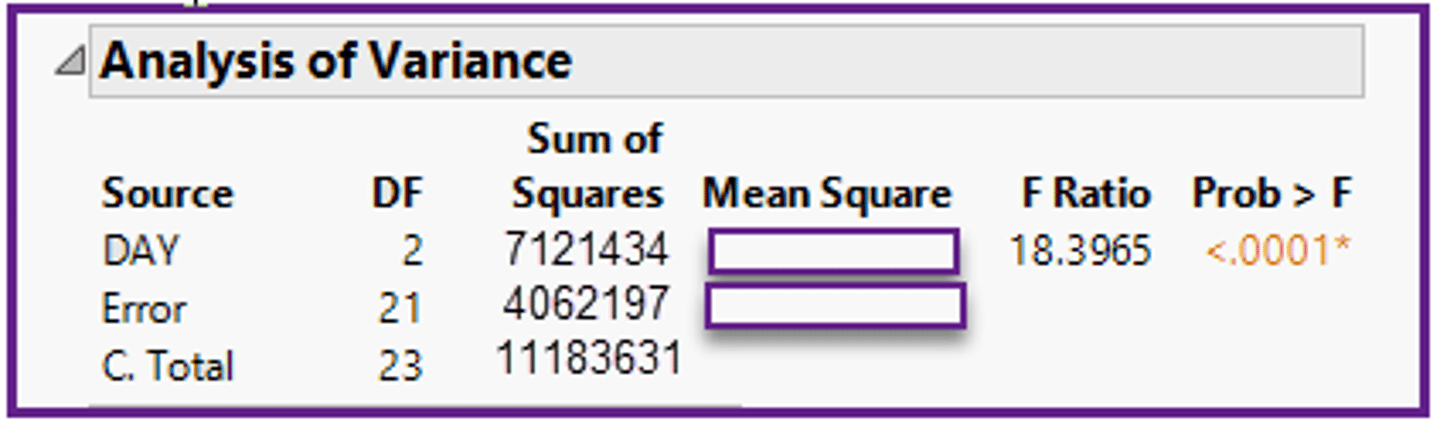
In the ANOVA table shown below, what is the value of the mean square DAY / mean square Error?
a)MSday = 4,062,197 / MSerror = 7,121,434.
b)MSday = 14,242,868 / MSerror = 85,306,137.
c)MSday = 36.8 / MSerror = 386.3.
d)MSday = 3,560,717 / MSerror = 193,438.
d)MSday = 3,560,717 / MSerror = 193,438.

In the ANOVA table (example below), what do the words Mean Square stand for?
a)The amount of information contained in each row.
b)An average sum-of-squares for each row.
c)A raw measure of spread for each row.
d)A variance (sum-of-squares/degrees of freedom) for each row.
d)A variance (sum-of-squares/degrees of freedom) for each row.

In the ANOVA table shown below, what is the value of the Sum-of-Squares DAY / sum-of-squares Error?
a)SSday = 1,782,358 / SSerror = 9,227.
b)SSday = 36.8 / SSerror = 386.3.
c)SSday = 7,129,434 / SSerror = 4,069,197.
d)SSday = 973,794 / SSerror = 10,224,837.
c)SSday = 7,129,434 / SSerror = 4,069,197.
In the ANOVA table shown below, should the population variances be considered equal?
a)No, because the p-value (<0.0001) is less than alpha (0.05).
b)Cannot tell because the ANOVA table tests for means, not for variances.
c)No , because the MSday (3,564,717) is greater than MSerror (193,771).
d)No, because only sample variances are in the ANOVA table.
b)Cannot tell because the ANOVA table tests for means, not for variances.
In the ANOVA method, does the Tukey table provide new information when the null hypothesis in the ANOVA table is NOT rejected?
a)No, because the Tukey table always gives the same information as the ANOVA table.
b)Yes, the Tukey table gives new information about the population means.
c)No, because the Tukey table should have only one letter.
d)Yes, any additional statistical test gives more information.
c)No, because the Tukey table should have only one letter.
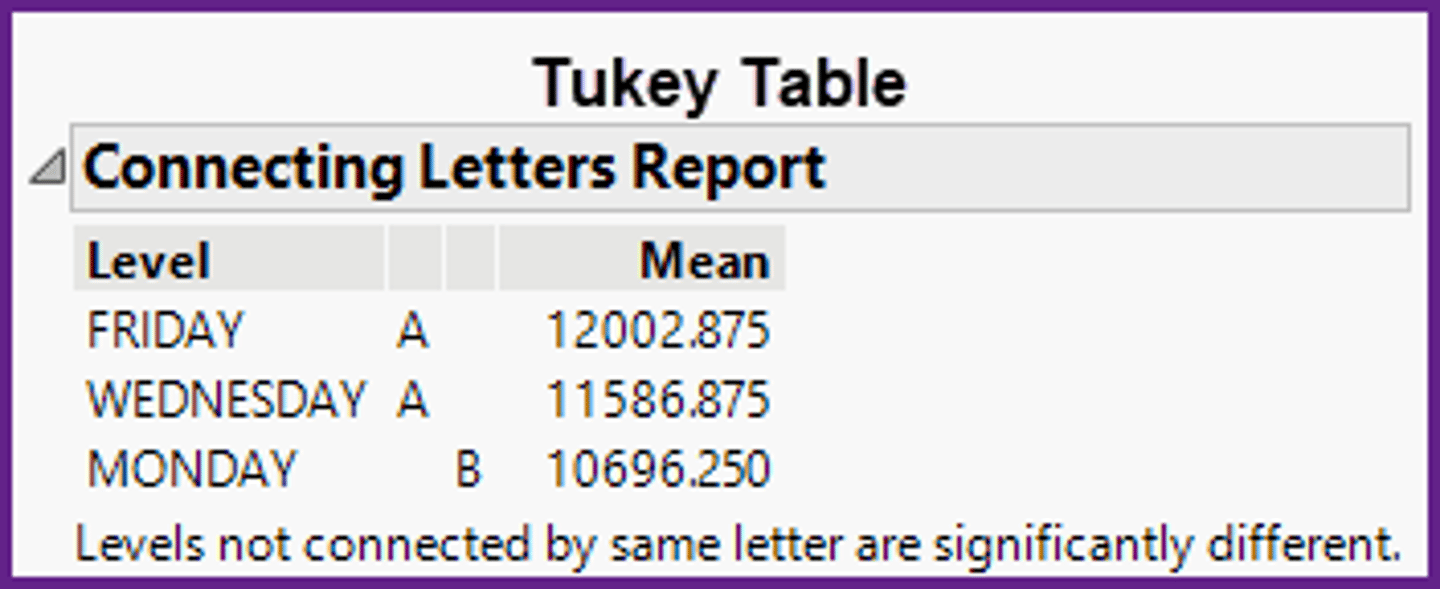
In the ANOVA method, in the Tukey table shown below, what is the appropriate relationship between the values of the population means?
a)None of the population means are equal.
b)The Friday and Monday population means are equal.
c)The Friday, Wednesday, and Monday population means are equal.
d)The Friday and Wednesday population means are equal. The Monday population mean is less.
d)The Friday and Wednesday population means are equal. The Monday population mean is less.
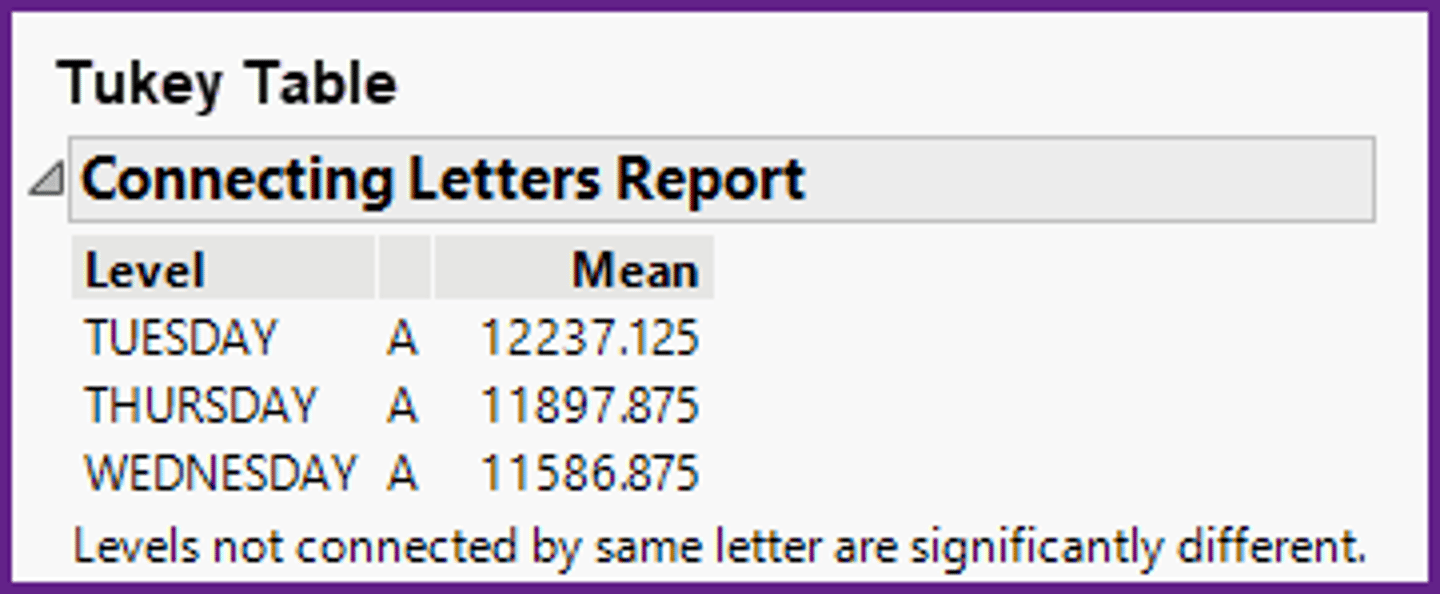
In the ANOVA method, in the Tukey table shown below, what is the appropriate relationship between the values of the population means?
a)None of the population means are equal.
b)The Tuesday, Thursday, and Wednesday population means are equal.
c)The Tuesday and Wednesday population means are not equal.
d)The Friday and Thursday population means are equal. The Wednesday population mean is less.
b)The Tuesday, Thursday, and Wednesday population means are equal.
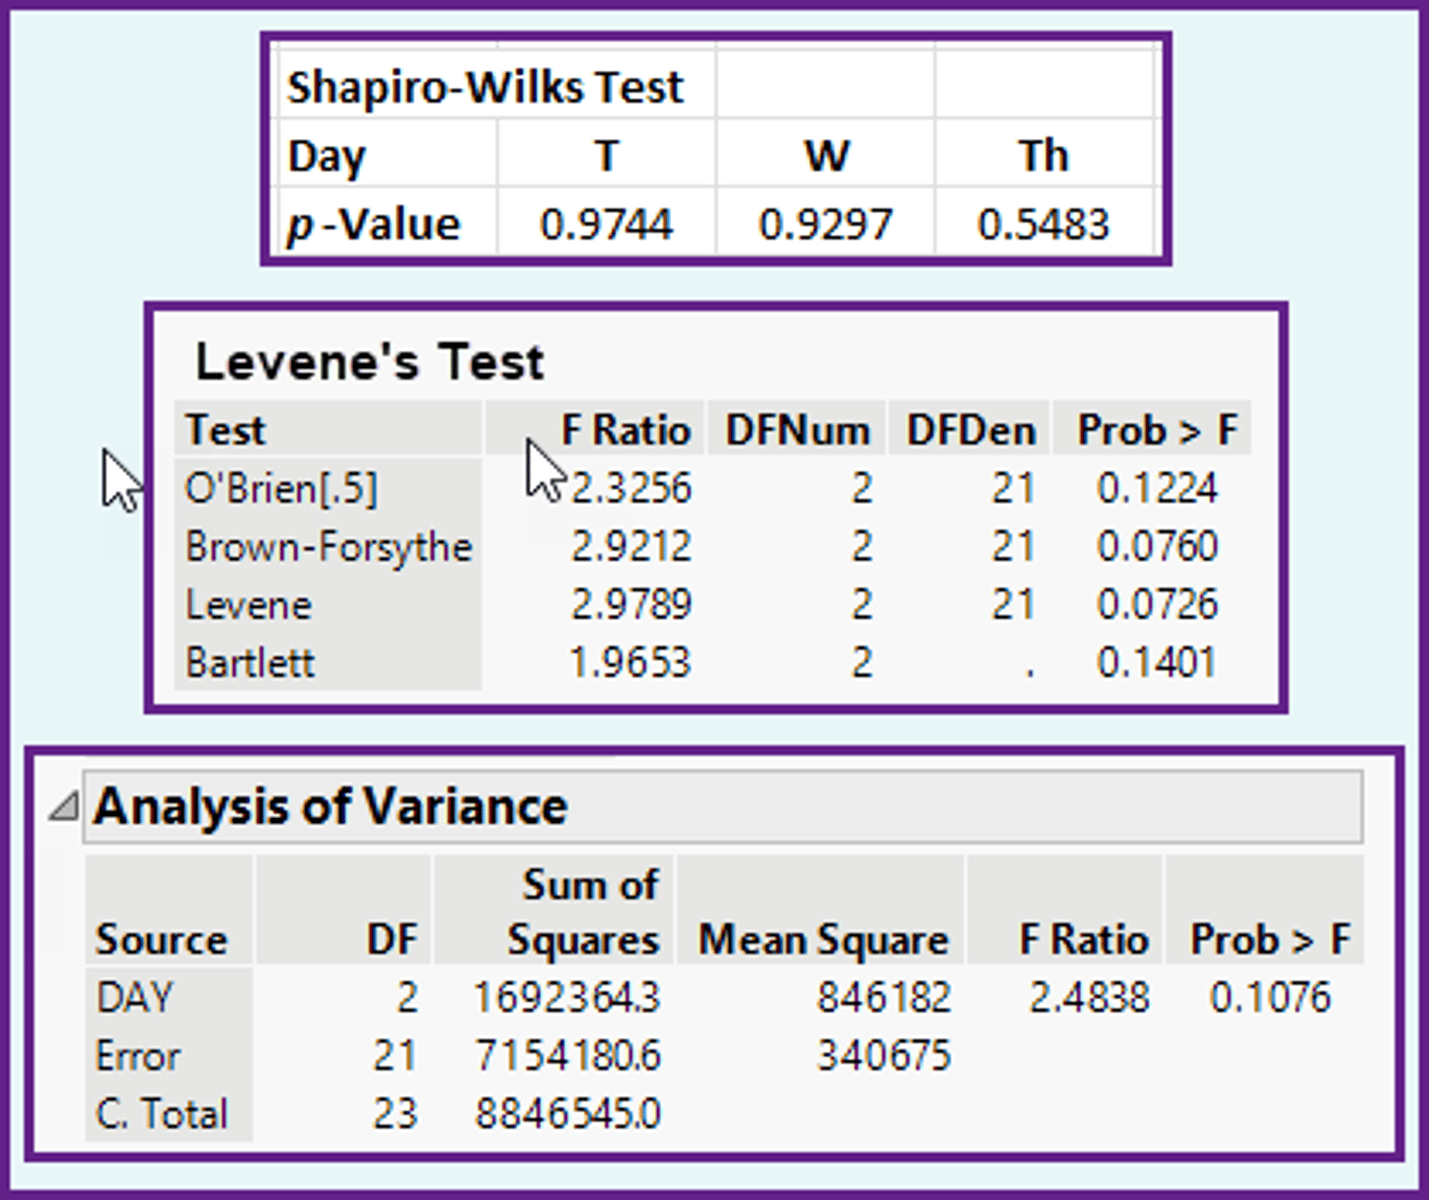
In the ANOVA method, using the computer output shown below, are the assumptions of Normality and Equal Variance met?
a)No for Normality, No for Equal Variance.
b)Yes for Normality, Yes for Equal Variance.
c)No for Normality, Yes for Equal Variance.
d)Yes for Normality, No for Equal Variance.
b)Yes for Normality, Yes for Equal Variance.
In the ANOVA method, using the computer output shown below, what is the appropriate relationship between the population means?
a)Two of the population means are equal, and one is less.
b)The population means are not all equal.
c)None of the population means are equal.
d)The population means are all equal.
b)The population means are not all equal.
In the ANOVA method, using the computer output shown below, what is the appropriate relationship between the population means?
a)Friday = Wednesday = Monday.
b)Friday = Wednesday > Monday.
c)Friday = Monday < Wednesday.
d)Friday > Wednesday > Monday.
b)Friday = Wednesday > Monday.
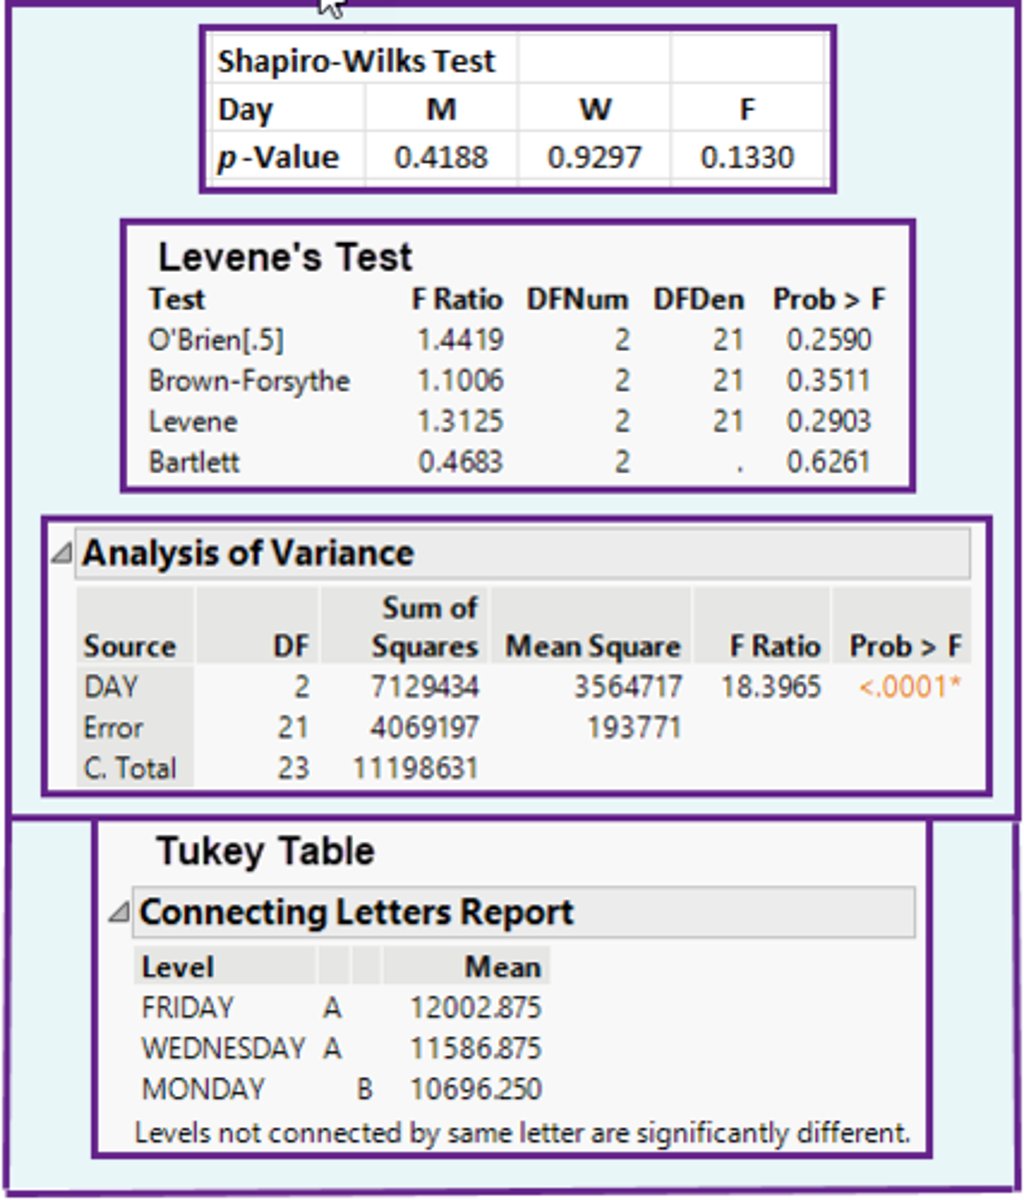
In the ANOVA method, using the computer output shown below, are the assumptions of Normality and Equal Variance met?
a)Yes for Normality, Yes for Equal Variance.
b)Yes for Normality, No for Equal Variance.
c)No for Normality, Yes for Equal Variance.
d)No for Normality, No for Equal Variance.
a)Yes for Normality, Yes for Equal Variance.

In the ANOVA method, using the computer output shown below, what is the appropriate relationship between the population means?
a)The population means are not all equal.
b)Two of the population means are equal, and one is less.
c)The population means are all equal.
d)None of the population means are equal.
c)The population means are all equal.
In the ANOVA method, using the computer output shown below, what is the appropriate relationship between the population means?
a)Tuesday = Thursday > Wednesday.
b)Tuesday = Wednesday > Thursday.
c)Tuesday > Thursday > Wednesday.
d)Tuesday = Thursday = Wednesday.
d)Tuesday = Thursday = Wednesday.
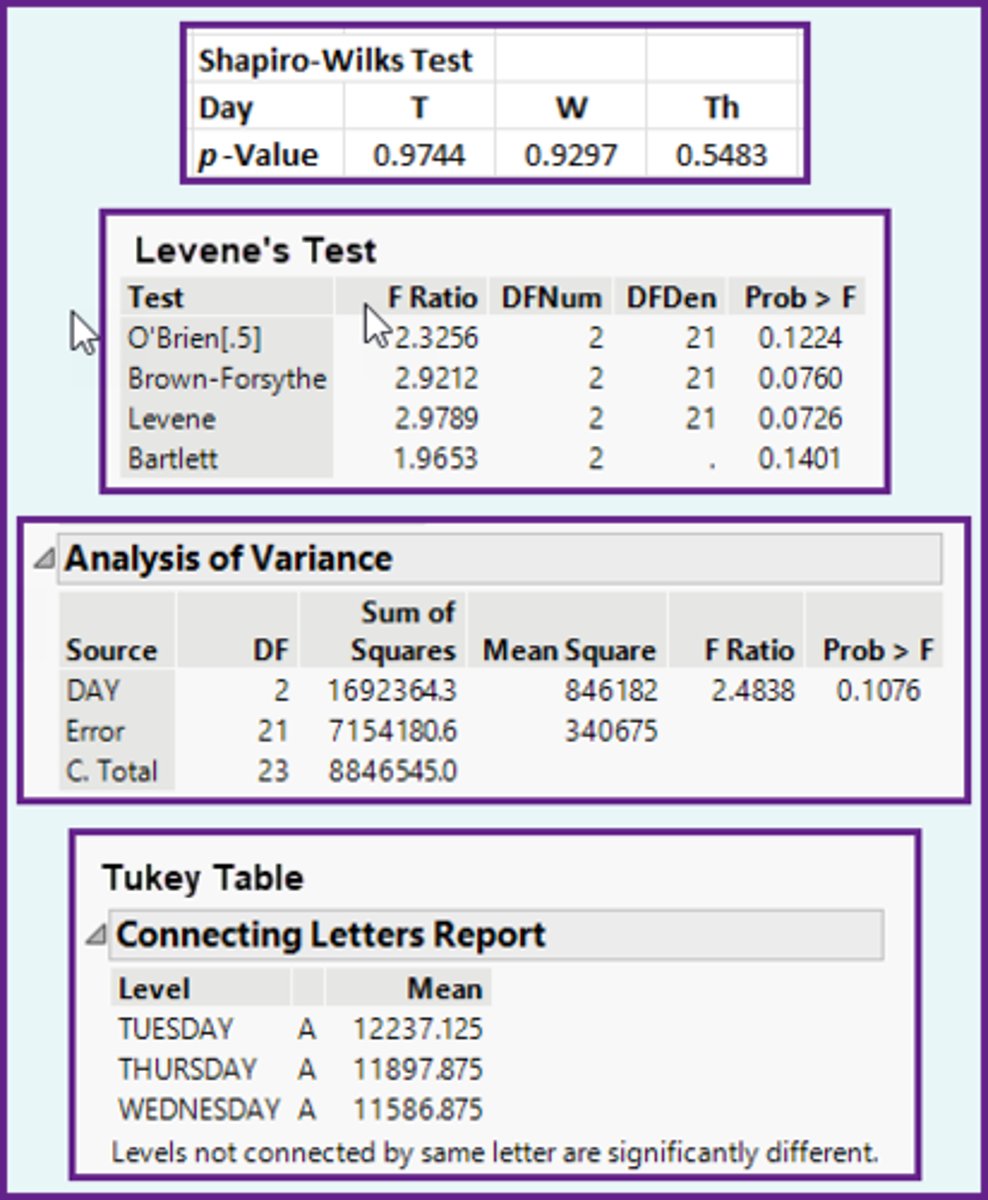
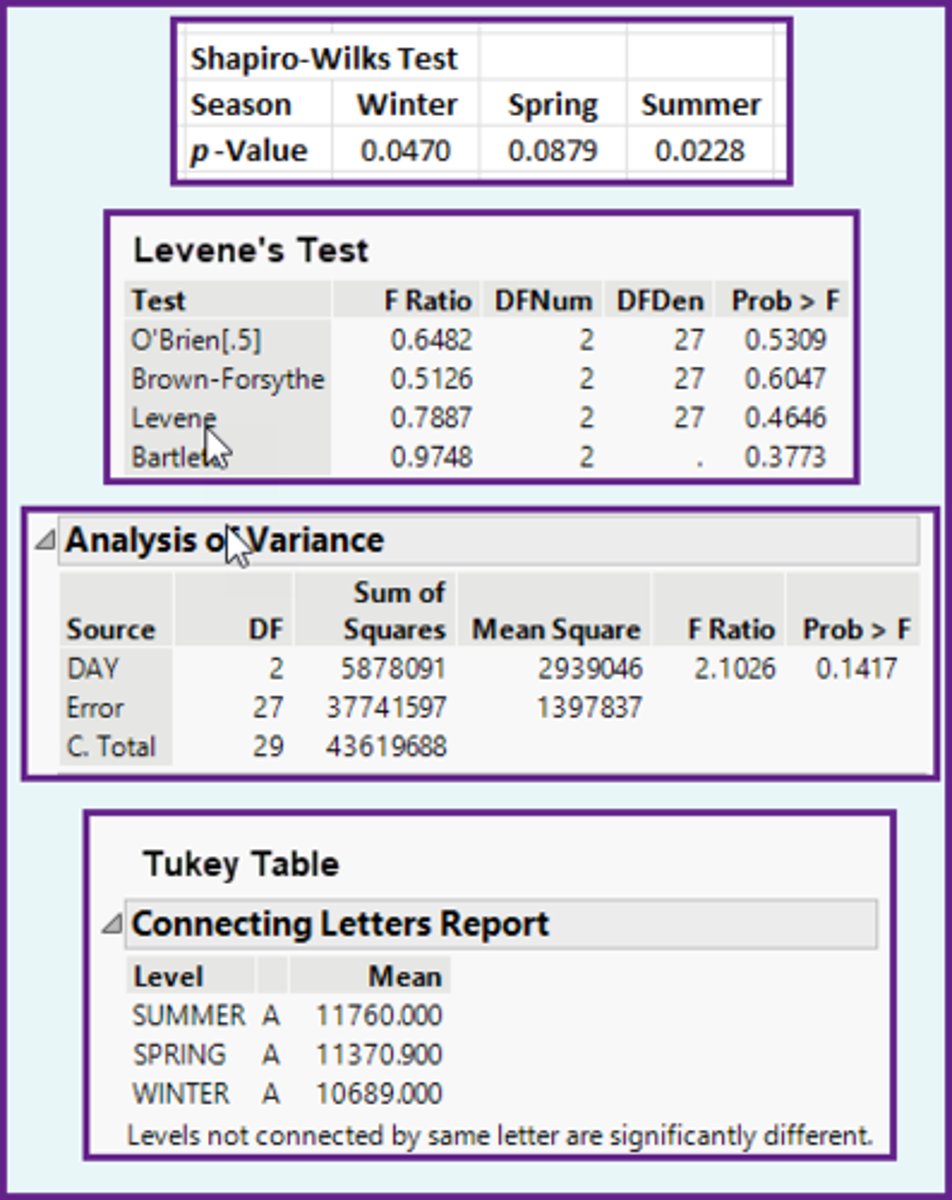
In the ANOVA method, using the computer output shown below, are the assumptions of Normality and Equal Variance met?
a)No for Normality, No for Equal Variance.
b)No for Normality, Yes for Equal Variance.
c)Yes for Normality, Yes for Equal Variance.
d)Yes for Normality, No for Equal Variance.
b)No for Normality, Yes for Equal Variance.

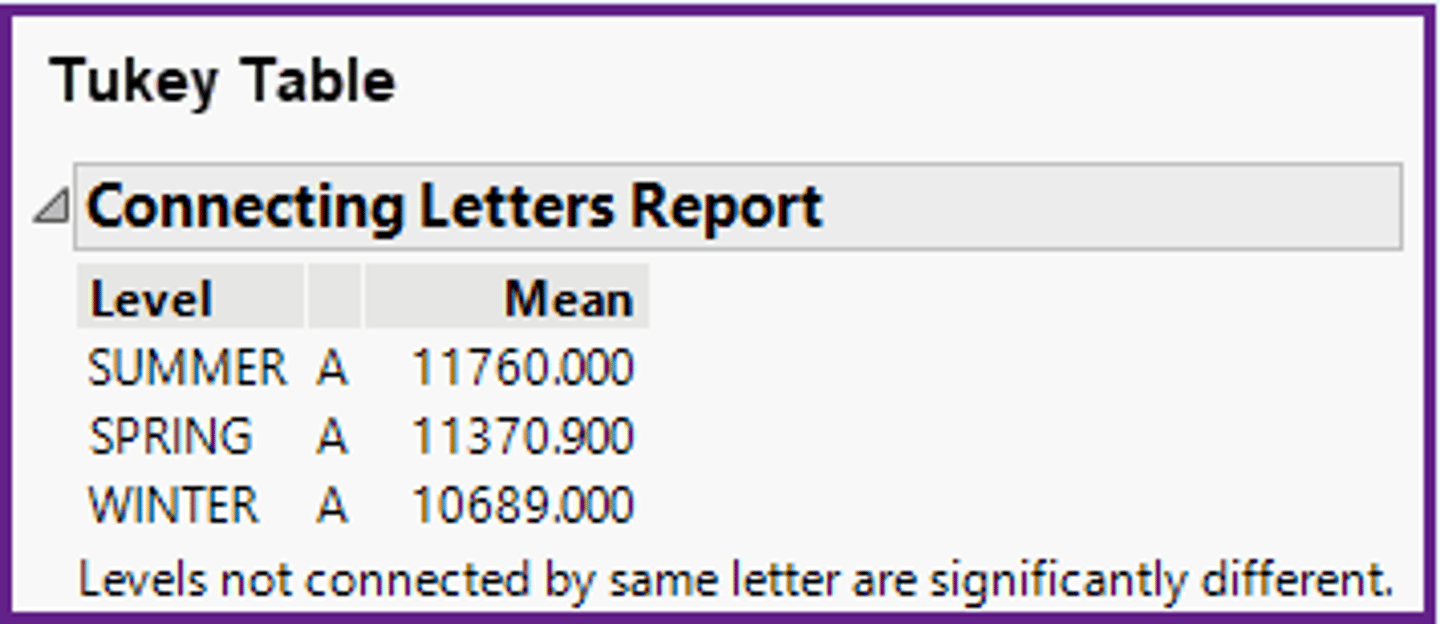
In the ANOVA method, using the computer output shown below, what is the appropriate relationship between the population means?
a)None of the population means are equal.
b)The population means are all equal.
c)The population means are not all equal.
d)Two of the population means are equal, and one is less.
b)The population means are all equal.
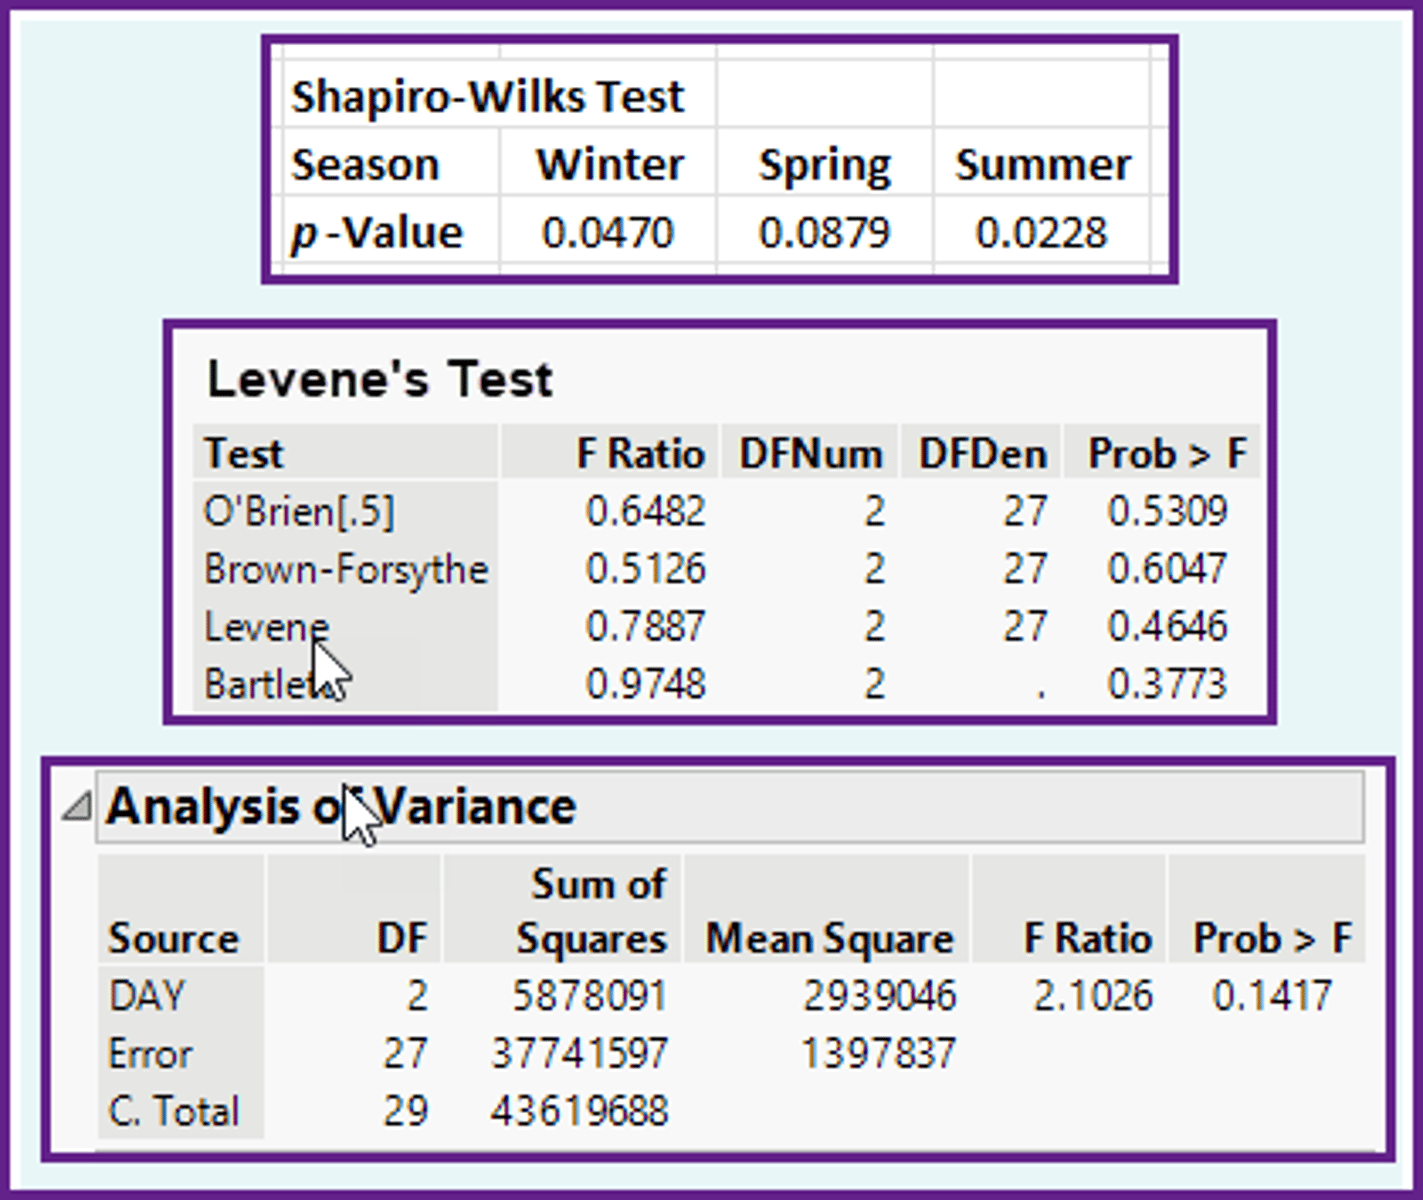
In the ANOVA method, using the computer output shown below, what is the appropriate relationship between the population means?
a)Summer > Spring > Winter.
b)Summer = Spring = Winter.
c)Summer = Spring > Winter.
d)Summer = Winter > Spring.
b)Summer = Spring = Winter.