DAPAB W5L1: Effect of genes
1/23
There's no tags or description
Looks like no tags are added yet.
Name | Mastery | Learn | Test | Matching | Spaced | Call with Kai |
|---|
No analytics yet
Send a link to your students to track their progress
24 Terms
Mendelians
Genetic basis of single gene traits
Biometricians
Inheritance of polygenic traits (regression)
Modern synthesis
Integration of mendialian school and biometricians
The problem of complex traits: many genes have a tiny effect
E.g. accurate genomic prediction of human height
50.000 individuals in the data, 20.000 SNPs affected height, together they explain at most the full variance → most SNPs must have a tiny effect
Why do we want to detect genes?
Human medicine
Easier genetic improvement
Gene based selection
Selection across populations
- genomic prediction works well only within populations
Introregression (plants)
Design optimum genotypes that nature does not provide (e.g. CRISPR)
Provides fundamental knowledge
How do genes determine phenotype
Consequences of selection
Marker
Observerable (known) variant in the genome
SNiP
Single Nucleotide Polymorphism, bi-allelic marker
Genotyping
Determining the markers of an individual
Sequencing
Determining hte code of all DNA of an individuals (or species)
MAP
The whole set of markers of a species, ordered by chromosome and position
Physical map
Map of the genome of a species, with distance expressed in (kilo) bases
Genetic map
Genetic map is similar to physical map (Map of the genome of a species, with distance expressed in (kilo) bases), but with distance expressed in recombination units (cM = centimorgan) (linkage or recombination map)
Mapping
Determining the location of a variant on the genome
(marker) mapping
making a mpa of the genome with markers as landmarks
QTL
Quantitative trait locus: a variant that affects a quantitative trait (true effect)
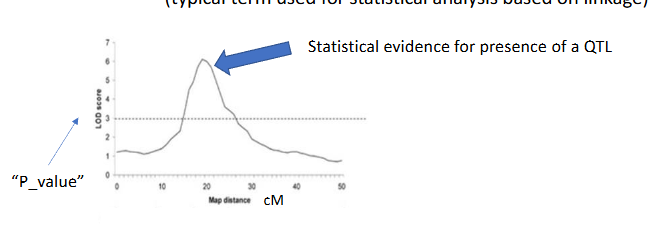
QTL - mapping
(trying to) find the loci that affect a quantitative trait (the QTL) typical term used for statistical analysis based on linkage)
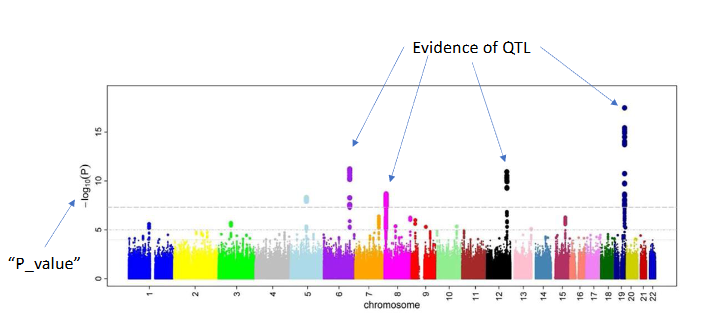
GWAS
Genome wide association study
Method to find QTL based on linkage disequilibrium (association)
Typically covering the entire genome, with many markers
Manhattan plot
The result of a GWAS
Genotypic value (G)
The (true) mean phenotypic value of individuals with a certain genotype
The expectation of the phenotypic value given the genotype
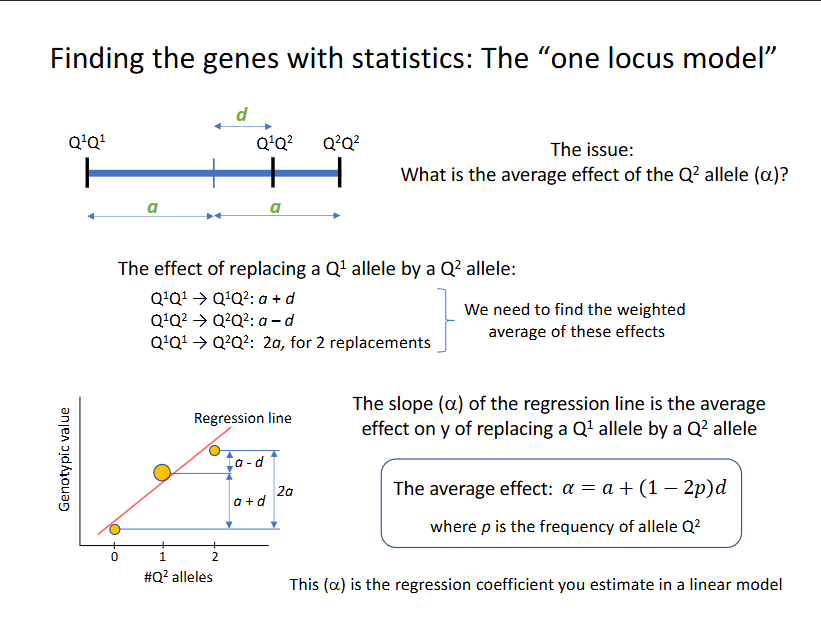
Model for a single locus
Three genotypic values: Gq1q1, Gq1q2, Gq2q2; one for each genotype
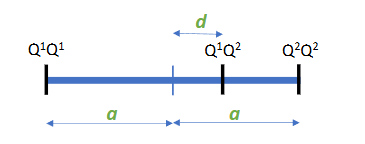
Additive effect (a)
half the difference between both homozygotes
(strictly speaking, a is the additive effect of the Q2 allele, -a is the additive effect for the Q1 allele)

Dominance effect (d)
Deviation of the heterozygote from the mean of both homozygotes

Finding the genes with statistics: the one locus model
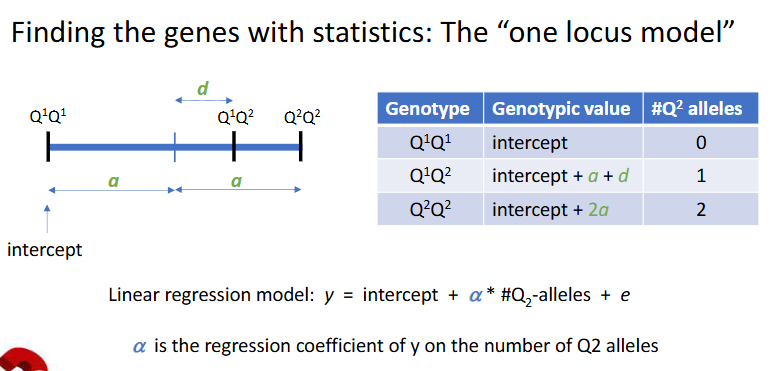
What ist he average (main) effect of the Q2 allele, the a?
LM: y = intercept + a*#Q2-alleles + e