Accounting Information Systems Exam 2
1/74
There's no tags or description
Looks like no tags are added yet.
Name | Mastery | Learn | Test | Matching | Spaced | Call with Kai |
|---|
No analytics yet
Send a link to your students to track their progress
75 Terms
Database Management System (DBMS)
a software program that manages and regulates the data, as well as the communication between the data and the application programs that access the data stored in the database.
Database System
The database, the DBMS, and the application programs that access the database through the DBMS
Data Warehouse
One or more very large databases containing both detailed and summarized data from various sources that are used for analytical processing rather than transaction processing
allows the online transaction processing database to process 1 million+ transactions per minute
Business Intelligence
Analyzing large amounts of data for strategic decision making
- Two main business intelligence techniques: Online analytical processing and data mining
Online Analytical Processing
Using queries to investigate hypothesized relationships among data
one of the two main techniques used in business intelligence
Ex: manager may review supplier purhcases for past 3 years, followed by additional queries that drill down to see prucases by item number and by fiscal period
Data mining
uses advanced statistical analysis, including AI techniques such as neural networks, to identify non hypothesized relationships in the data
ex: credit card companies use data mining to identify usage patterns that may indicate fraud, and to identify relationships in sales data that can be sued for future promotions
Advantages of database systems
Data integration - previously separate application files are combines into large pools of data that can be accessed by multiple application programs, such as an employee database that combines payroll, personnel, and job skills files
Data sharing - integrated data can be easily shared with authorized users through centralized data storage, making it easy to research a problem or obtain detailed information from a report
Minimal data redundancy and data inconsistencies - by storing data items only once, data redundancy and data inconsistencies are minimized
Data independence - programs and data are independent of each other, allowing each to be changed without affecting the other, which simplifies programming and data management
Cross-functinoal analysis - relationships, such as the connection between selling costs and promotional campaigns, can be defined and used in management reports
Logical View vs. physical view
logical view = how people actually conceptually organize and understand the relationships among data items
ex: a sales manager views all customer information as being stored in a table
physical view = refers to the way data are physically arranged and stored in the computer system
Schemas definition
a description of the data elements in a database, the relationships among them, and the logical model used to organize and describe the data
Think of a schema as the architectural drawing for a building: it shows where the walls (tables), rooms (records), and plumbing (connections) go, but it isn't the furniture inside.
The three levels of schemas
the external-level schema = a user’s logical view of their portion of a database as noted, each of which is referred to as a subschema
conceptual-level schema = the organization-wide view of the entire database, lists all data elements and the relationships among them
Internal-level schema = includes detailed view of the database, describes how the data are stored and accessed, including record layouts, definitions, addresses, and indexes
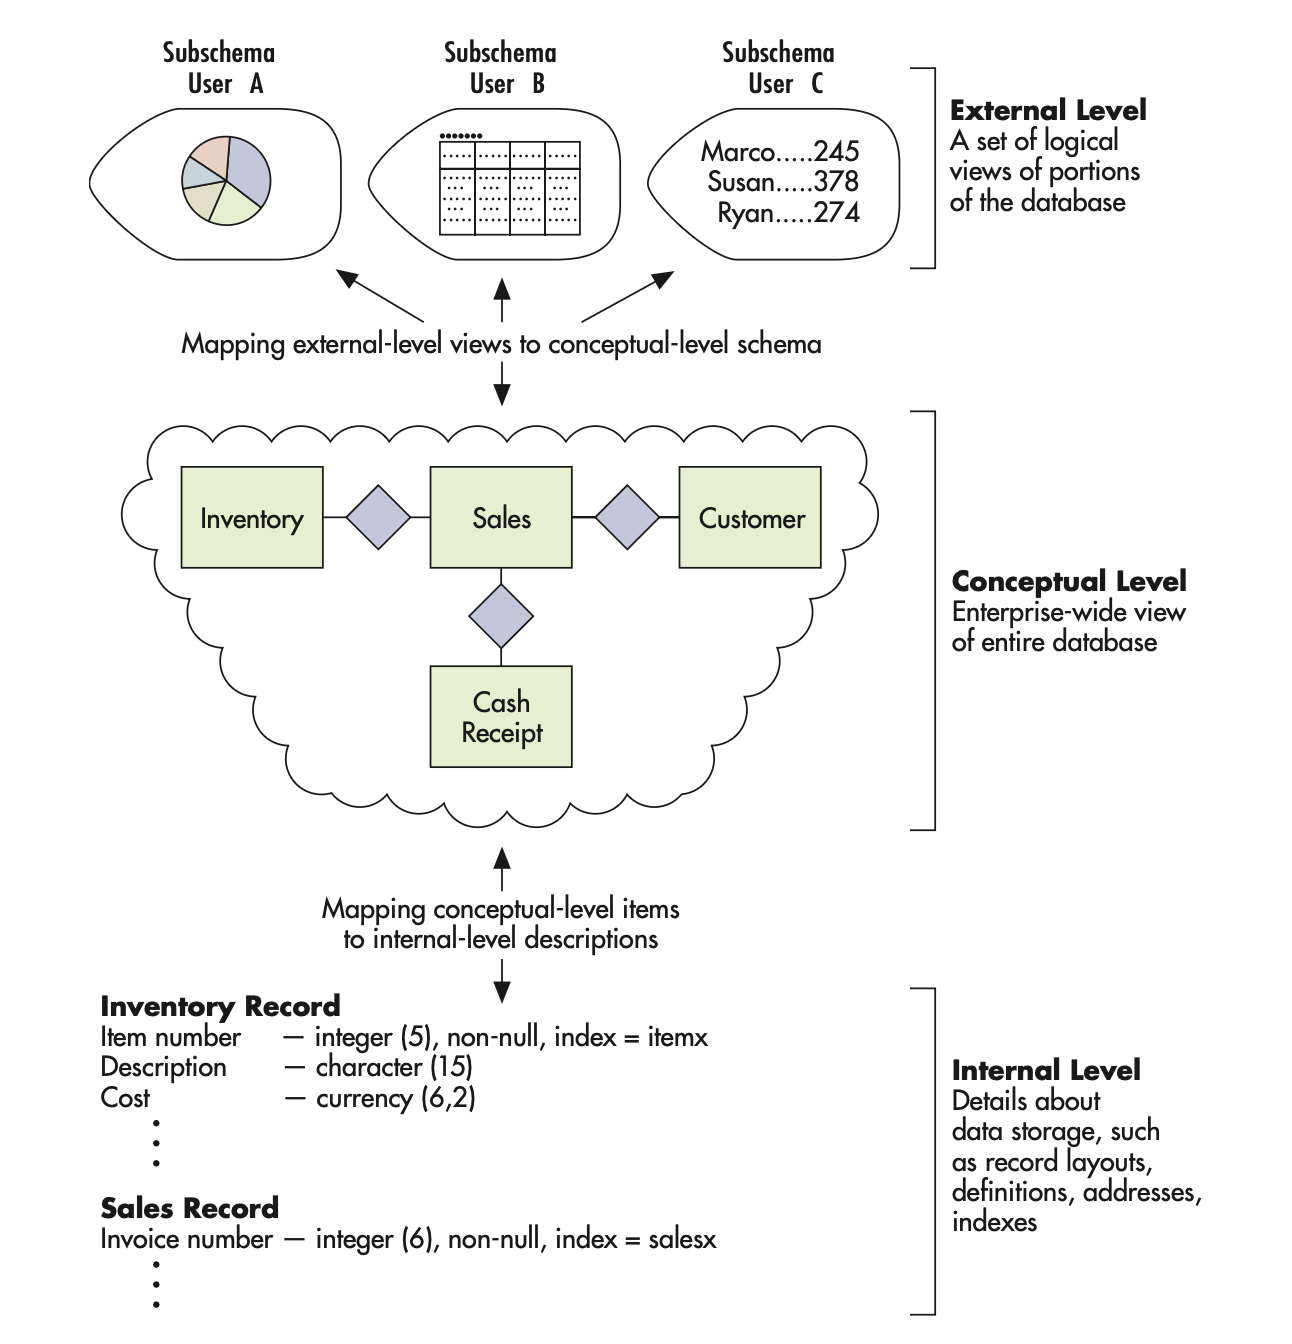
How are schemas used by the database management system
the DBMS uses the mappings (schemas) to translate a user’s or program’s request for data (expressed in terms of logical names and relationships) into the indexes and addresses needed to physically access the data
The five languages of the DBMS
Data definition language (DDL): builds the data dictionary, creates the database, describes logical views for each user, and specifies record or field security constraints
CREATE, DROP, ALTER
Structured Query Language (SQL): standardized commercial programming language designed for managing data in relational database systems. Though it is standardized, variations exist among different database systems
Data manipulation language (DML): changes database content, including data, updates, insertions, and deletions
Ex: INSERT, UPDATE, TRUNCATE, DROP
Data Query Language (DQL): a high-level, English-like languages that contains powerful, east-to-use commands that enable users to retrieve, sort, order, and display data
Ex: SELECT
Report writer - uses standard English to explain how a query is fulfilled
Relational Databases
A collection of two-dimensional tables with each table representing an object about which we wish to collect and store information
each row is called a tuple, contains data about a specific occurrence of an entity
each column contains data about an attribute of that entity
Relational data model represents conceptual and external-level schemas as if they were represented in tables, though they are actually represented as if they were internal-level schemas
Primary key vs. Foreign key - relational databases
primary key = the database attribute, or combination of attributes, that uniquely identifies a specific row in a table
The one piece of data that is guaranteed to be unique for every single record
Can never be empty (null)
Ex: Student ID number - even if two students are named Alex Smith and were born on the same day, they’ll still have different student IDs
foreign key = an attribute in one table that is a primary key in another table AND is used to link the two tables
does NOT have to be unique
creates a relationship between two tables
Ex: The student ID in the Class Enrollment table links back to the Student table. This allows us to track which student is in which class, rather than having to type in the student name, date of birth, address, major, etc.
The 4 Vs of big data
Data Volume = refers to the amount of data created and stored by an organization
Data Variety = refers to the different forms data can take
Data Velocity = refers to the speed at which data are created and stored by an organization
Data Veracity = refers to the quality and trustworthiness of data
EY definition of analytics mindset
the ability to ask the right questions, extract and transform relevant data (ETL), apply appropriate analytical techniques, and interpret/share results with stakeholders
SMART objectives when asking a question
Specific - direct and focused to produce a meaningful answer
Measurable - amenable to data analysis. The inputs to answering the question must be measurable with data
Achievable - able to be answered, and the answer should result in a decision maker taking action
Relevant - related to the objectives of the organization or the situation under consideration
Timely - have a defined time horizon for answering
ETL
Extract
Transform
Load
Steps to extract data
Extract - 3 steps
understanding the data needs and the data that is available
performing the data extraction
verifying the data extraction quality and documenting what was done
Steps to transform data
Transform - 4 steps
understand the data and the desired outcome
standardize, structure, clean the data
validate data quality and verify that data meet data requirements
document the transformation process
Steps to load data
Load -
transformed data must be stored in a format and structure compatible with the receiving software
save data as a text file using delimiters, put them in relational table form
strip out, standardize most formatting (remove commas, use standard date format, use minus sign to indicate negative)
Structured data
Data that are highly organized and fit into fixed fields. Data warehouses typically only store structured data
accounting data
relational data
most spreadsheet data
Unstructured Data
Have no uniform structure and include items such as images, audio files, documents, tweets, e-mails, videos, presentations
Semi-structured data
Data that are organized to some extent but not enough to be inserted into a relational database
Data Mart
smaller (than data warehouses) data repositories holding structured data
ex: company creates data mart for all data in geographic regions (N. America, S. America)
Ex: company creates data mart for each division (sales, marketing)
Data Lake
A collection of structured, semi-structured, and unstructured data stored in a single location
can cause problems if it becomes too large and if important data gets lost (dark data)
Dark data
Data the organization has collected and stored that would be useful for analysis but is not analyzed or organized and is thus generally ignored
Data Swamp
Form when data lakes are not accurately documented, making it so that their stored data cannot be identified and analyzed
disorganized, impossible to use
Delimiters and text qualifiers in flat files
flat file = text file that consolidates data from multiple tables or sources into a single row
make it easier to find and analyze data as opposed to separate files
A DELIMITER (aka field separator) is used to distinguish between fields in a single line
A character/series of characters that separates one field from another
often the “ | “ symbol
Categories of Data analytics techniques (4)
descriptive
diagnostic
predictive
prescriptive
Descriptive Analytics
Answers the question of “what happened” or “what is happening”
ex: financial ratios (ROE, Debt to Equity)
Diagnostic analytics
Answers the question of “why did this happen”
identifies cause/effect relationships
ex: determine if increasing the IT budget in an organization increases employee efficiency and effectiveness
Predictive Analytics
Answers the question of “what might happen in the future”
used to forecast events like stock prices or currency exchange rates
Prescriptive Analytics
Answers the question of "what should be done”
ex: can provide recommendations like whether or not to grant a loan
Correlation vs. Causation
Correlation - indicates that two things occur at the same time
Causation - implies that one event causes another
How to share results
Data Storytelling = process of transforming complex data analyses into simpler terms to aid in better decision making
consider the objectives of the stakeholders, design the story to address those objectives
consider the audience’s needs and preferences
Data visualization = the use of a graphical representation of data to convey meaning
usually displayed on a data dashboard
5 Attributes of High-Quality Data
Accurate = correct, free from error, accurately represent events and activities
Complete = do not omit aspects of events or activities
Consistent = presented in the same format over time
Timely = provided in time for decision makers to make decisions
Valid = data measure what it is intended to measure
Data Structure
Data structure = how data are organized and stored, including the relationships between different fields
Data structuring = the process of organization to prepare data for analysis
3 ways data can be changed: Aggregate data, Data joining, Data Pivoting
Aggregate Data (one of the ways data can be structured)
A summary of the data with fewer details than in the originals set
Ex: remove the detail of each sale, but provides a summary of sales data by manager
Data Joining (a way data can be structured)
Joining data from different tables into one single table for analysis
Data Pivoting (a way data can be structured)
Rotating data from rows to columns so as to make certain aspects of the data easier to interpret
Data Standardization
The process of standardizing the structure and meaning of each data element so it can be analyzed and used in decision making.
made up of: parsing, concatenation, cryptic data values, misfielded data values, data formatting, data consistency
Data parsing
Separating data from a single field into multiple fields
Ex: Splitting into separate fields something like N-0504-2002
Data Concatenation
Process of combining data from two or more fields into a single field
Ex: Taking columns with first, middle, last names and pulling them all into one field
Cryptic Data Values
Data items that have no apparent meaning without knowledge of the underlying coding scheme
Ex: consulting firm may use the numbers 1, 2, 3 to represent partner, senior consultant, and research analyst in its database
Misfielded Data Values
Data values that are correctly formatted but not listed in the correct field
Ex: City field contains “Germany”
Data Formatting
Data values should have the same format as all other values in the same field and match the data type specified in the data dictionary
Data Consistency
The principle that every value in a field should be stored in the same way
Data Cleaning
Involves updating data to ensure they are consistent, accurate, and complete
Data De-Duplication
The process of analyzing data and removing two or more records that contain identical information
Data Filtering
The process of removing records or fields of information from a data source
Ex: company periodically removes data about potential vendors that they’ve decided they are not going to purchase from (inactive)
Data imputation
The process of replacing a null or missing value with a substituted value
only works with numeric data
Data Contradiction Errors
Occur when the same entity is described in two conflicting ways
a data file contains information about a manufacturing plant in two different records, but the physical address of the manufacturing plant is different in each record
Data Threshold Violations
Occurs when a data value falls outside an allowable level
Data Entry Errors
All types of errors that come from inputting data incorrectly
misspelling words, transposing digits in numeric strings, failing to enter data
Data Validation - Four methods
The process of analyzing data to ensure that they have the properties of high-quality data before, during, and after the transformation process. Can be formal and informal
visual inspection
basic statistical tests
auditing a sample
advanced testing techniques
Visual Inspection
A simple technique that involves examining data using human vision to detect potential issues
Basic Statistical Tests
calculate minimum, maximum, mean, median, sum for each field
examine for unreasonable values
Audit a sample - a method of data validation
one of the best ways to ensure data quality
set up a sample of rows, columns and carefully analyze each value to ensure its validity
trace back to original source documents
Advanced Testing Techniques
With a deep understanding of the data, one can leverage that knowledge to confirm that the transformed data adhere to accounting rules, which provides evidence of the quality of the data
Four Categories of Data Analysis
Descriptive analytics, Diagnostic analytics, Predictive analytics, Prescriptive analytics
Descriptive Analytics - 4 items important to undeststand
identify mistakes in the data
understand the structure of the data
check assumptions required by more formal statistical modeling techniques
determine the size, direction, and strength of relationships between variables
5 Whys Principle
It often requires asking “why” five times to uncover the true reason why something happened
Diagnostic analysis - basic process of testing hypothesis
1- state a null and alternative hypothesis
2- select a level of significance for refuting the null hypothesis
3- collect a sample of data to compute the probability value
4- compare the computed probability against the level of significance and determine if the evidence refutes the null. Failing to refute the null hypothesis is seen as support of the alternative hypothesis
Null hypothesis vs alternative hypothesis
Null = a statement of equality- suggesting there is no relationship among the ideas
in stats, we try to find enough evidence to reject the null (we dont try to prove the null)
Ex: The new layout of the store had NO effect on spending.
Alternative = a statement of inequality - suggests that one idea is related to another idea
Ex: The new layout increased customer spending
Predictive analysis steps
Definition: utilizes historical data to identify patterns that are likely to repeat themselves in the future
1- define the desired outcome to predict
2- identify and prepare the relevant data for analysis
3- develop and validate a predictive model
Training Data vs. Testing Data
training = used to create the model for future prediction
test = used to assess how well the model predicts the target outcome
these data sets cannot be the same
data overfitting = when the model fits the training data very well but does not predict well when applied to other datasets
Machine Learning Types
Machine learning = an application of artificial intelligence that allows computer systems to improve and update predictions by using algorithms and statistical models to analyze and draw inferences from data
3 types:
1- supervised
2- unsupervised
3- reinforcement
Supervised machine learning
A type of machine learning algorithm in which the model is trained using a labeled dataset
This helps the model to classify and predict outcomes accurately
Helps the computer learn general rules that maps inputs into the correct outputs using the labeled training data
Unsupervised machine learning
A type of machine learning algorithm that uses unlabeled datasets to analyze datasets
Reinforcement machine learning
A type of machine learning algorithm that is trained by only rewarding or punishing the algorithm as it tries to achieve a desired outcome
Common problems in data analytics
Garbage in, garbage out = you must start with high quality data if you are to have useful analysis
Extrapolation = a process of estimating a value beyond the range of the data used to create the model
Data overfitting = when a model is too closely matched to a specific set of data (training data) and is unable to actually predict future observations
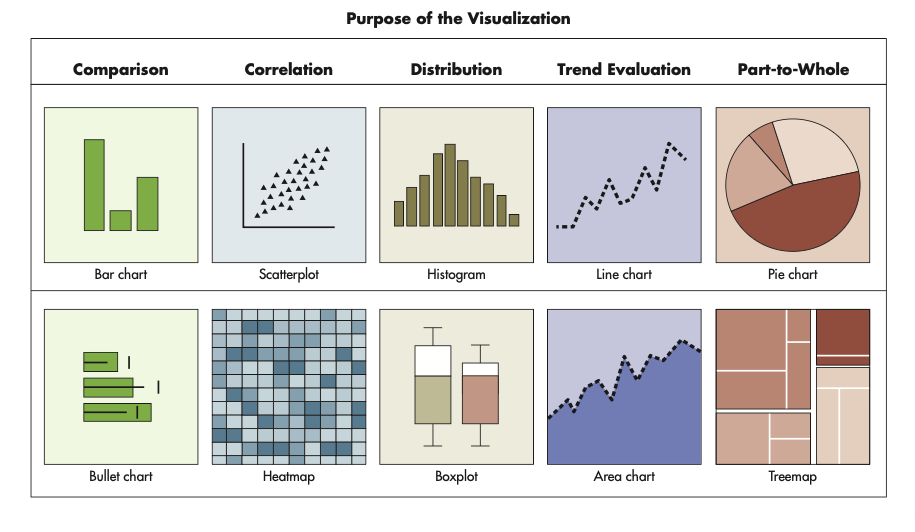
5 Main Purposes for Visualization
1- comparison (bar chart)
2- Correlation (scatterplot)
3- Distribution (histogram)
4- Trend Evaluation (line chart)
5- part-to-whole (pie chart)
3 design principles for high quality visualizations
Simplification - in design, making a visualization easy to interpret and understand
Emphasis - assuring the most important message is easily identifiable
Ethical data presentation - avoiding the intentional or unintentional use of deceptive practices that can alter the user’s understanding of the data being presented