Biostats Unit 3
1/26
There's no tags or description
Looks like no tags are added yet.
Name | Mastery | Learn | Test | Matching | Spaced |
|---|
No study sessions yet.
27 Terms
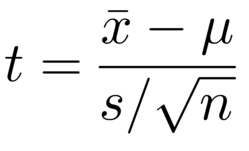
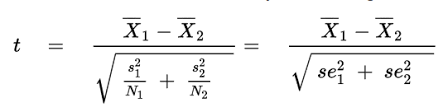
T-statistic equation
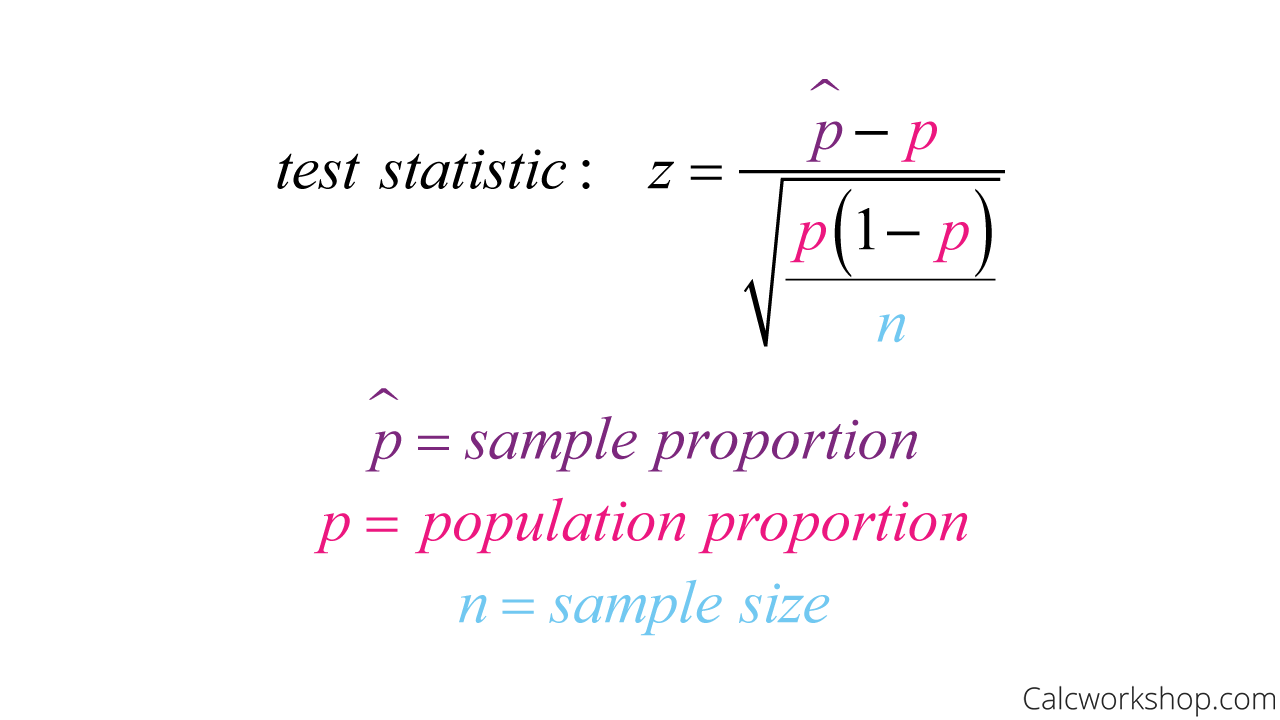
Z-test for a pop. proportion
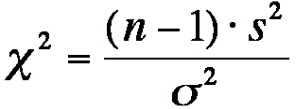
Chi-square equation
-when testing a single population variance
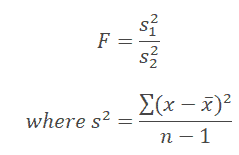
F-distribution
-when you're comparing two variances (or standard deviations) from independent samples.
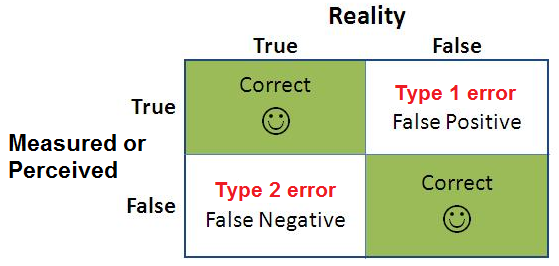
Type 1 error
rejecting the null hypothesis when it is actually true
Type II error
the error committed when a false null hypothesis is not rejected
-probability of committing this error is designated by Beta
Step 7- Calculation of test statistic
From the data contained in the sample we compute a value of the test statistic and compare it with the rejection and nonrejection regions that have already been specified.
Step 8- Statistical decision
consists of rejecting or of not rejecting the null hypothesis. It is rejected if the computed value of the test statistic falls in the rejection region, and it is not rejected if the computed value of the test statistic falls in the nonrejection region.
P-value
the probability that the computed value of a test statistic is at least as extreme as a specified value of the test statistic when the null hypothesis is true. Thus, the p value is the smallest value of α for which we can reject a null hypothesis.
helps us figure out if the results we see in an experiment or study happened by random chance or if they are likely showing something real.
is the probability of getting results at least as extreme as what you observed, if there’s really nothing special going on (meaning, if the "null hypothesis" is true).
p-value = probability of seeing your results (or more extreme) IF nothing is really happening.
Small p-value = surprising result → maybe something real is going on!
Big p-value = not surprising → probably just random chance.
T-test for unequal variances
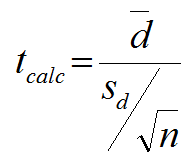
Paired t-test
Same subjects before and after? → Paired
-Find the difference for each subject:
Difference=Experimental-control
Calculate:
The mean of those differences (d bar)
The standard deviation of those differences (sd)
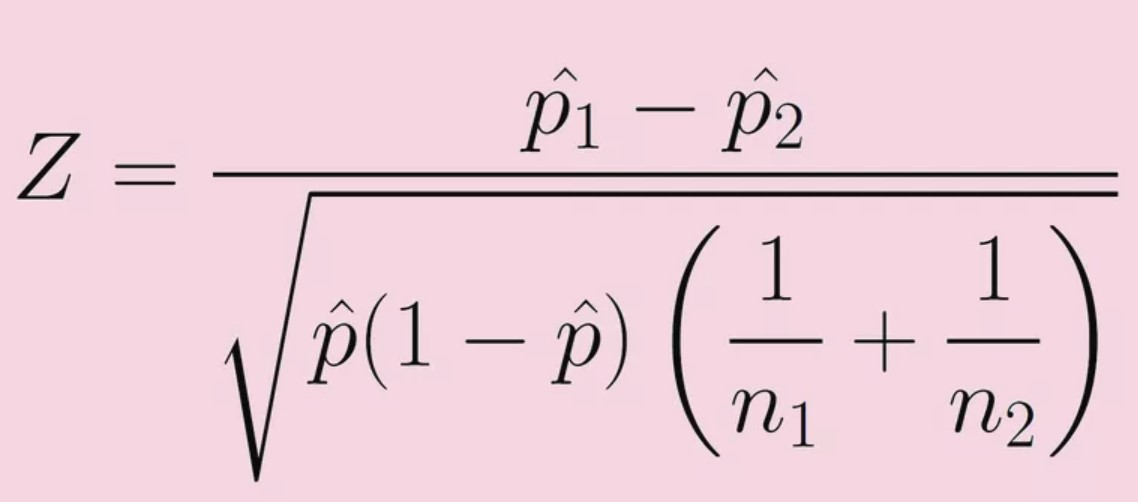
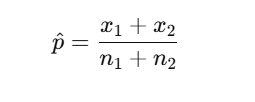
Two proportion z-test
-p hat = pooled proportion x1 + x2 / n1 + n2
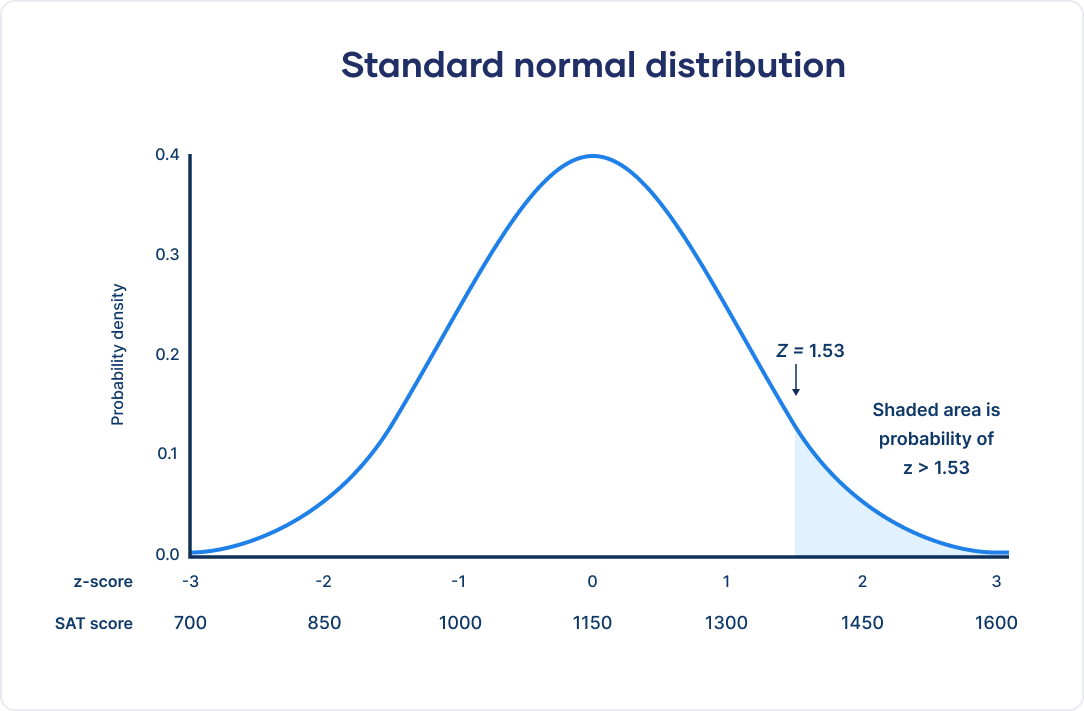
Z distribution
If σ(population standard deviation) is known ➔ Use a Z-test.
For large samples, you might use a Z-test (but only if σ is known).
when it comes to single proportions, we use a Z-distribution
T-distribution
If σ (population standard deviation) is unknown and you're using the sample standard deviation (s) ➔ Use a t-test.
For small samples (n < 30), typically use a t-test if σ is unknown.
1) Data
The nature of the data that form the basis of the testing procedures must be understood, since this determines the particular test to be employed.Whether the data consist of counts or measurements, for example, must be determined.
2) Assumptions
As we learned in the chapter on estimation, different assumptions lead to modifications of confidence intervals. The same is true in hypothesis testing: A general procedure is modified depending on the assumptions. In fact, the same assumptions that are of importance in estimation are important in hypothesis testing. We have seen that these include assumptions about the underlying distribution of the population, equality of variances, and independence of samples.
Exp:
The data should come from a random sample of the population.
The population from which the sample is drawn should be approximately normally distributed.
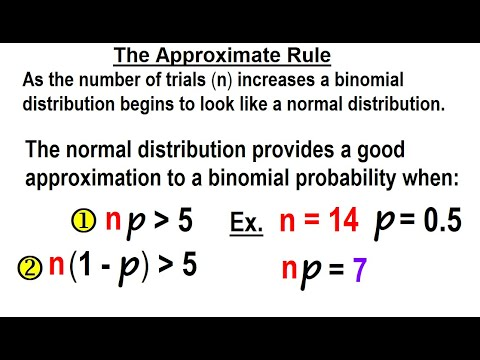
n*p rule
The condition is specifically used for
👉 Binomial Distributions & Proportions
This is for when you're approximating a binomial distribution with a normal distribution.
Typically used in:
One-sample proportion tests
Two-sample proportion tests
Situations where you're counting "successes" and "failures" (like yes/no, defective/not defective, etc.).
Step 4- Test statistic
The test statistic is some statistic that may be computed from the data of the sample. As a rule, there are many possible values that the test statistic may assume, the particular value observed depending on the particular sample drawn. As we will see, the test statistic serves as a decision maker, since the decision to reject or not to reject the null hypothesis depends on the magnitude of the test statistic.
Step 6-Decision rule
All possible values that the test statistic can assume are points on the horizontal axis of the graph of the distribution of the test statistic and are divided into two groups; one group constitutes what is known as the rejection region and the other group makes up the nonrejection region
sample variance
s²
population variance
Why is α=0.05 commonly Used?
-The significance level α\alpha represents the probability of making a Type I error — rejecting the null hypothesis when it is actually true.
-"I’m willing to accept a 5% chance of incorrectly rejecting a true null hypothesis."
-This level is widely accepted in many fields as it offers a reasonable trade-off between being too strict and too lenient when determining statistical significance."
Hypotheses
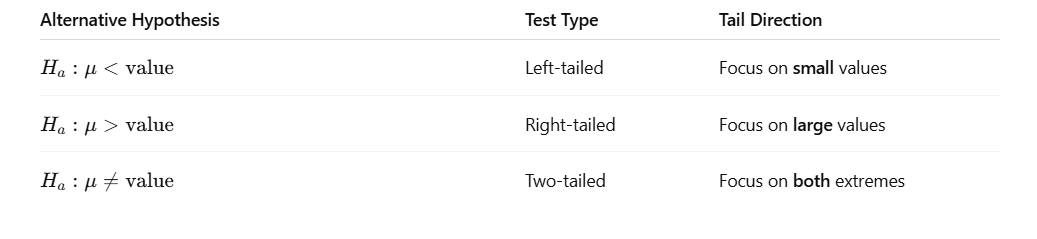
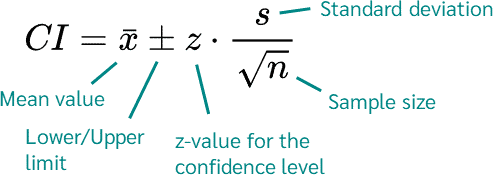
Confidence interval
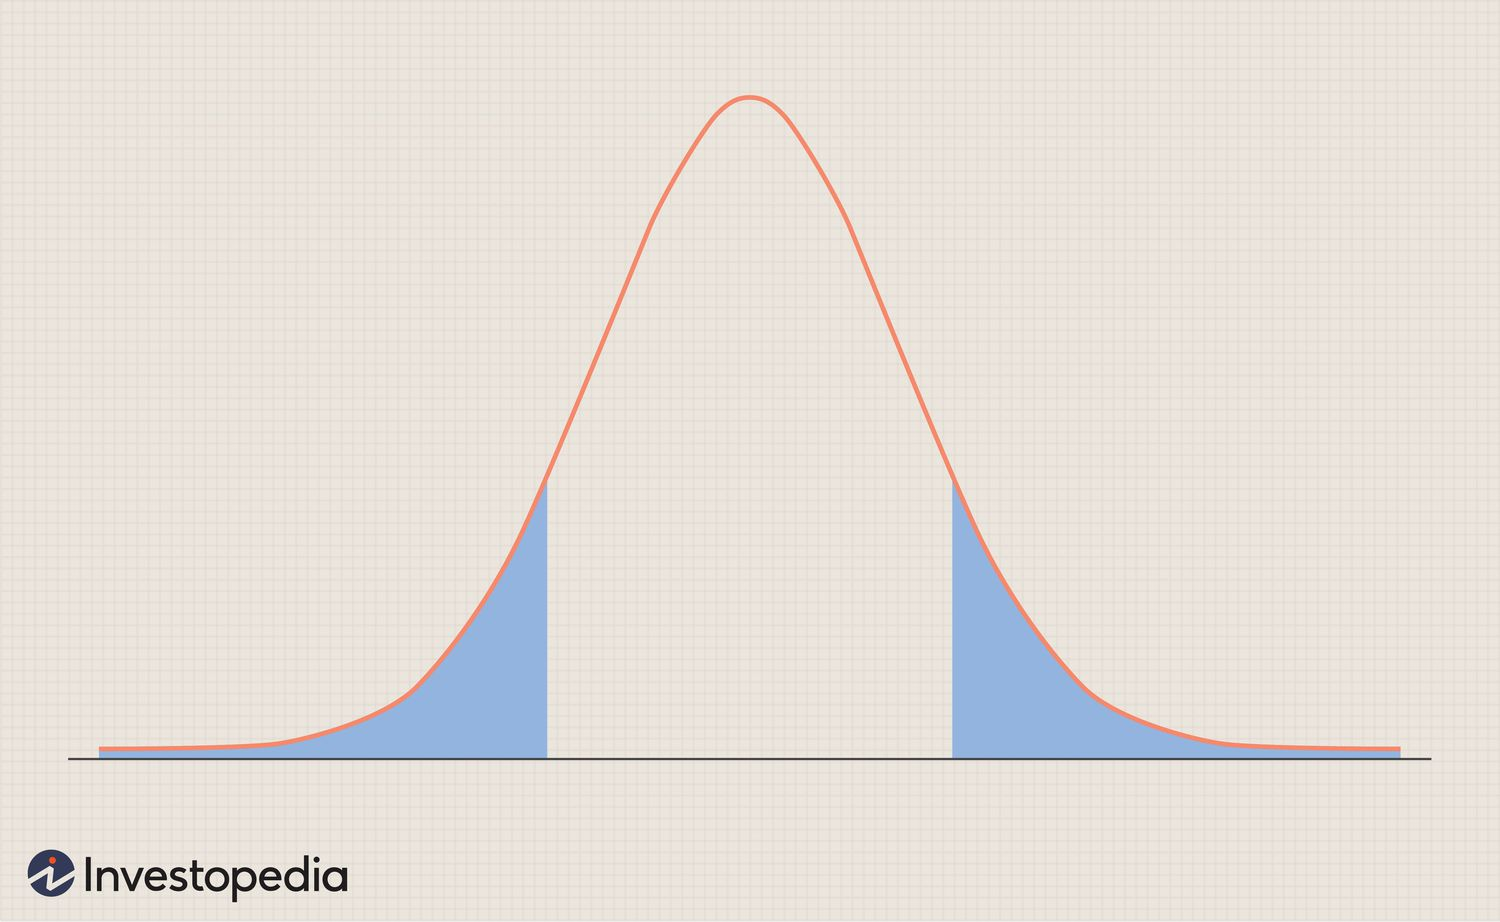
-two tailed
Pooled proportion
-When you're testing if two population proportions are equal (H0:p1=p2), you're assuming that both groups come from the same population proportion under the null hypothesis.
-So instead of treating each group separately, you combine (or "pool") the successes and sample sizes from both groups to get a single best estimate of that shared proportion.
Outcome variable
-represented by the set of measured values that result from an experiment or some other statistical process.
-often referred to with the letter “y”
Explanatory variable
a variable that is useful for predicting the value of the outcome variable.
-often referred to with the letter “x”