Economics Macroeconomics
1/159
There's no tags or description
Looks like no tags are added yet.
Name | Mastery | Learn | Test | Matching | Spaced | Call with Kai |
|---|
No analytics yet
Send a link to your students to track their progress
160 Terms
circular flow of income model
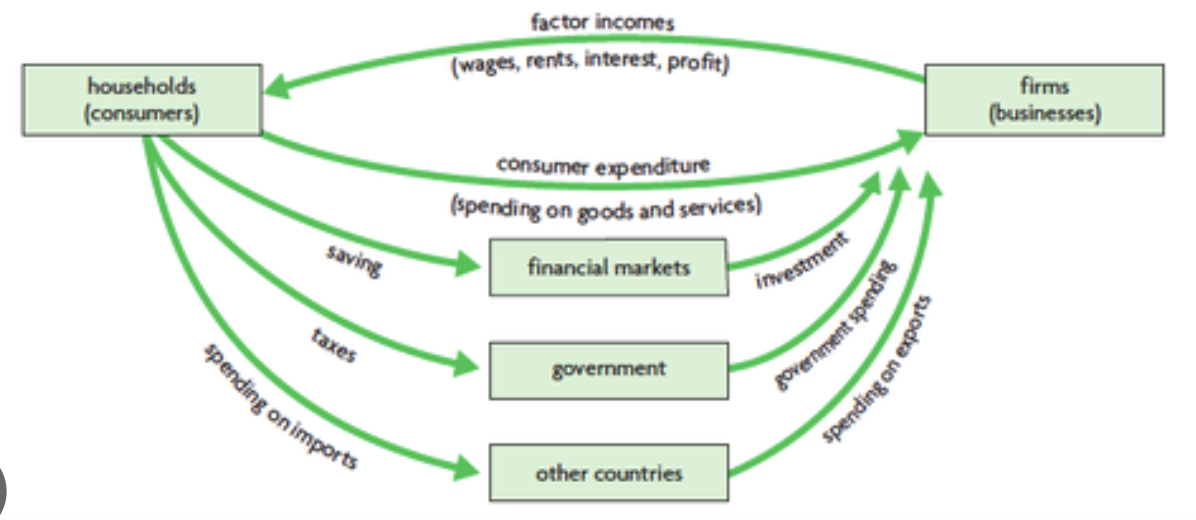
GDP equation
C + I + G + (X - M)
GNI equation
GDP + (income from abroad - income sent abroad)
GDP deflator equation
nominal GDP / real GDP x 100
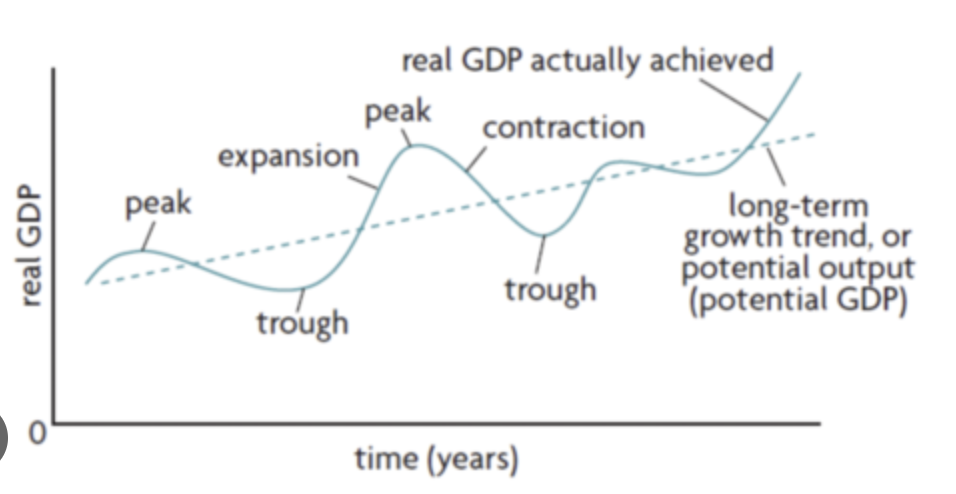
business cycle diagram
aggregate demand (AD) diagram
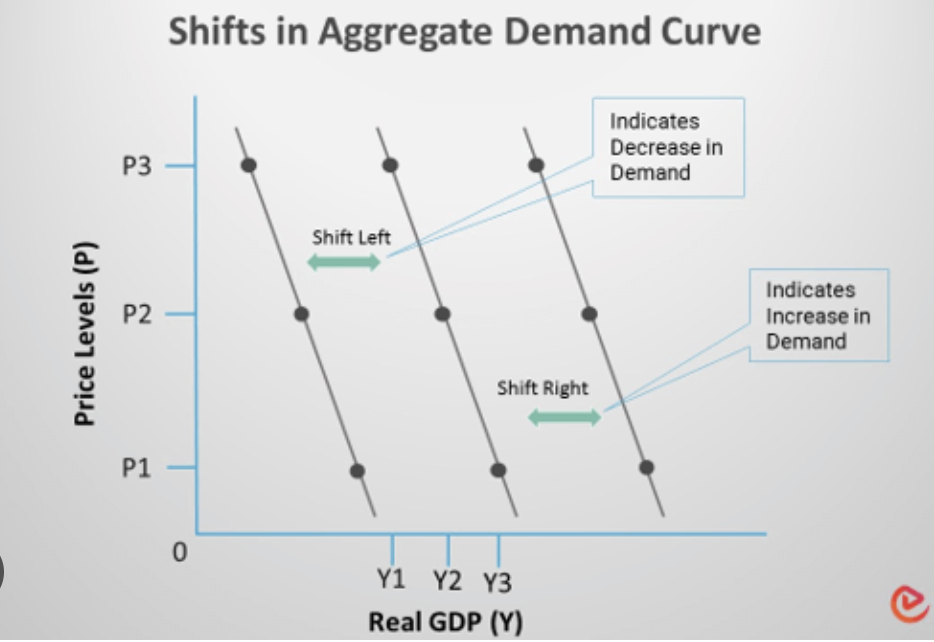
changes in consumer confidence
high consumer optimism = shift right
low consumer optimism = shift left
increase in interest rates = shift left
decrease in interest rates = shift right
increase in consumer wealth = shift right
decrease in consumer wealth = shift left
increase in personal income taxes = shift left
decrease in personal income taxes = shift right
high level of debt = shift left
low level of debt = shift right
high optimism = shift right
low optimism = shift left
increase in interest rates = shift left
decrease in interest rates = shift right
increase in business taxes = shift left
decrease in business taxes = shift right
high level of debt = shift left
low level of debt = shift right
increase in government spending = shift right
decrease in government spending = shift left
increase economic growth = shift right
decrease economic growth = shift left
country A's national income increases = country B shifts right
country A’s national income decreases = country B shifts right
country A's exchange rates appreciate = country A shifts left
country A’s exchange rates depreciate = country A shifts right
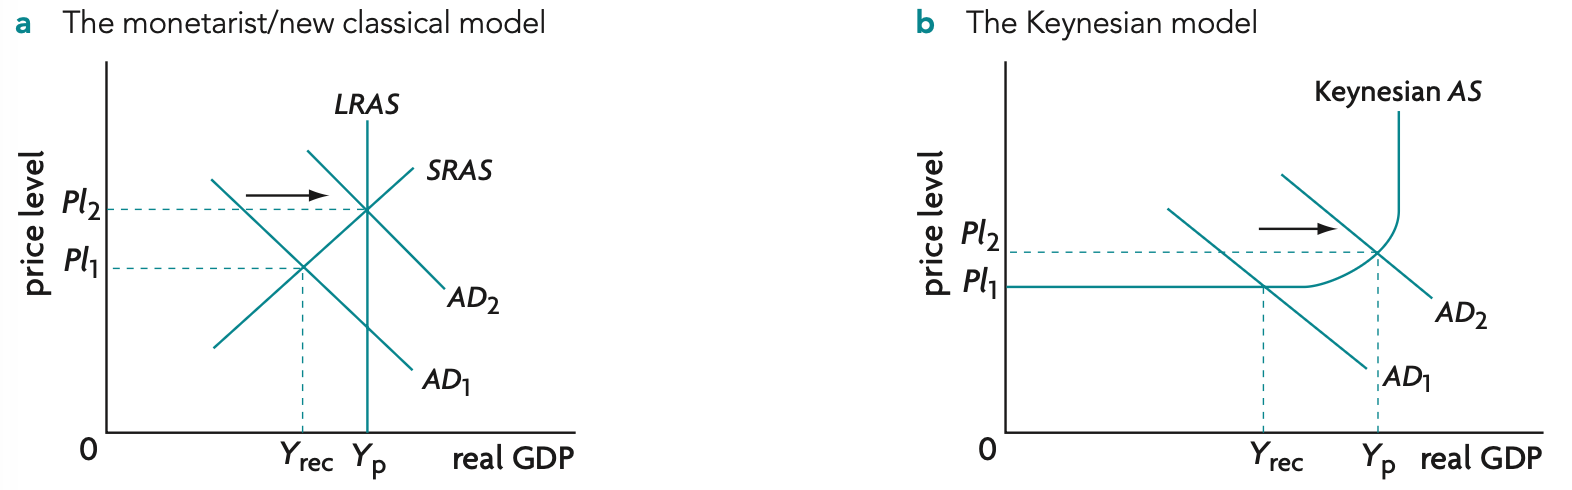
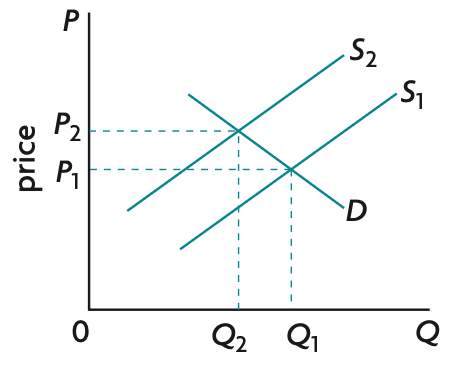
aggregate supply (SRAS) diagram
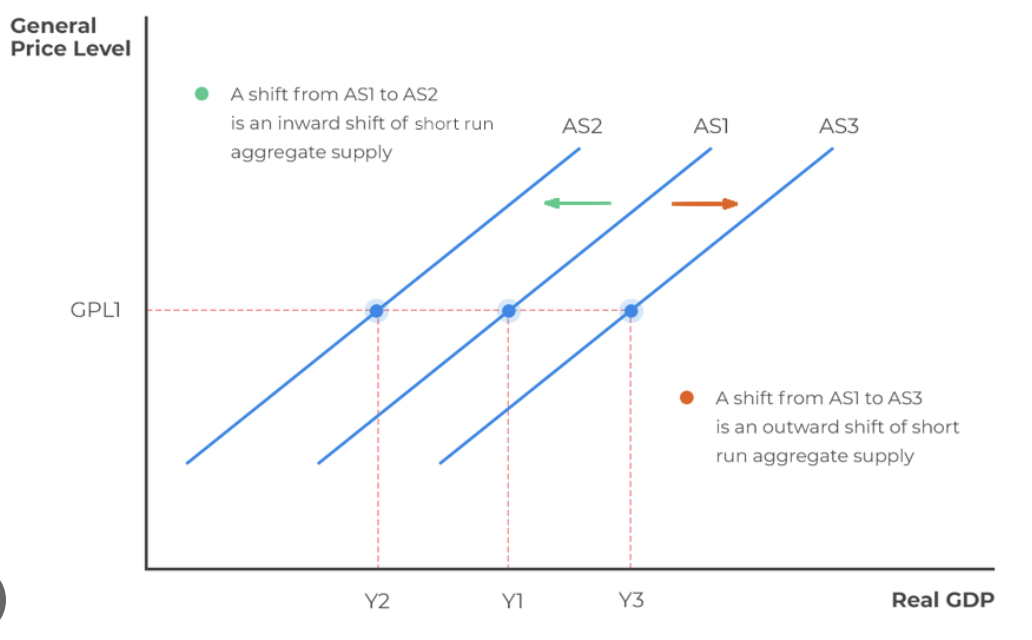
increase in wages = shift left
decrease in wages = shift right
increase in resource costs = shift left
decrease in resource costs = shift right
increase in business taxes = shift left
decrease in business taxes = shift right
increase in subsidies = shift right
decrease in subsidies = shift left
positive supply shock = shift right
negative supply shock = shift left
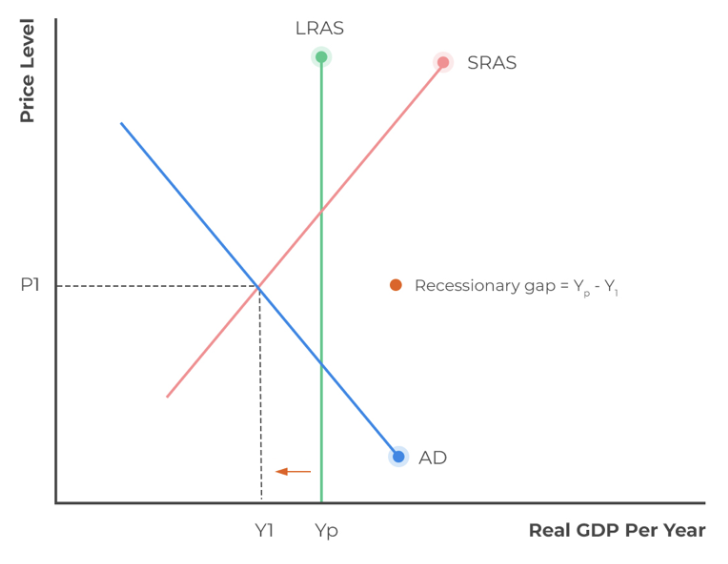
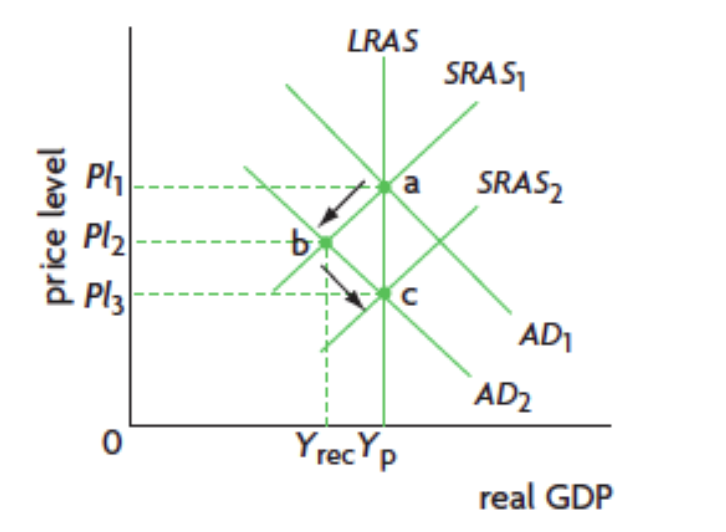
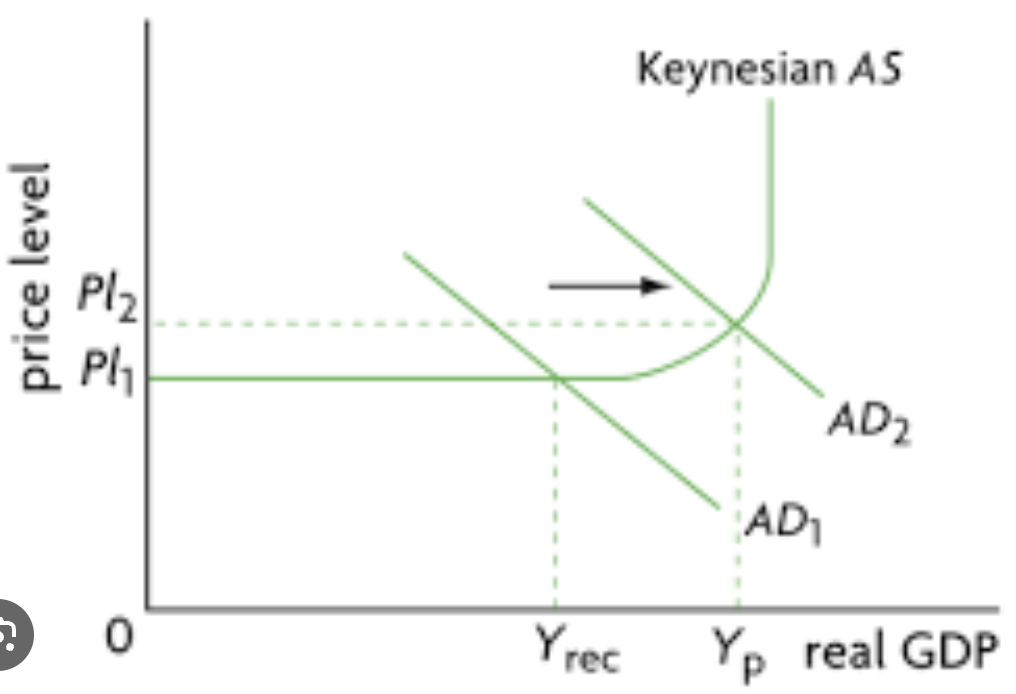
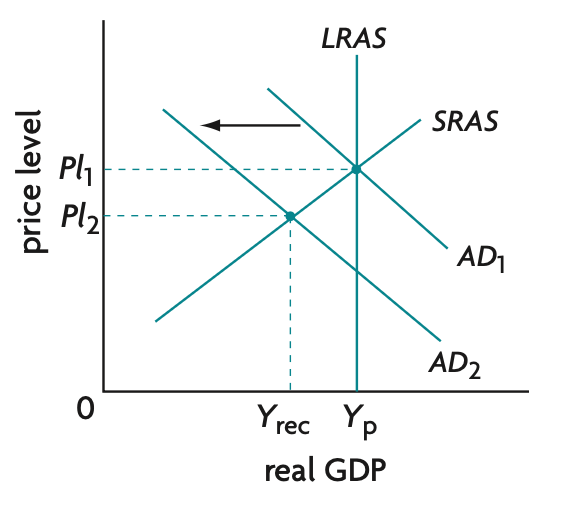
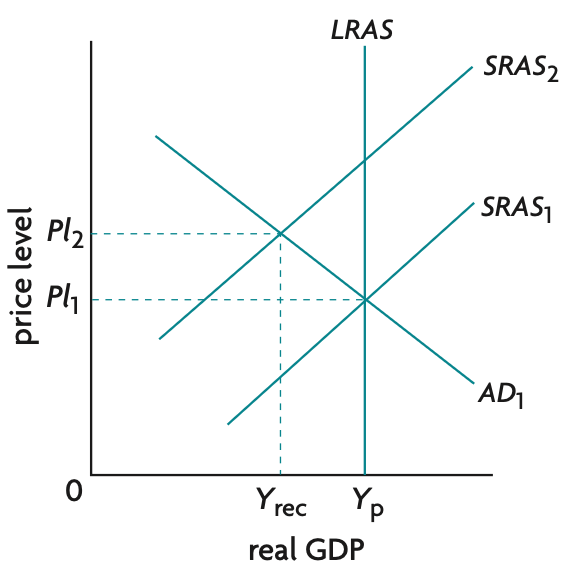
creating and eliminating a deflationary gap diagram
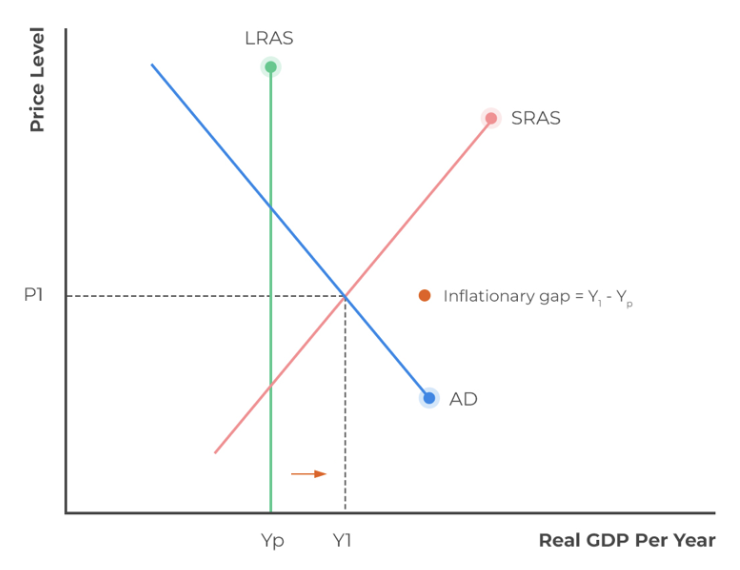
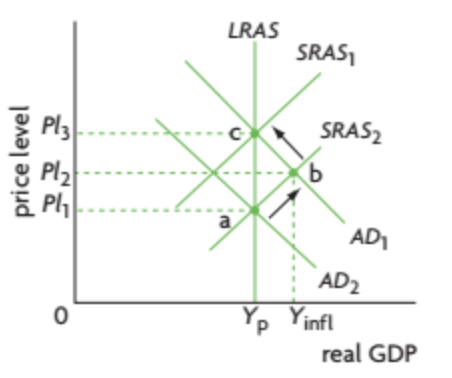
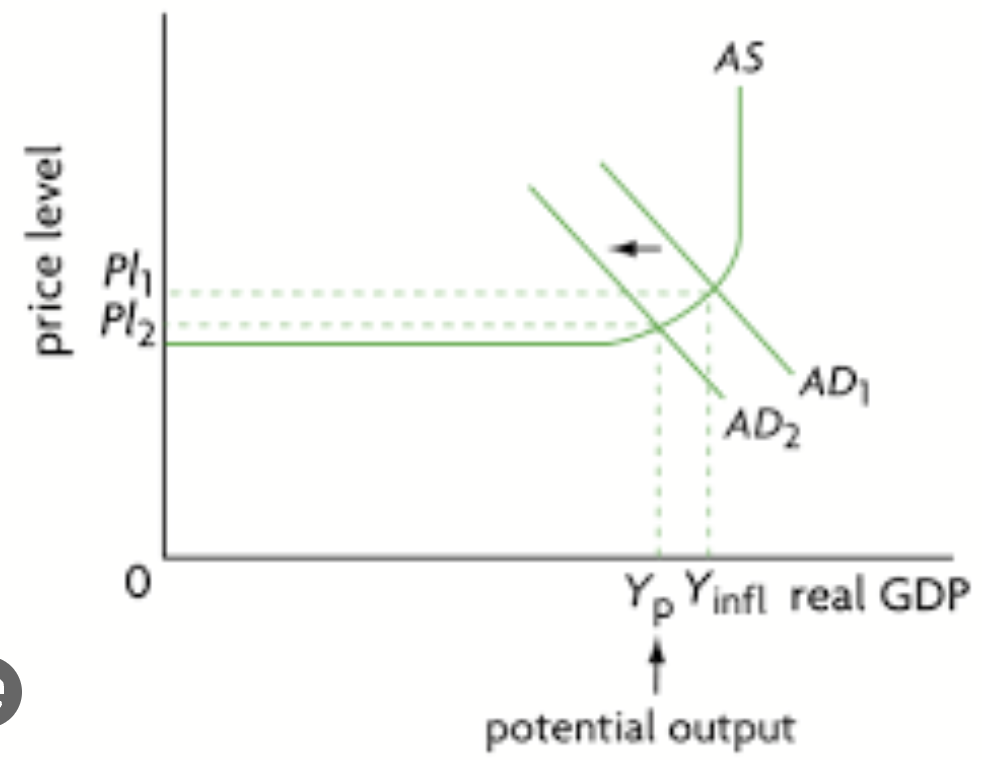
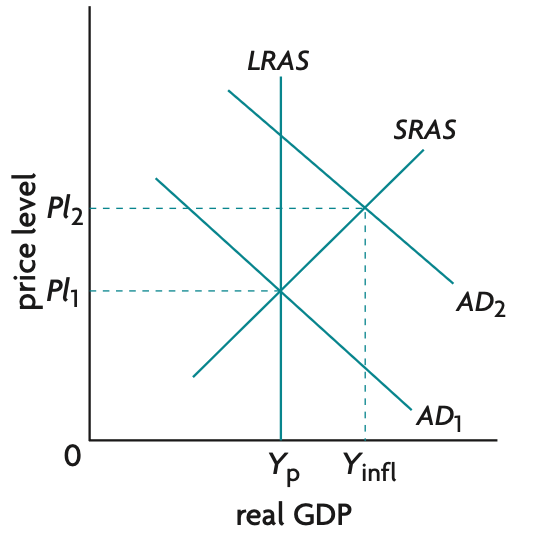
creating and eliminating an inflationary gap diagram
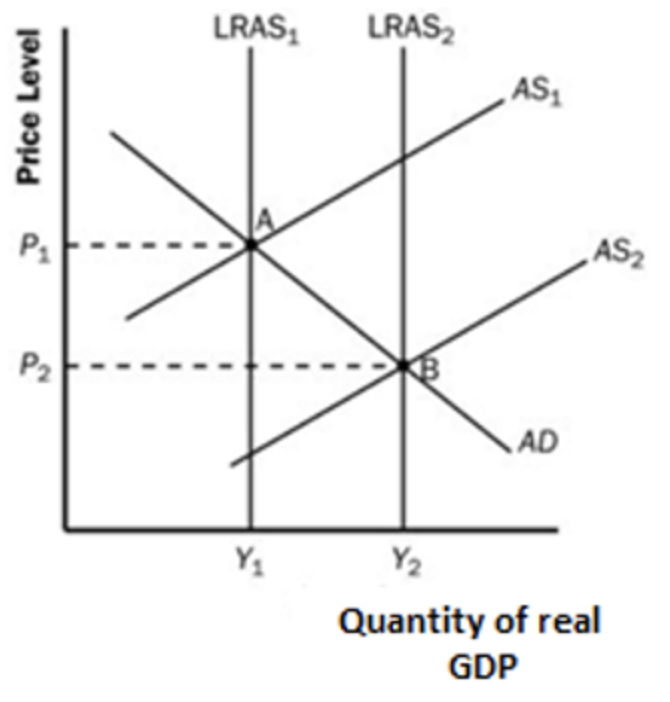
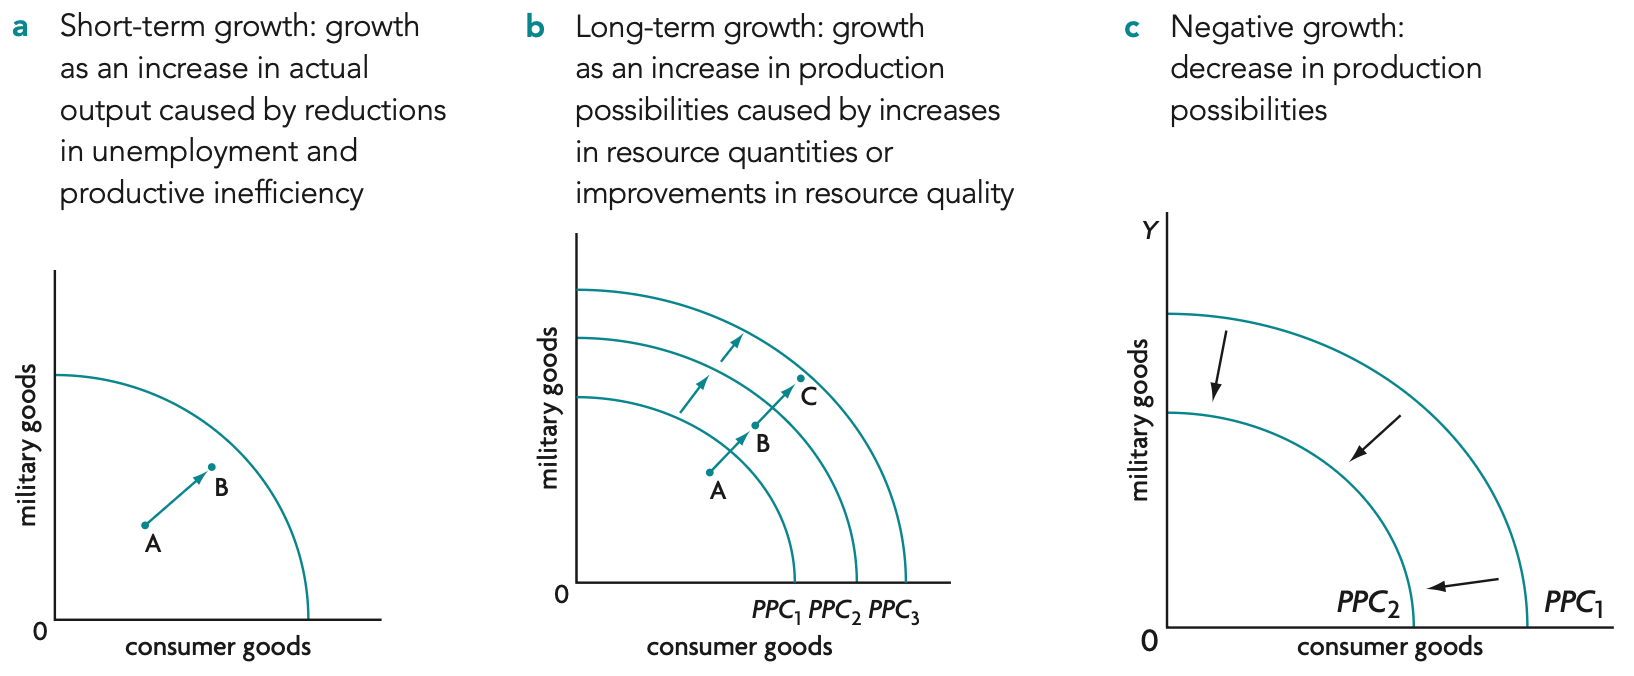
- increase in quantity of factors of production
- improvement in quality of factors of production
- improvement in technology
- increase in efficiency
- better institutions
- reductions in natural rate of unemployment
number of employed / labour force x 100
number of underemployed / labour force x 100
- loss of real GDP
- loss of income for unemployed workers
- loss of tax revenue for the government
- costs to the government of unemployed benefits
- costs to the government of dealing with social problems resulting from unemployment
- more unequal distribution of income
- unemployed people may have difficulties find work in the future
value of basket in specific year / value of same basket in base year x 100 (1dp)
(final value of CPI - initial value of CPI) / initial value of CPI x 100
positive = inflation, negative = deflation
different rates of inflation for different income earners
different rates of inflation depending on regional or cultural factors
changes in consumption patterns due to consumer substitutions when relative price changes
changes in consumption patterns due to increasing use of discount stores and sales
changes in consumption patterns due to introduction of new products
changes in product quality
international comparisons
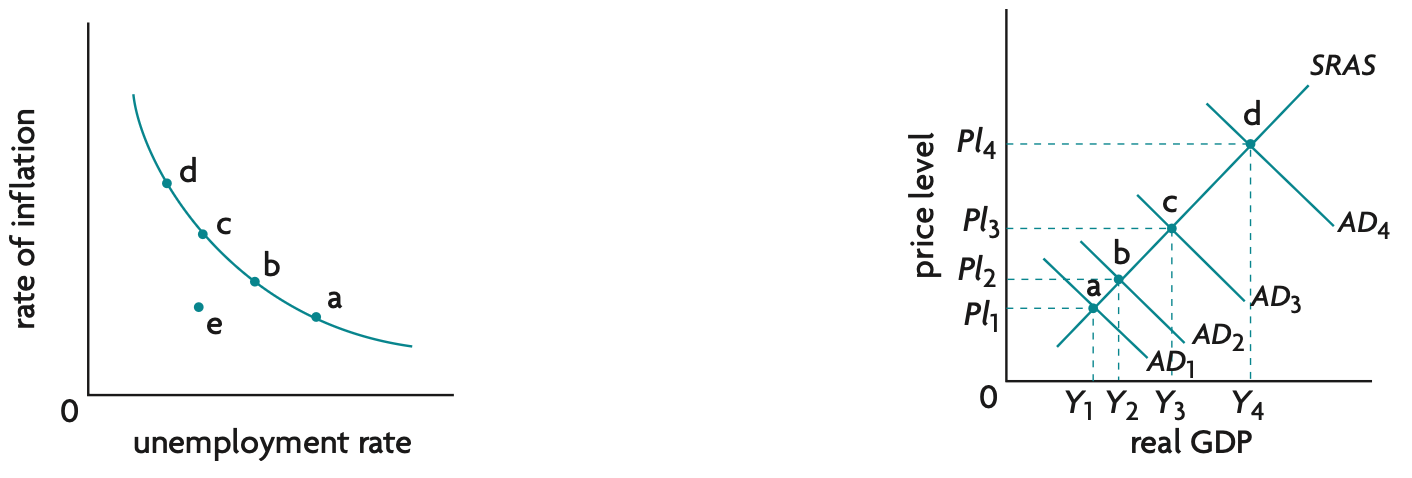
phillips curve diagram (SRPC)
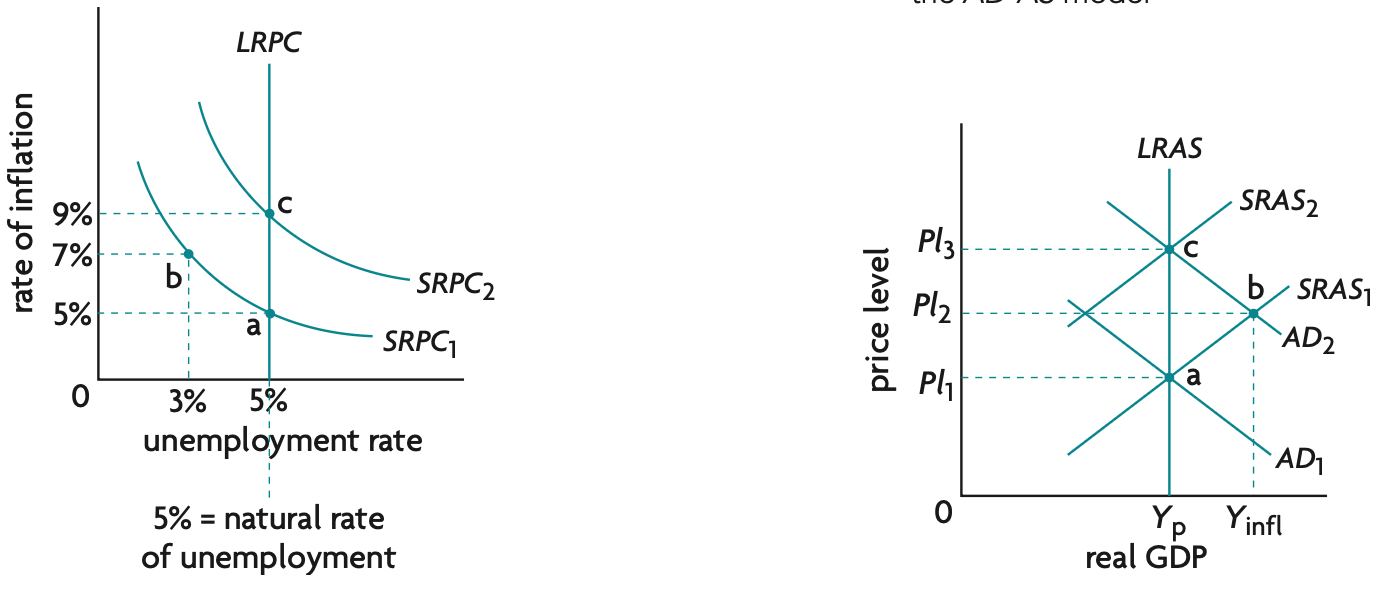
LRPC diagram
production possibilities curve (PPC) diagrams
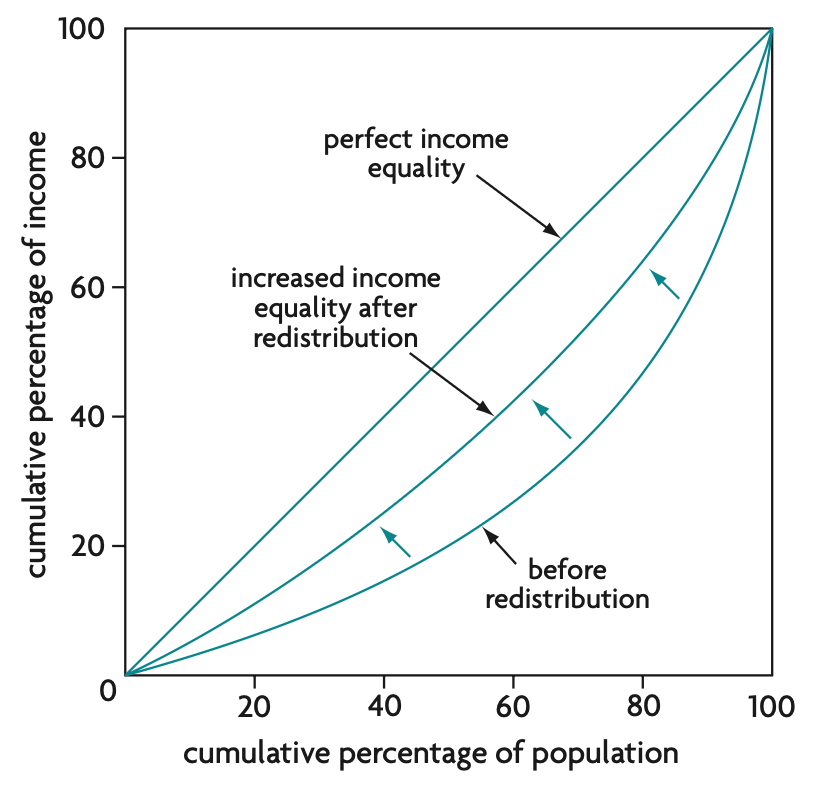
area between diagonal and lorenz curve / entire area under diagonal x 100
Income equality based on Gini coefficient
closer to 0 = greater income equality
closer to 1 = greater income inequality
perfect income equality = 0
1. introduction with definitions and argument
2. diagrams
3. explanation
4. real-world examples
5. evaluation using CLASPP (conclusions, long-term vs short-term, assumptions, stakeholders, priorities, pros and cons)
marginal tax rate equation
total marginal tax / average tax rate x 10