biostats - unit 3
1/39
There's no tags or description
Looks like no tags are added yet.
Name | Mastery | Learn | Test | Matching | Spaced | Call with Kai |
|---|
No analytics yet
Send a link to your students to track their progress
40 Terms
problem multivariate analysis solves
in biology, many factors simultaneously affect response variable
factorial experimental designs
multiple variables are tested simultaneously and every possible combination of the factors is included
assessing parametric assumptions
use residuals because raw data contains too many groups
poison distribution
data are discrete (no fractions), counting rare (random) events
tweedie distribution
use for data with a lot of zeroes
interaction
effect of one explanatory variable depends on effect of another explanatory variable
two-way ANOVA
have two independent categorical predictor variables and one dependent continuous response variable
two-way ANOVA vs normal ANOVA
two-way: effects of two independent variables on a dependent variable, and also tests for any interaction between the two
normal ANOVA: compares means of three or more groups based on the independent variable (only one independent variable)
hypotheses for interactions

what does an interaction imply
effect of 1 variable on the response depends on the value of the 2nd variable
why we don’t just conduct two t-tests or two regressions separately?
leads to multiple comparisons fallacy
multiple comparisons fallacy
when you run too many statistical tests and forget that each test has it’s own chance of a false positive —> start finding “significant” results by random chance, not cuz they’re real
essentially, it inflates probability of running into a false positive
why we can’t just include every variable
will lead to overfitting and collinearity
overfitting
model is too complex and memorizes noise from training data instead of learning the true signal
model will fit current data well but not new data
collinearity
two or more predictors in model are highly correlated, making it hard to estimate the true effect of each separately
like asking if the sun or the temperature causes ice cream to melt more quickly…
what does emmeans do
reports means for us to compare in a table format
what does Tukey-Kramer test do
helps determine which groups were significantly different from the others (absolutely need to use if we have more than 2 levels of any explanatory variables)
principles of experimental design
replication, randomization, reduction of variance, manipulation vs observation, types of variables, hypotheses
replication
does mean trait value of our sample represent the true mean of our population?
randomization
does every part of our population have equal chances of being in our sample?
does every part of our sample have equal chances of being assigned to any treatment group?
reduction of variance
reduce noise - how can we reduce variation that is not relevant to our research question in our samples?
how can we distribute naturally occurring variation across our treatments?
matched pairs design
helps reduce noise —> match each participant with closest partner —> randomly assign one partner and automatically assign the other to the other group
manipulation vs observation
are we creating the groups or are we making comparisons between naturally occurring groups?
drawback of experimental design
can add structure we don’t want to our data
structure we want to our data
experimental treatment groups
naturally-occurring variation we are interested in studying
structure we don’t want in our data
familial, temporal, or spatial similarity
individual-level effects (repeated measurements on same individual)
non-independence
examples = structure we don’t want
means we have committed pseudoreplication
pseudoreplication
researchers mistakenly treat non-independent observations as if they were independent replicates in statistical analysis
inflates degrees of freedom and sample size
pairing and random effects
accounts for structure we don’t want mathematically
paired t-tests
pair experimental units based on shared information to distribute natural variation across treatments
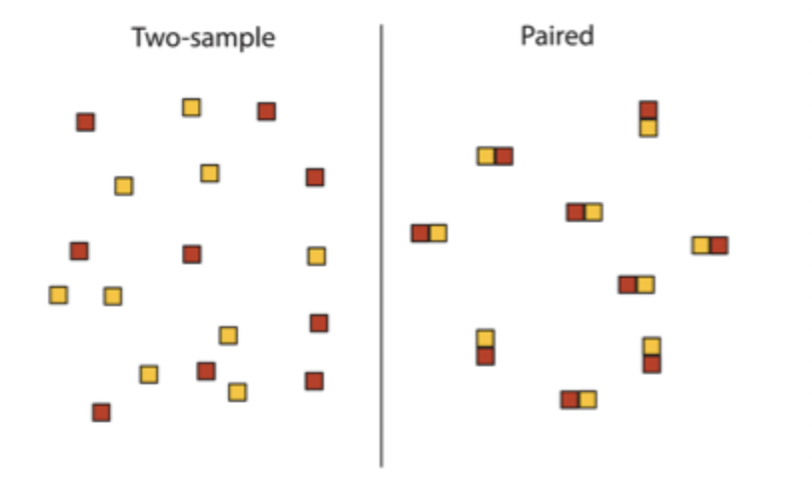
two-sample design vs paired design
random effects
simplest way to control for unwanted structure in our data in all other tests
fixed effects
predefined, repeatable groups with measurable magnitudes
treatments chosen by researcher
interested in magnitude of differences between groups
random effects
occur when groups are randomly sampled from all possible groups in the population
treatments are a random sample from all possible treatments
interested in amount of variation that can be attributed to this effect: variance components
variance components
tells you how much variation is due to random groups, such as families, subjects, etc.
fixed effects model ANOVA
focuses on which groups are different
random effect model ANOVA
focuses on how much does grouping adding variation?
paired t-test assumption check
normality of differences between the two groups
differences ← (blackbirdData$logAfterImplant - blackbirdData$logBeforeImplant)
shapiro.test(differences)
variation in a mixed model
more generalizable (individual identity >1 data point from particular individual or location >1 data point from a particular location)
how glmer controls random effects
allows each group to have it’s own intercept because of the random effect, but still allows us to check for the overall effect of our variable of interest