Graphs - Biopsych
1/70
There's no tags or description
Looks like no tags are added yet.
Name | Mastery | Learn | Test | Matching | Spaced | Call with Kai |
|---|
No analytics yet
Send a link to your students to track their progress
71 Terms
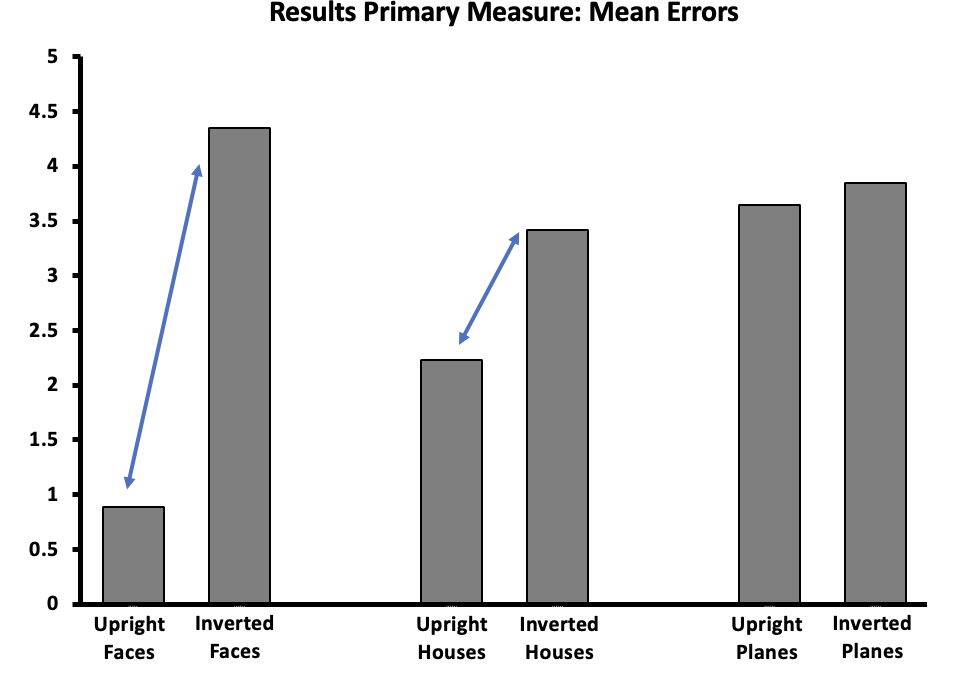
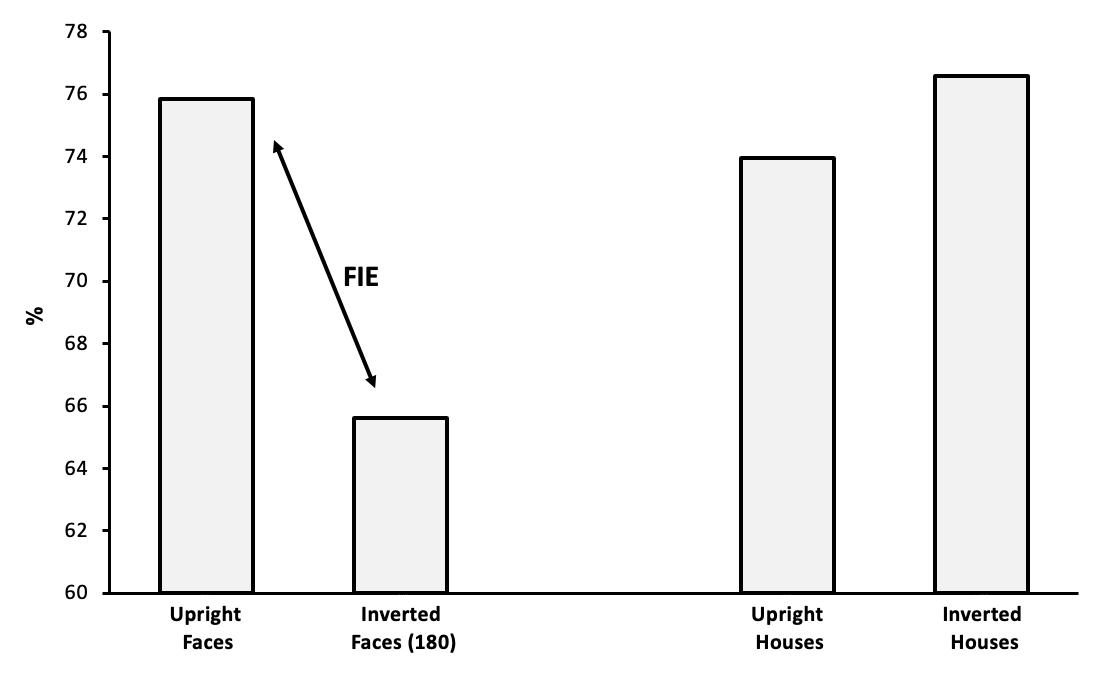
What does this graph mean?
While recall was better for faces overall, this graph shows that when inverted this recall heavily decreases.
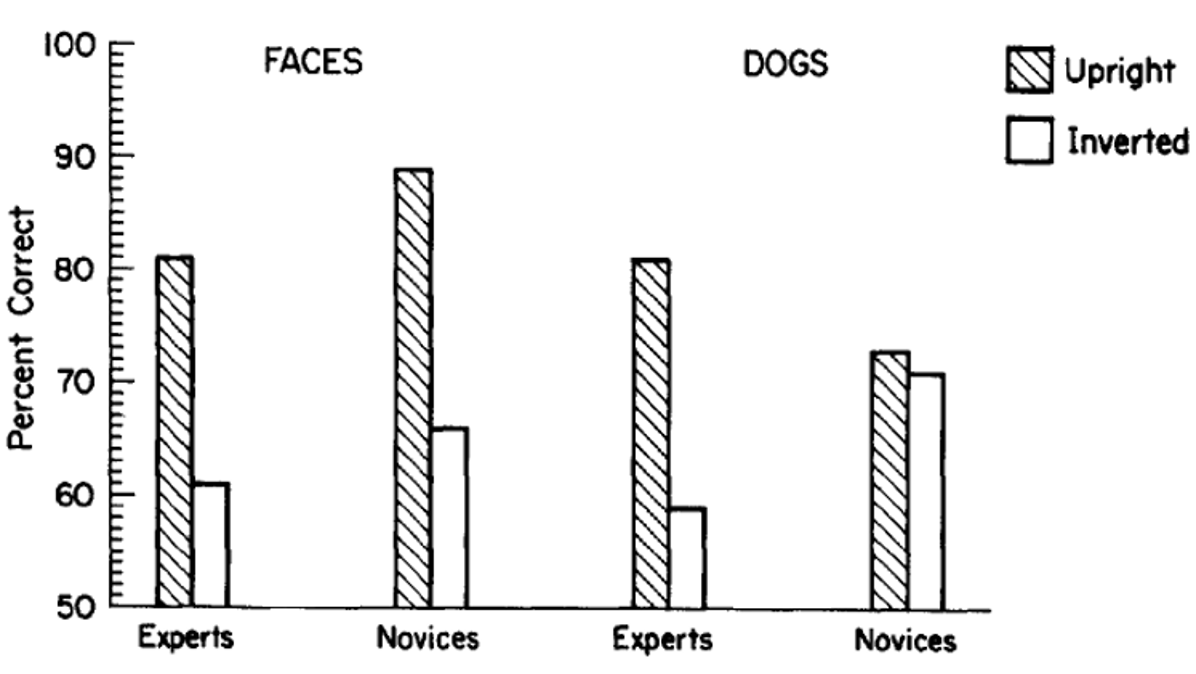
What does this graph show?
That dog experts found there to be a similar inversion effect for dogs and faces.
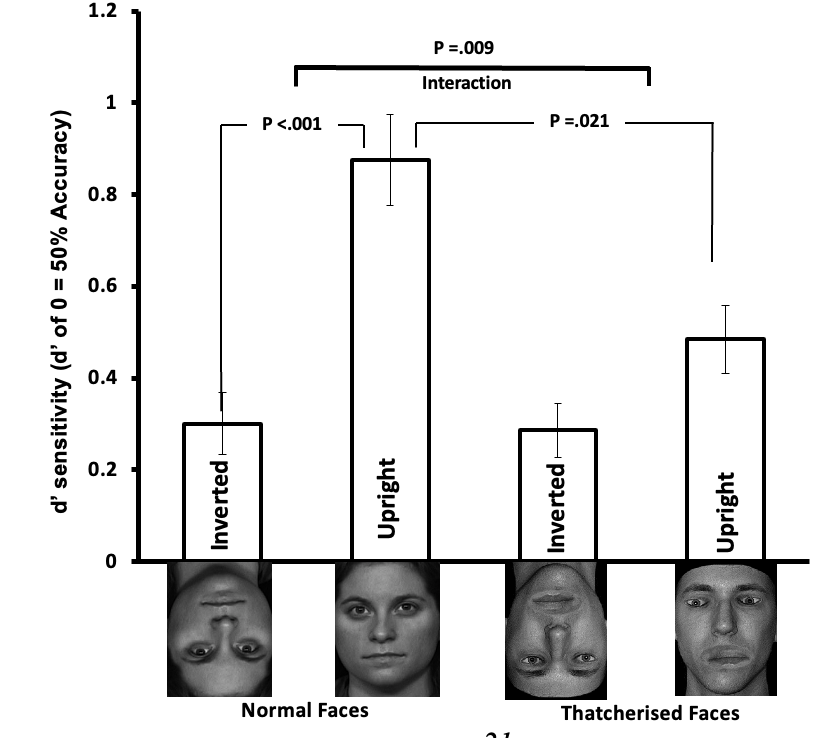
What does this graph mean?
Thatcherising faces led to an overall decrease in recognition but also led to a reduction of the inversion effect.
What does this graph mean?
Shows that chimps have the same inversion effect as humans, whereby when faces are inverted recognition is decreased. However their recognition is increased overall.
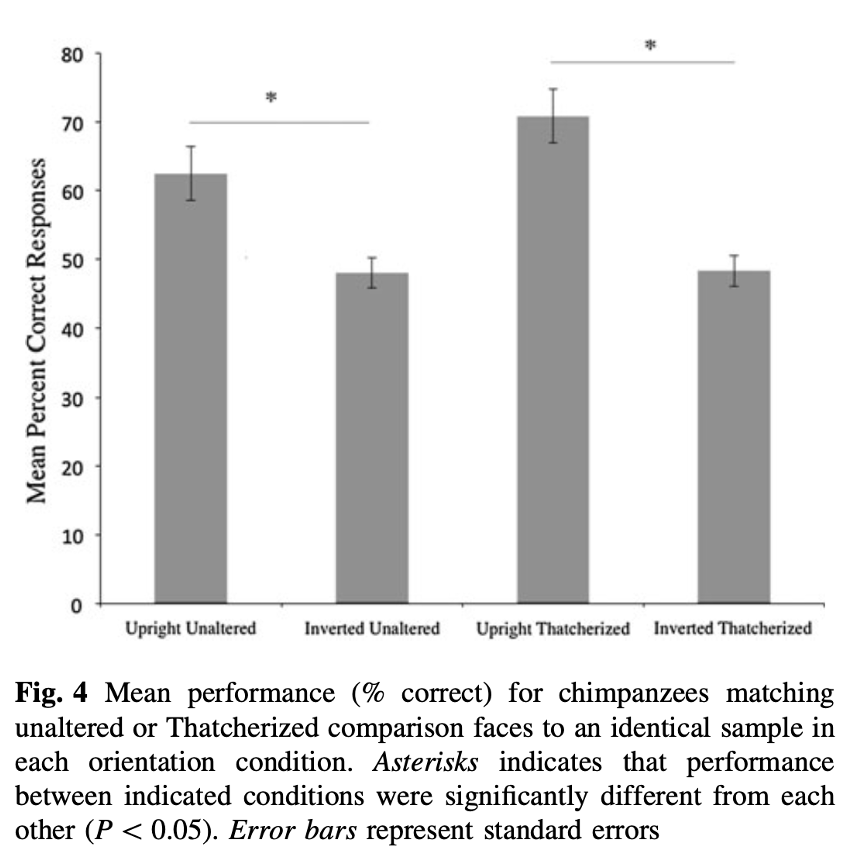
What does this graph suggest?
Chimps had the same performance in both inverted thatcherised and inverted unaltered - shows theyre less affected by this alteration than humans.
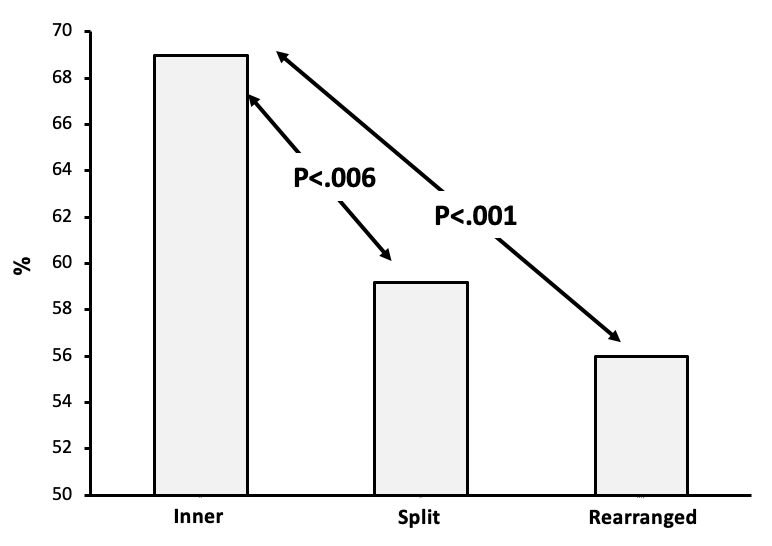
What does this graph mean?
Shows that chimps performed better when the inner features were removed, than when features were split apart and this was better than when features were rearranged.
What does this graph show?
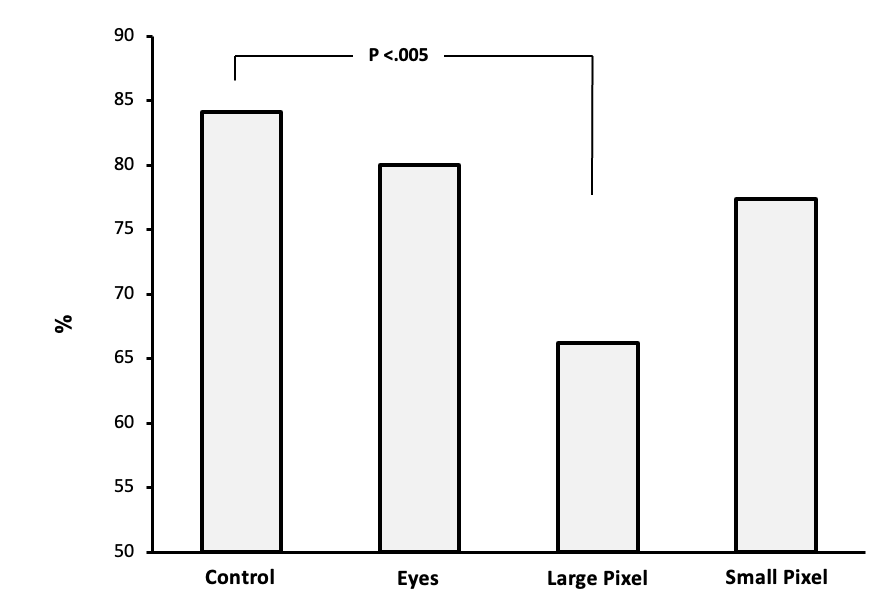
This graph shows that when chimps are shown images with eyes removed, and small pixel theres very little effect on recognition, however, when the images were made up of large pixels chimps recognition largely decreased.
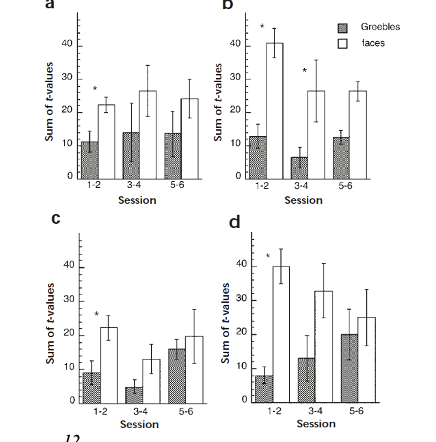
What does this graph show?
Training greebles in four different brain areas showed an increase in activation as training increased.
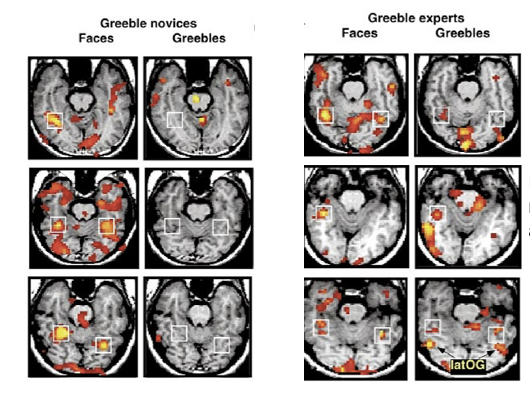
What do these activation maps show?
Those who are experts on greebles have higher activation in FFA’s than those who arent.
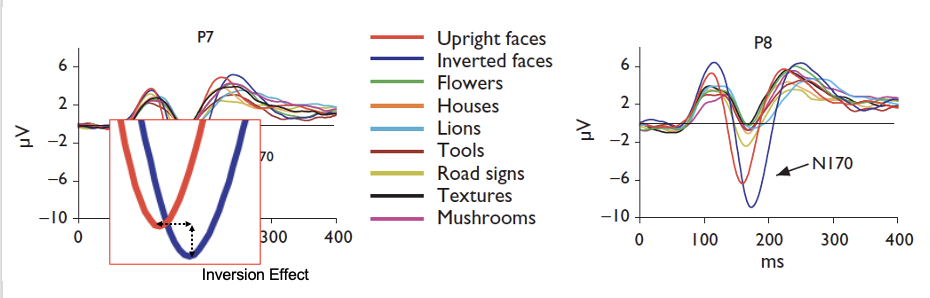
What does this EEG measure show?
Shows inverted faces to have a slower but larger N170 than regular faces.
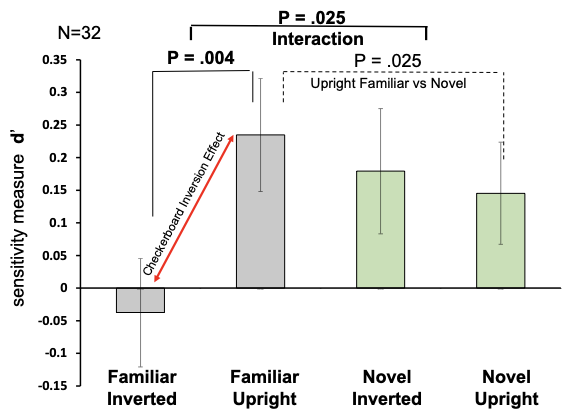
What does this graph show?
This shows a significant inversion effect for familiar inverted checkerboards in comparison to novel checkerboards.
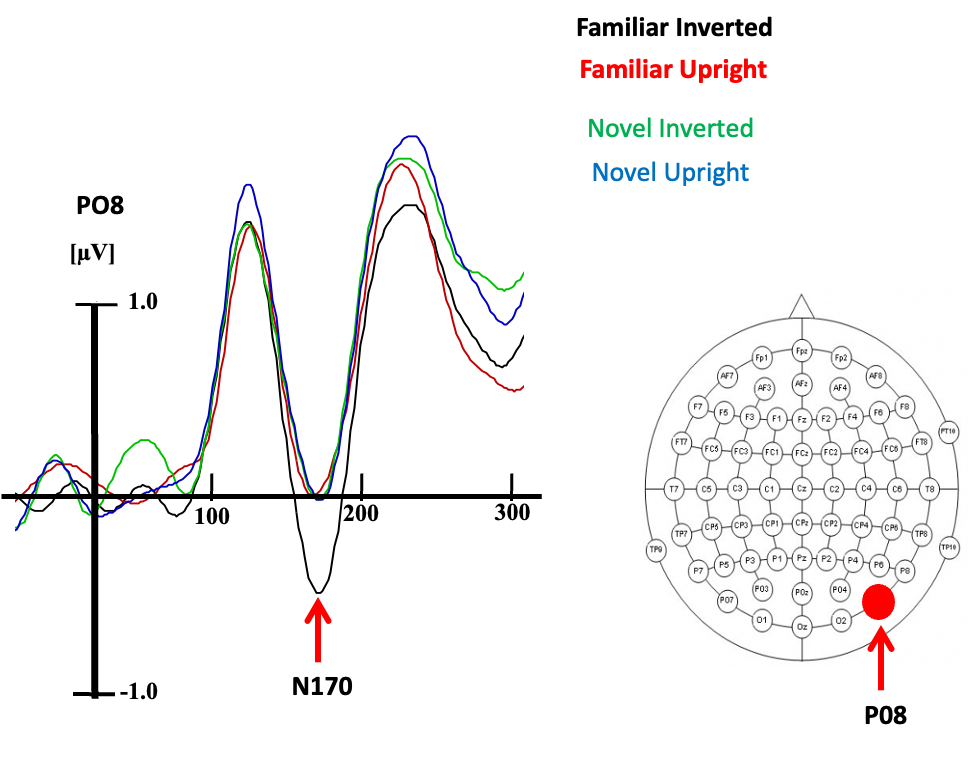
What does this EEG measure show?
Shows inversion effect to be present for familiar checkerboard, with larger and slower N170’s.
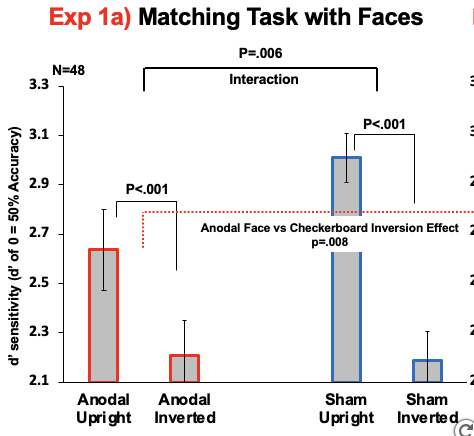
What does this graph show?
This graph shows that giving participants tDCS decreases the inversion effect for faces.
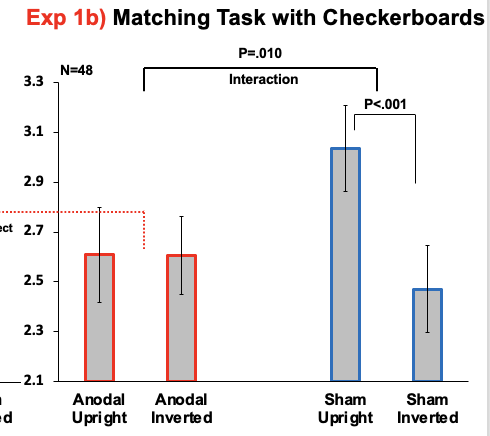
What does this graph show?
This graph shows that giving participants tDCS can lessen the inversion effect with checkerboards.
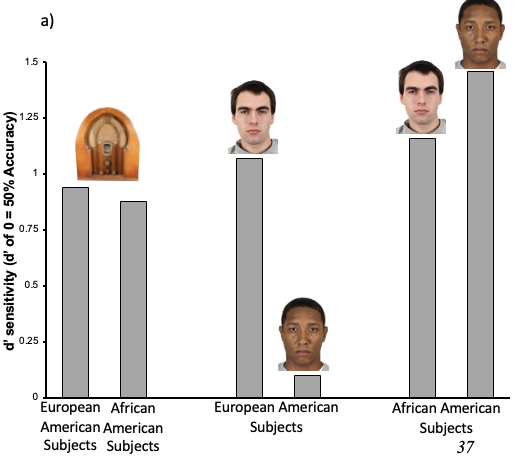
What does this show?
This graph shows that while African American subjects can recognise their own race faces and other race faces, Caucasian individuals could not.
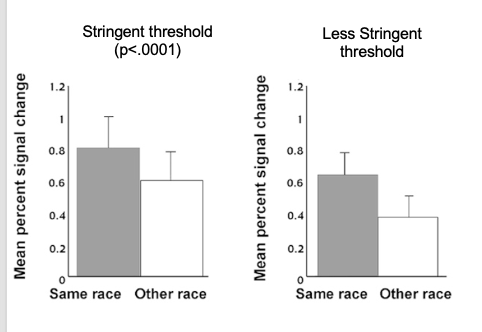
What does this show?
This shows that there is an increase in signal changes for own race faces compared to other race faces, showing increased activation for own compared to other.
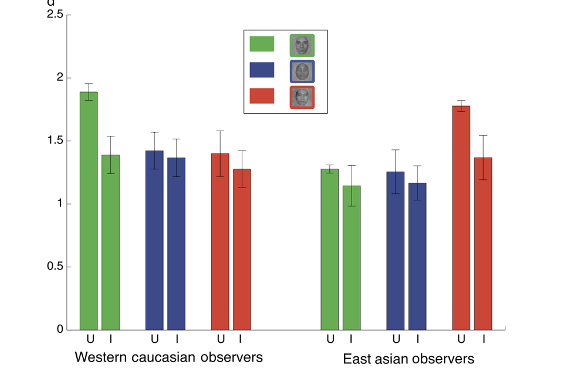
What does this graph show?
Shows better recognition of own race faces, but additionally shows an increased inversion effect for own race faces compared to other race faces.
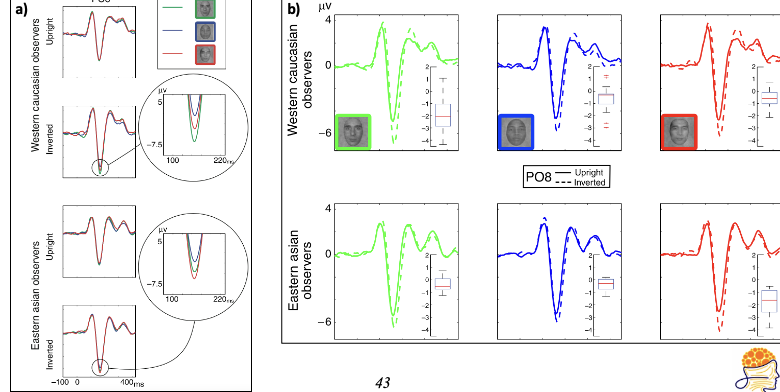
What does this show?
This shows that same race faces were most likely to modulate the N170 - shows inversion effect only present for same race faces.
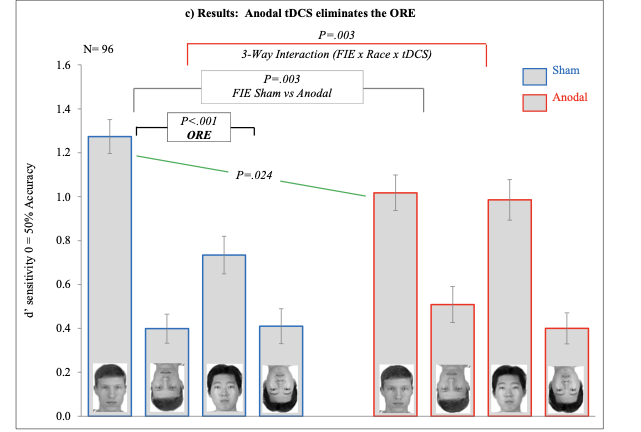
What does this mean?
This shows that the own race inversion effect was largely reduced in the anodal condition - thus indicating disruptioN to the ORE.
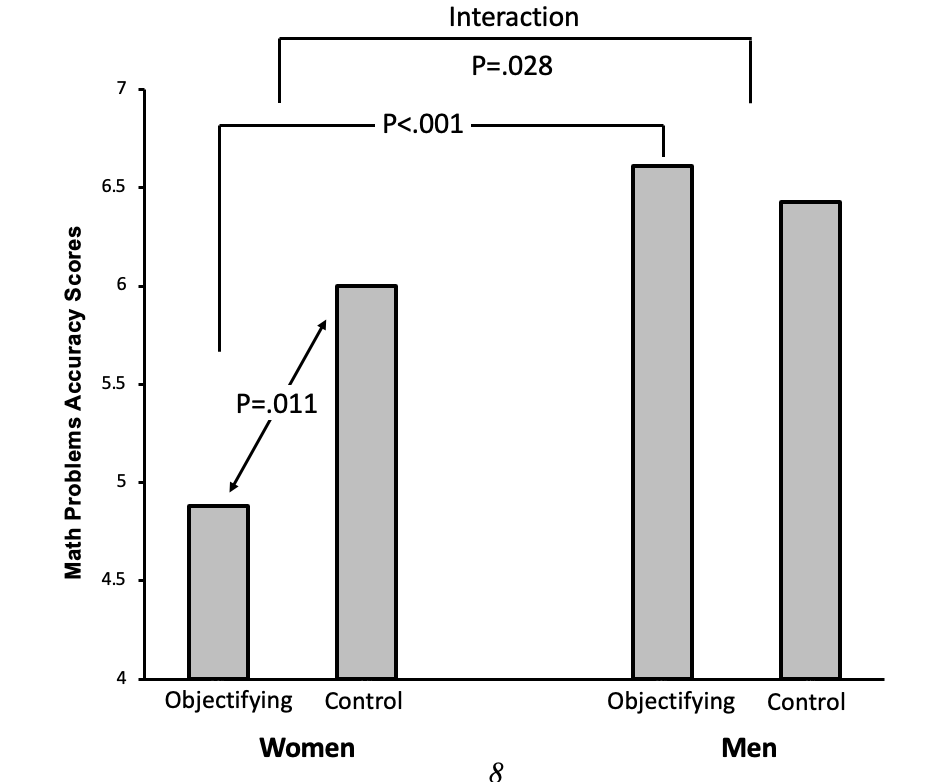
What does this graph?
This shows while women perform below men overall, this significantly decreased in the objectifying condition - showing when objectified women perform less well on maths tasks.
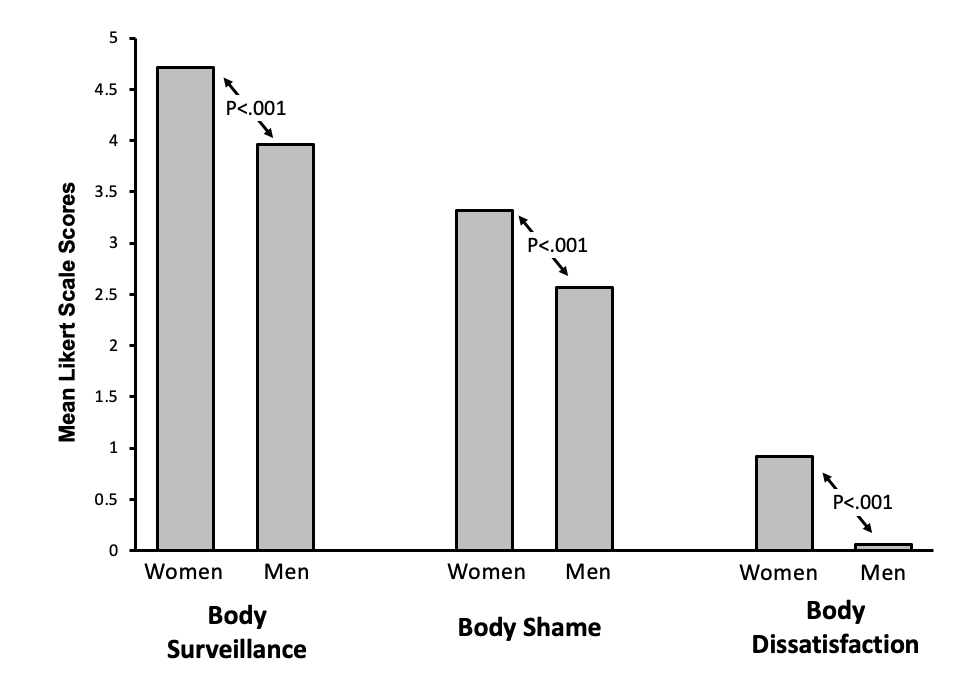
What does this graph show?
This graph shows women to score higher across all measures of body objectification: shame, survaillance and dissatisfaction - the effect was also significant.
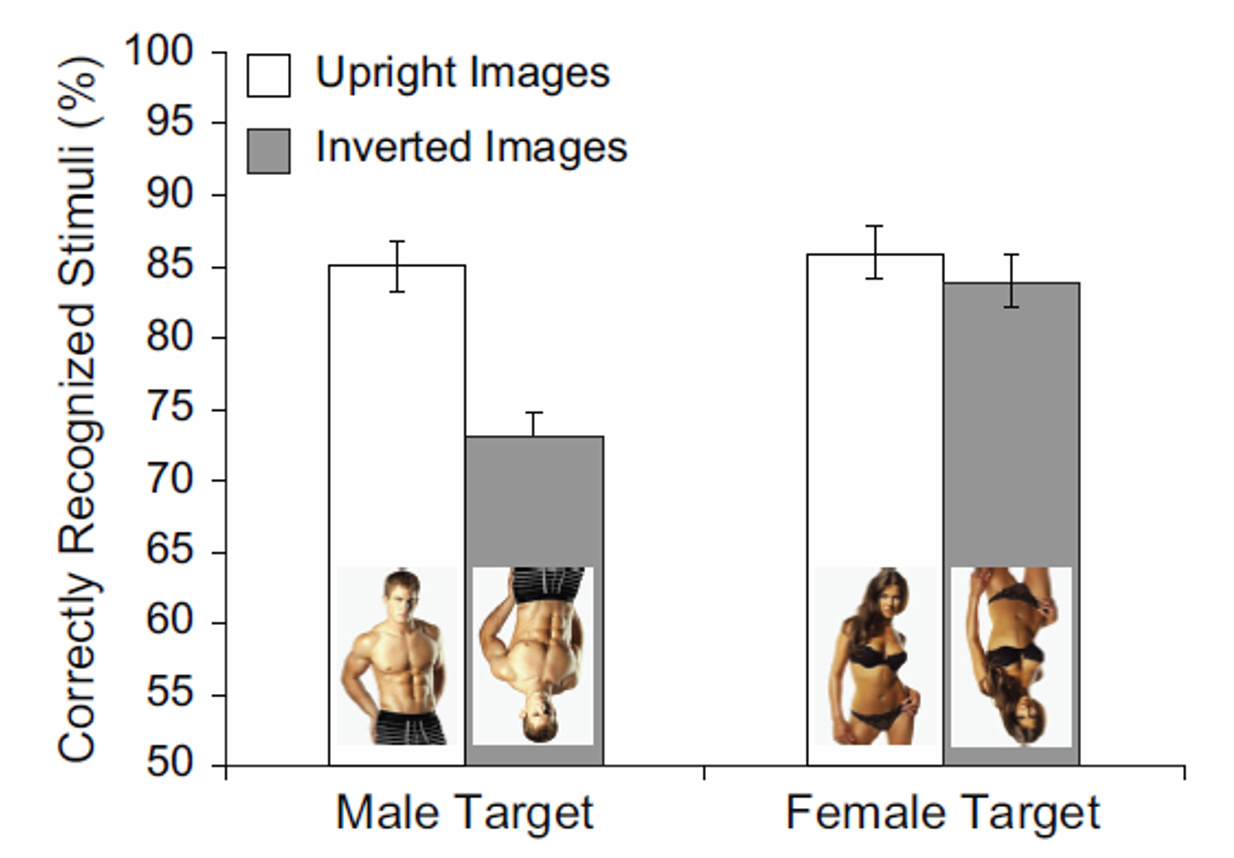
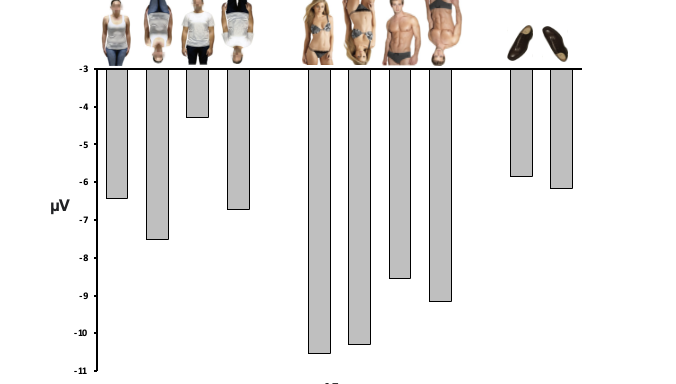
What does this mean?
This shows the inversion effect was mostly present for images of women, not so much for images of men.
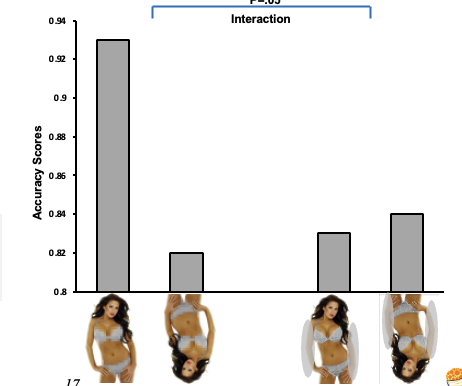
What does this graph show?
This shows that by blurring the sexualised body parts of women the inversion effect increases.
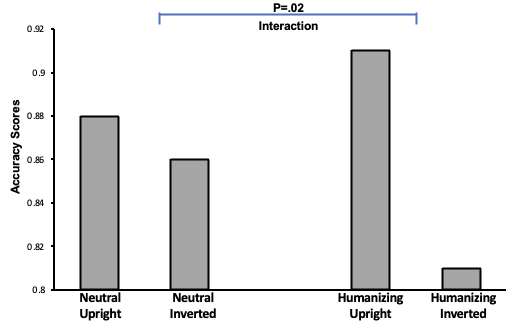
What does this show?
this graph shows that by giving sexualised women humanising backstories, it leads to the inversion effect returning.
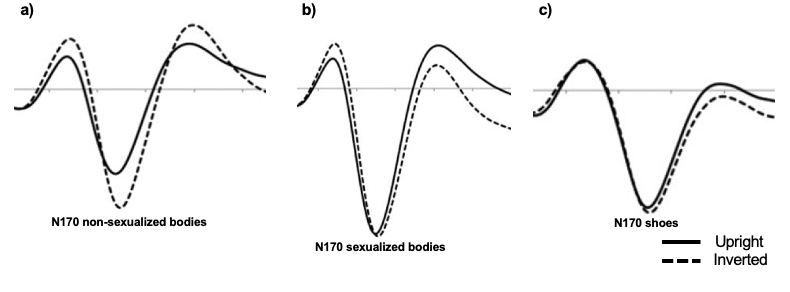
What do these EEG’s show?
These show that sexualised bodies show a larger N170 overall, with it additionally showing sexualised bodies to not emphasise any factors surrounding the inversion effect.
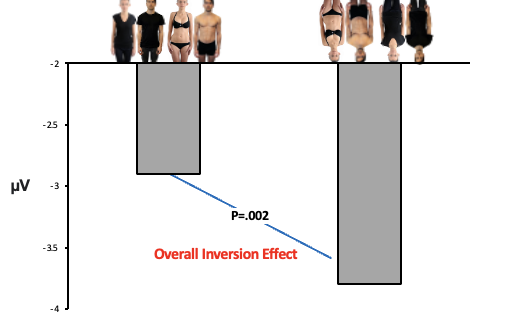
What does this graph show
Shows women to consistently have a lack of inversion effect compared to men and objects.
What does this graph show?
This shows that when bodies are in neutral positions, the inversion effect reappears, despite the skin-to-clothing ratio being low.
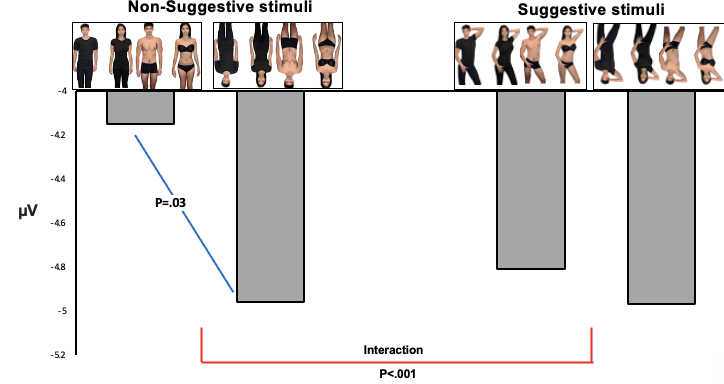
What does this graph show?
This shows that suggestive positioning alone governs the sexualised body hypothesis, as here we see with high or low skin-to-clothing ratios, suggestive positioning shows very little inversion effect.
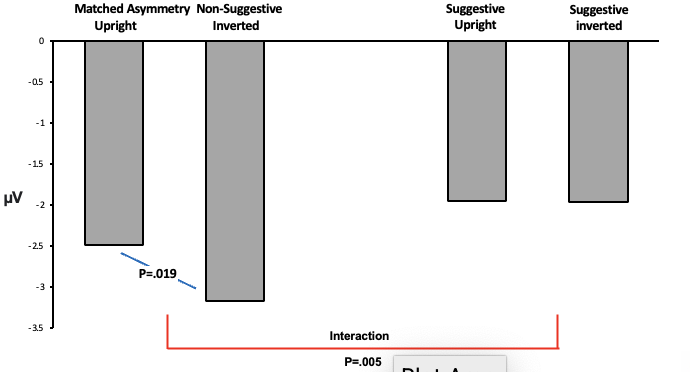
What does this graph show?
Here we see that it is not just assymetry which causes suggestive positioning to diminish the inversion effect, but it is the positioning alone.
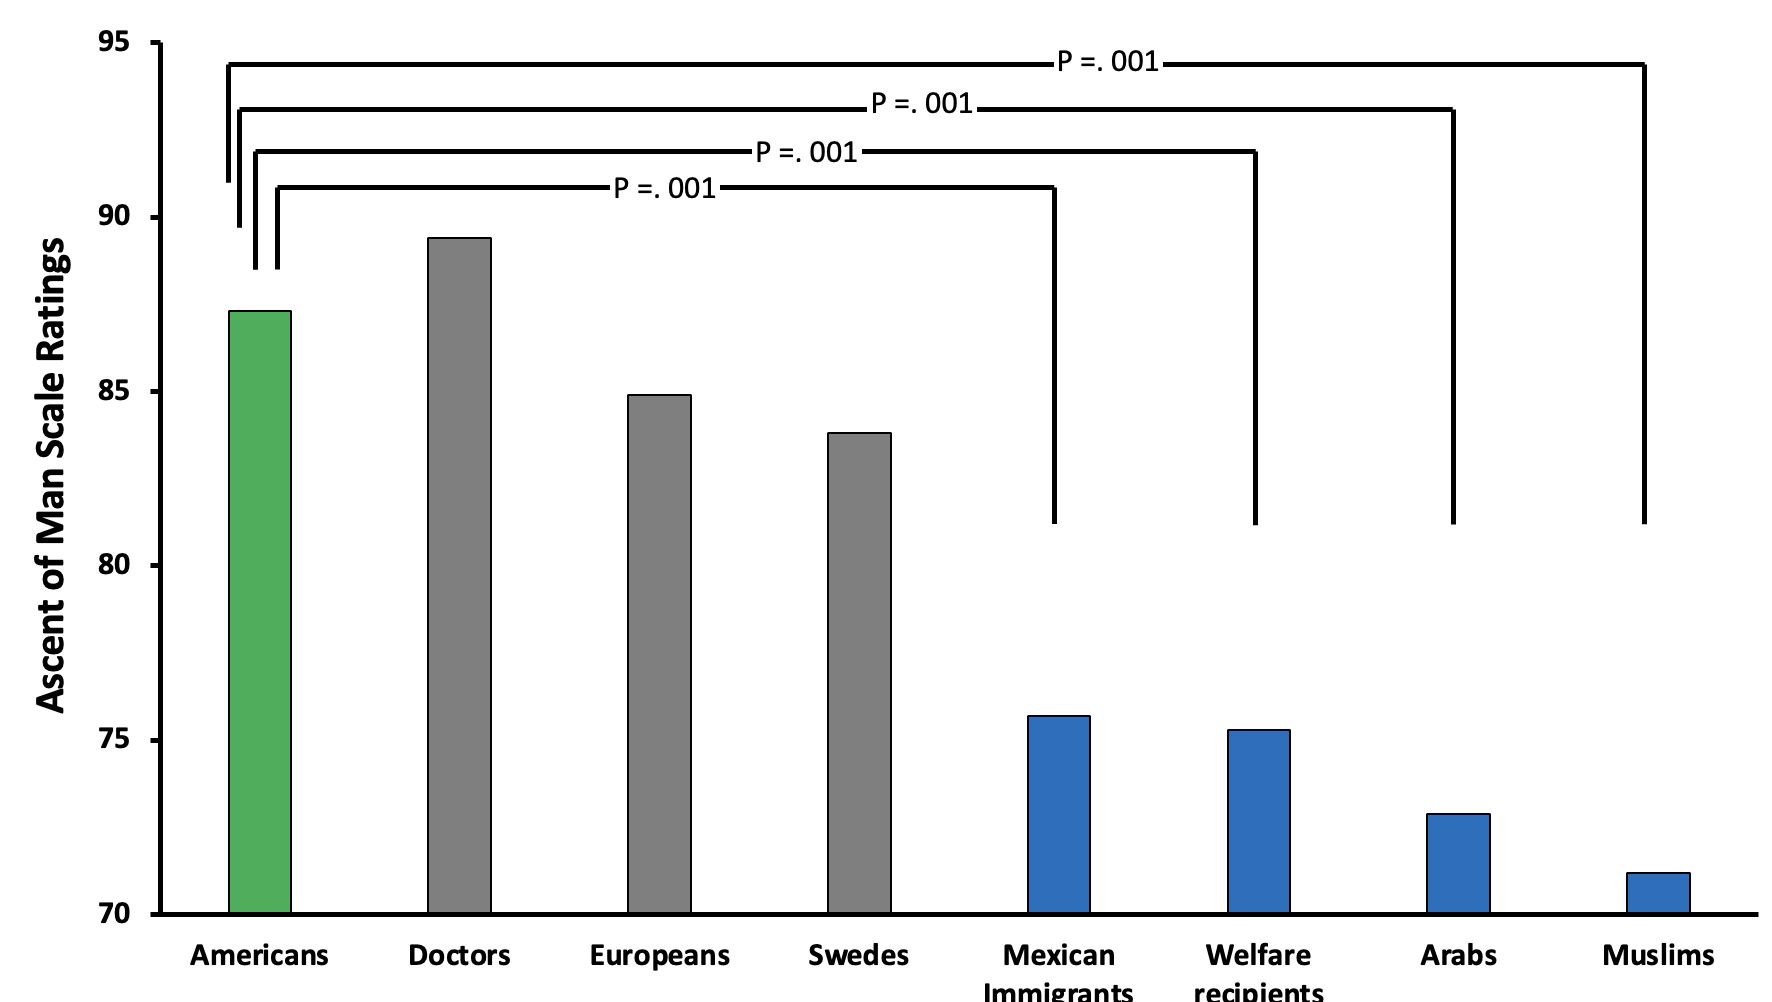
What does this graph mean?
This graph shows that muslims and arabs are rated the least evolved.
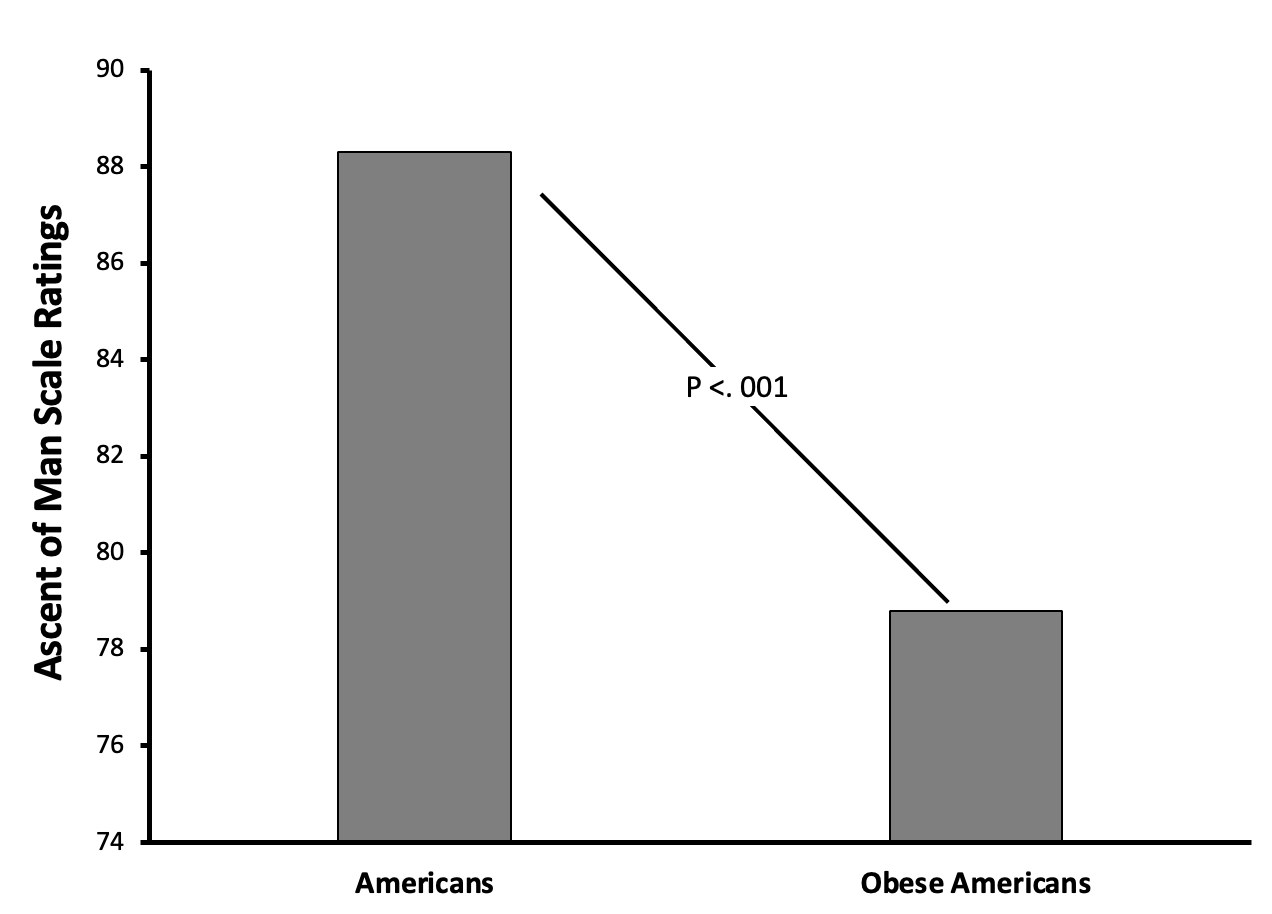
What does this show?
This graph shows obese Americans to be rated as significantly below Americans in the scale of evolution.
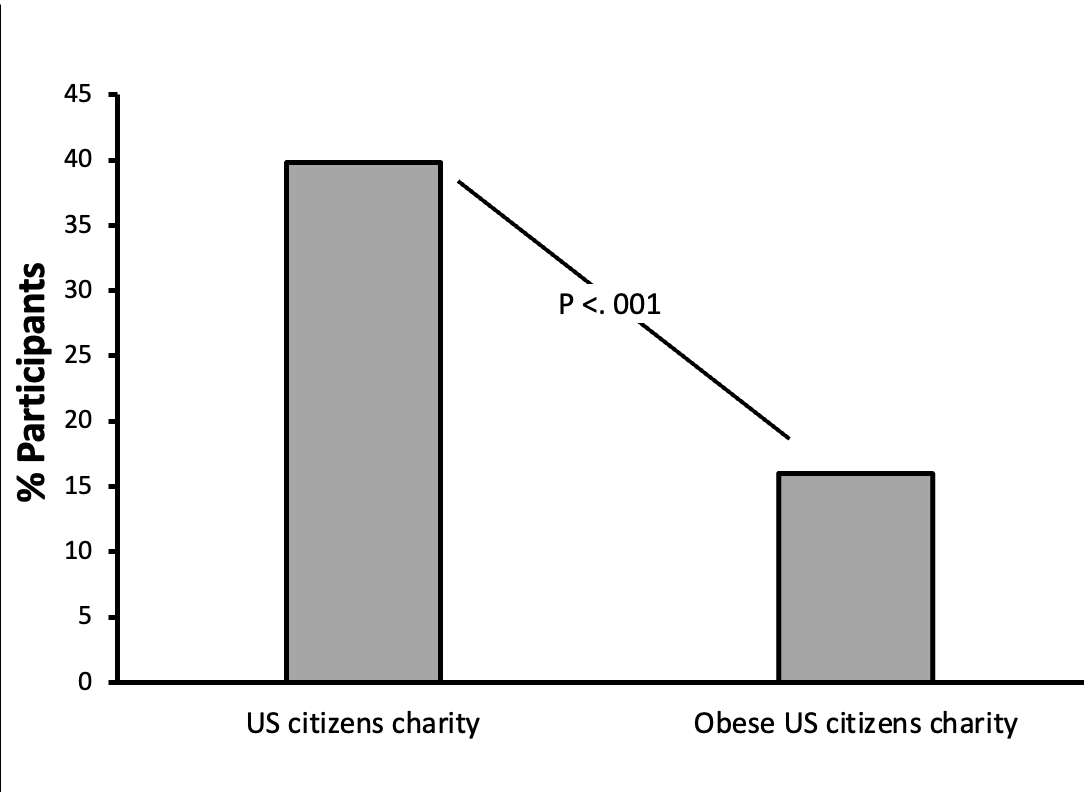
What does this graph suggest?
Shows people were more likely to donate to the US citizens charity than to the obese US citizens charity.
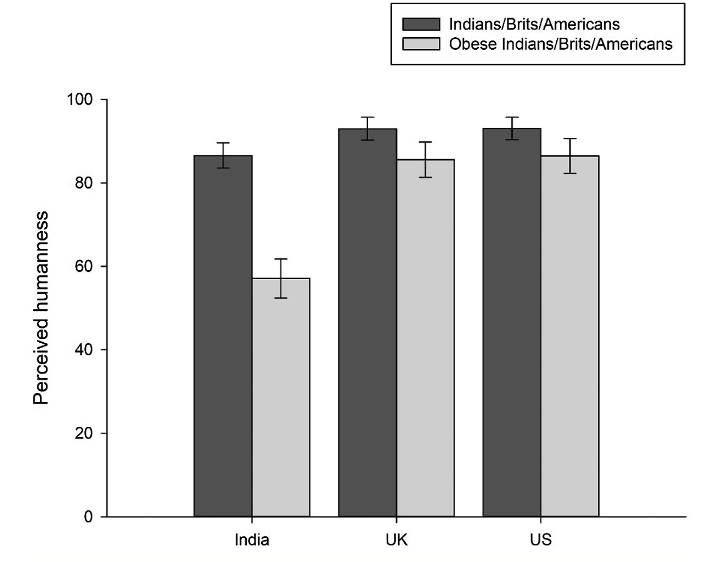
What does this show?
All obese individuals (India, US, UK) were rated as significantly less evolved than typical indiviudals.
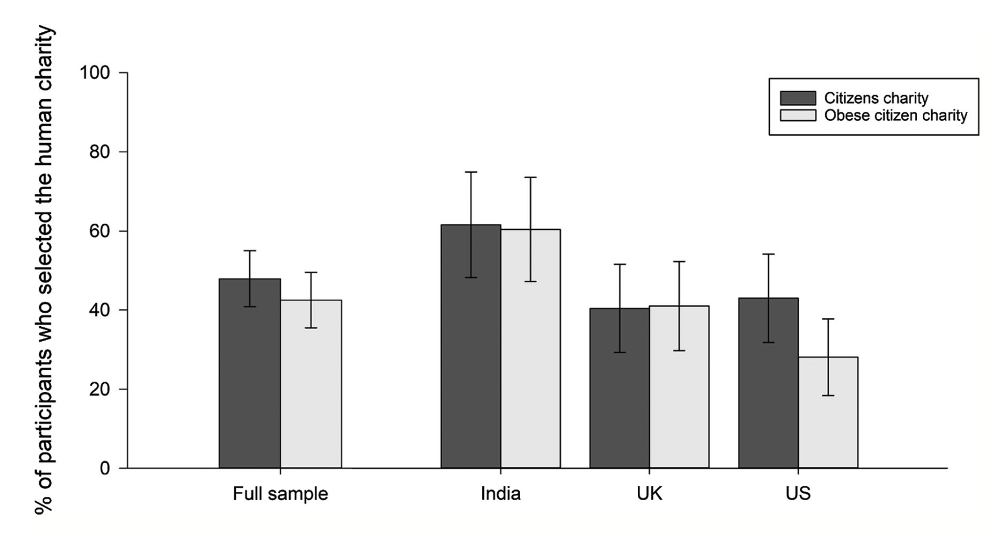
What does this show?
This shows that individuals were more likely to donate to typical citizens as opposed to obese, across all countries.
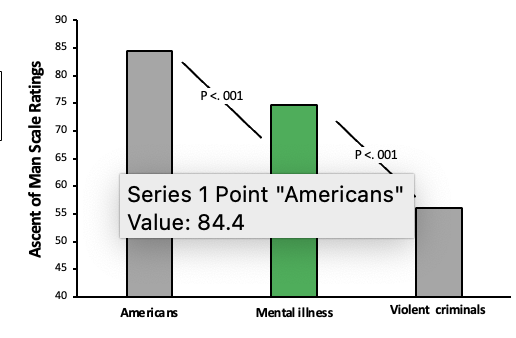
What does this show?
Mentally ill individals were rated below Americans and just above violent criminals.
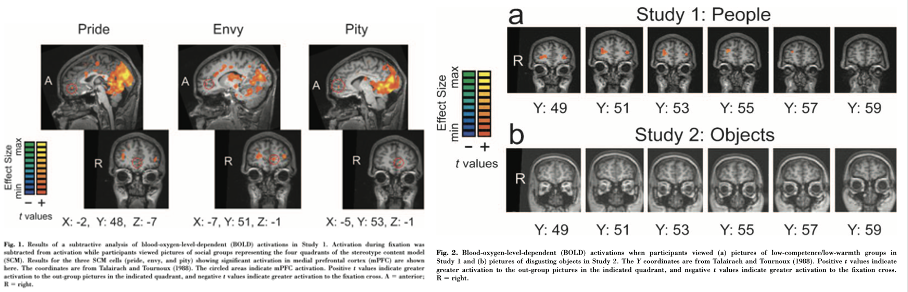
What does this show?
Shows disgust was highlighted in the amygdala and insula, showing they saw those who gave ‘disgust’ as disgusting objects. Also disgusting objects showed no MPFC reaction.
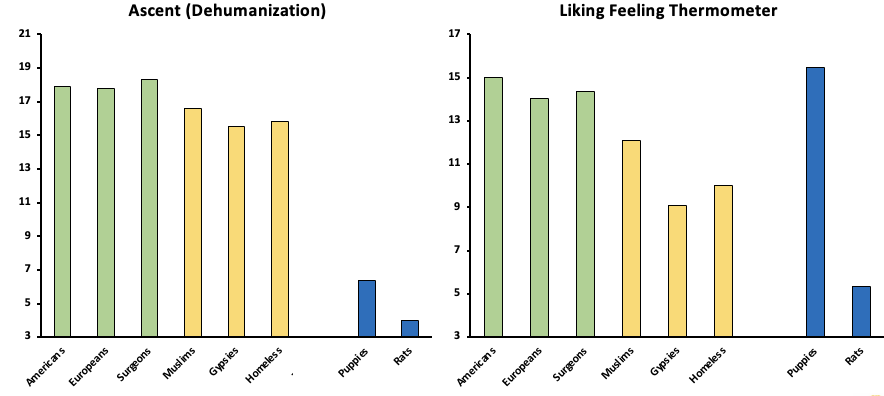
What does this mean?
Low status individuals were more disliked and seen as more dehumanised.
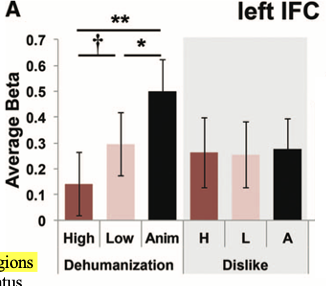
What does this show
This shows activation for low status indivduals to be higher in left IFC - indicating dehumanisation.
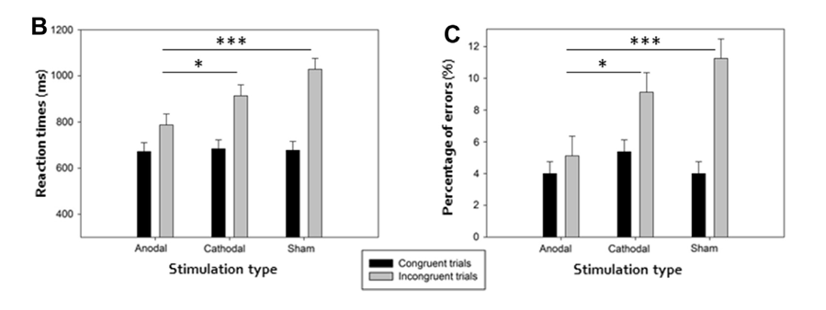
What does this graph show?
Shows that giving participants tDCS can decrease the effects of implicit biases.
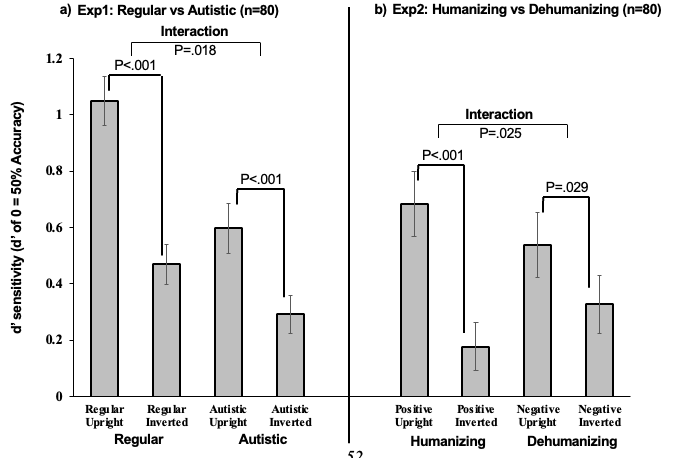
What does this graph show?
Here we can see the effects of using words autistic and normal. where there is a lessened inversion effect for autistic faces. Alternatively the humanising condition can be seen to show an increase in the inversion effect.
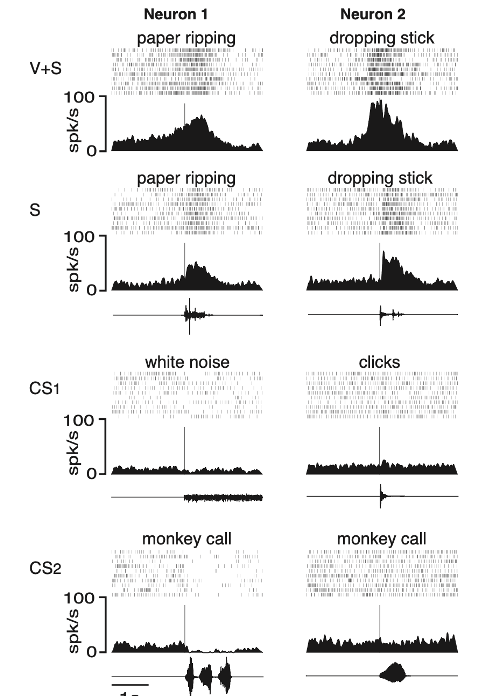
What do these show?
They show how different neurons respond to the given sound / vision of watching/listening to given things.
What does this suggest?
Shows activation in given areas of the brain based on watching the actions. Brain has multiple mirroring systems
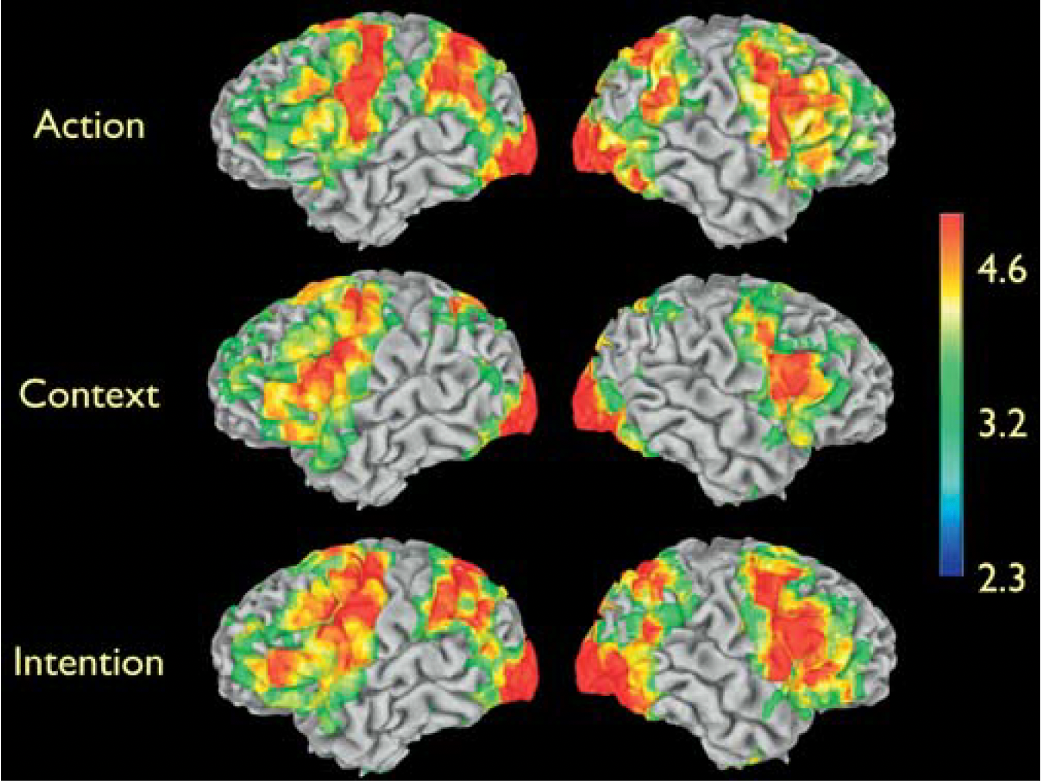
What does this show
Shows when watching action, context and intention clips theres activity in PMC, occtipitcal, parietal, temporal and frontal lobes.
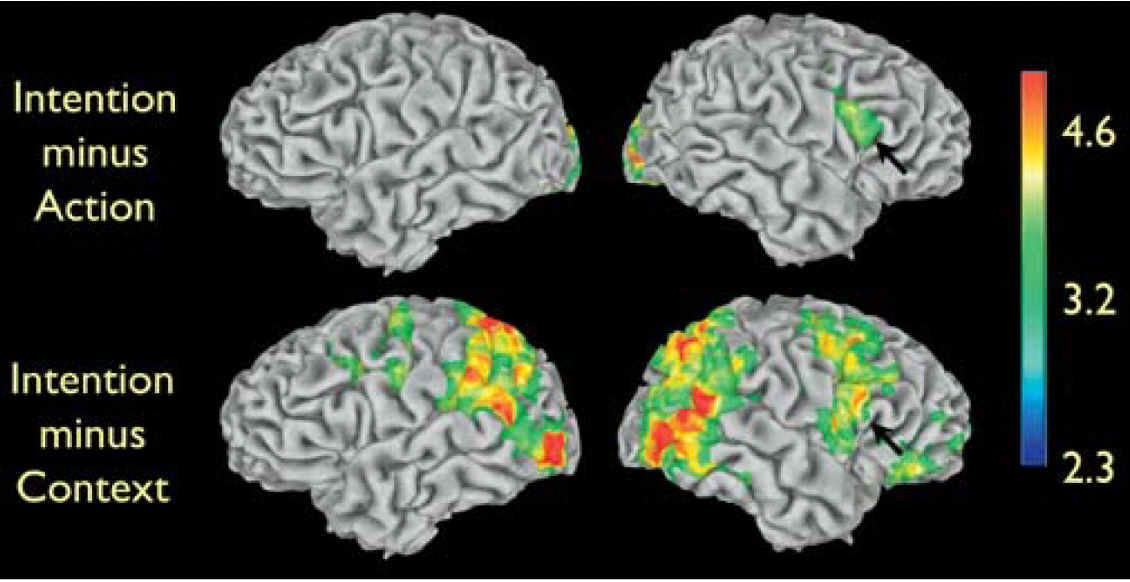
What does this show?
This shows intention without action to activate less areas. But without context isnt so bad.
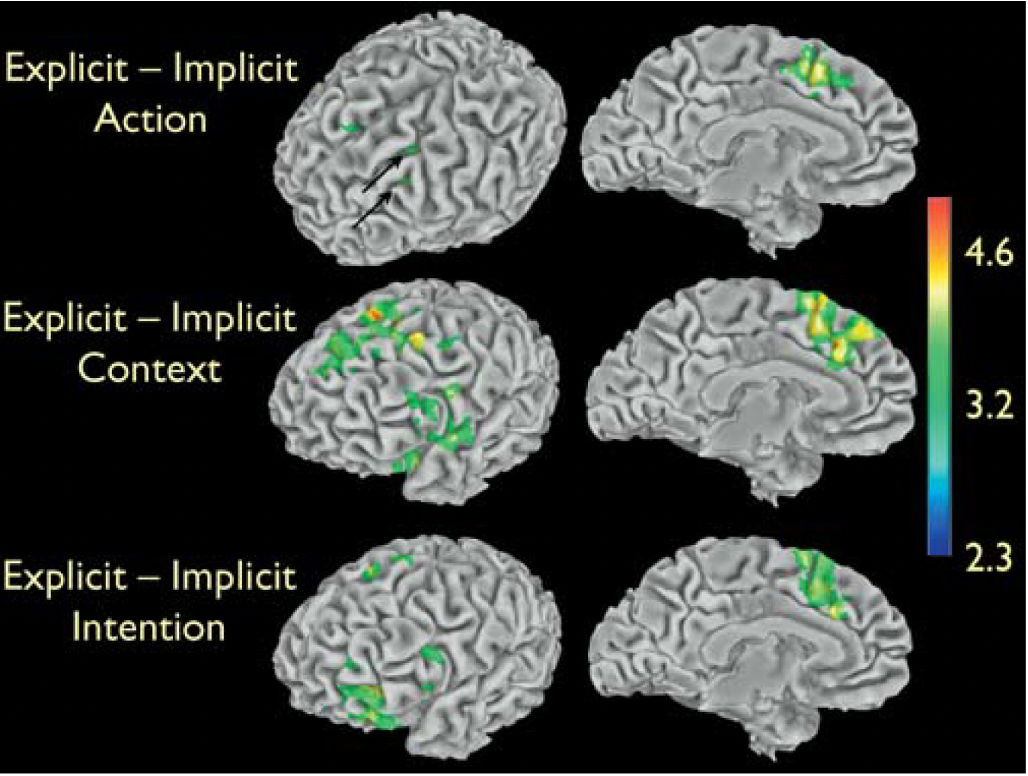
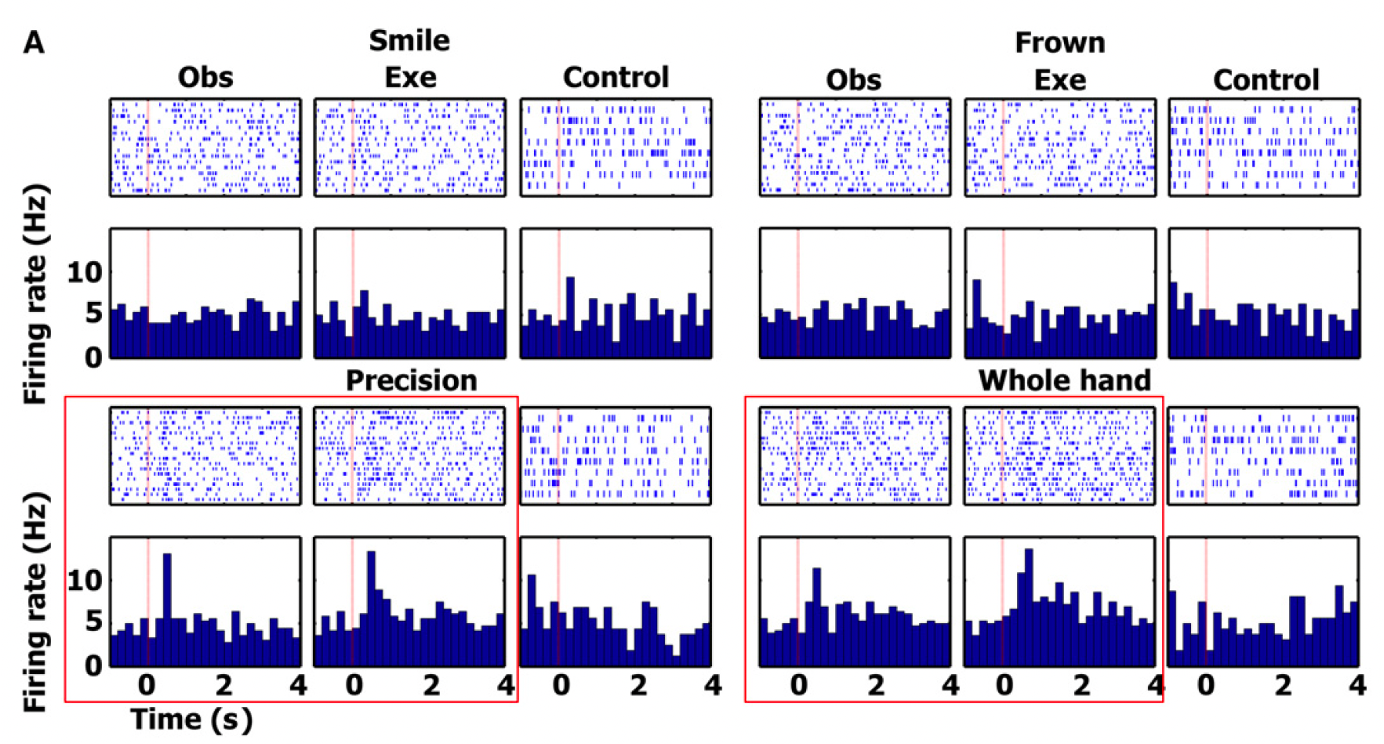
what does this show?
Explicit showed more activity of cognition, implicit here indicates more automatic forms of processing.
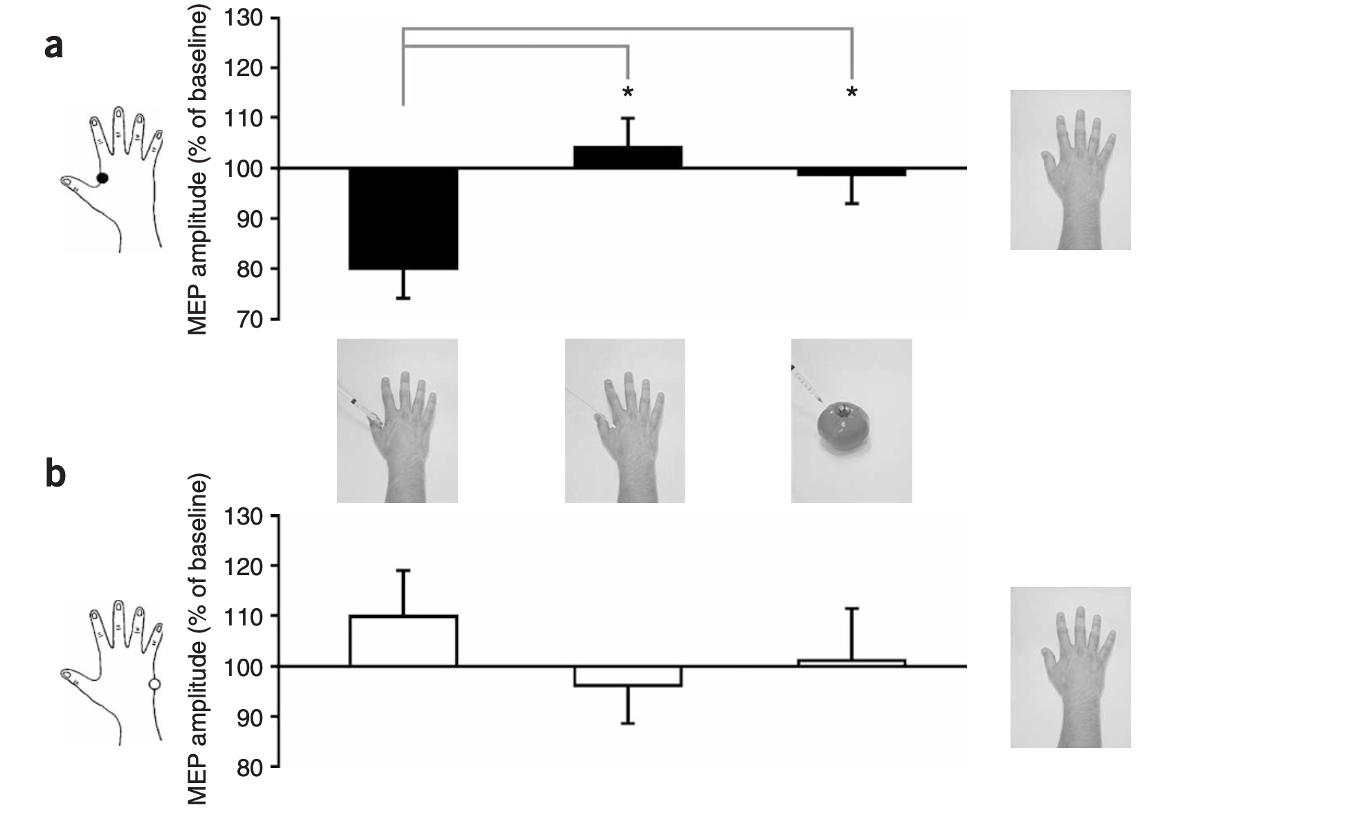
what does this show?
This shows that needles condition on the FDI muscle showed decreased MEP’s, however on the ADM - no response.
What does this suggest?
This shows no significant effect of MEPs on either the FDI or ADM muscles.
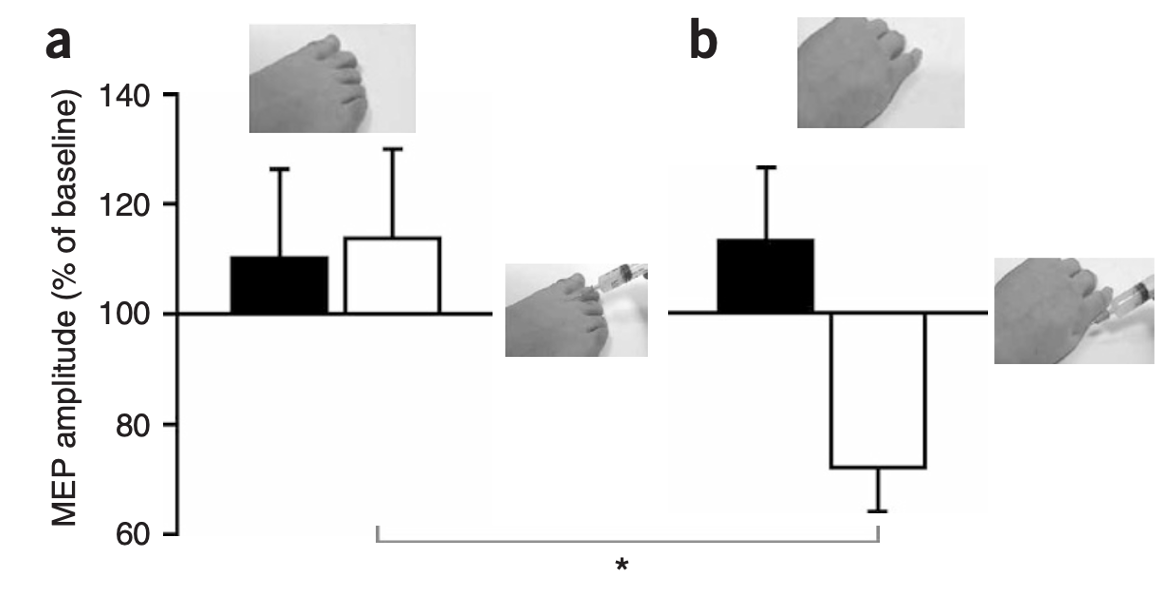
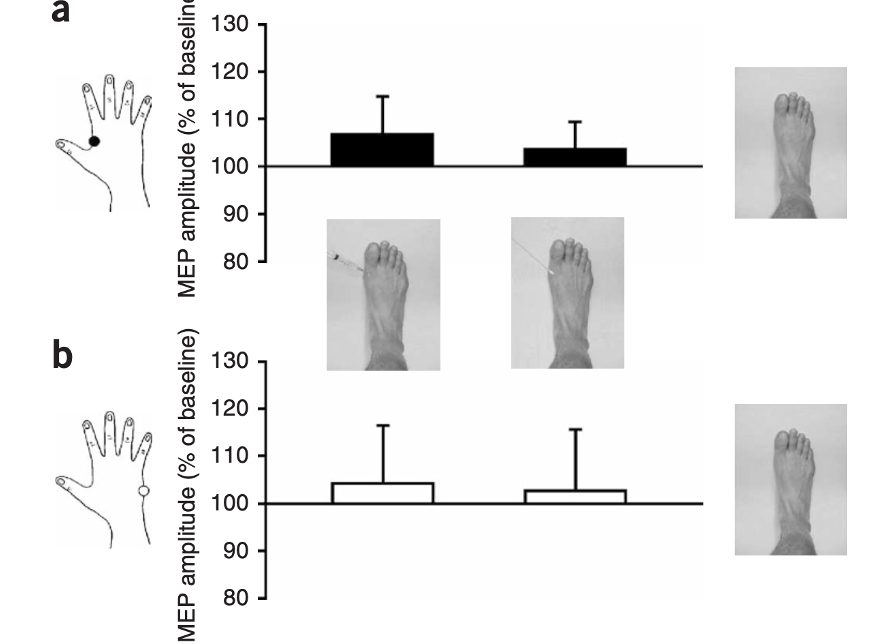
What does this show?
Shows no significant effect for any of the given conditions, needle in foot or hand
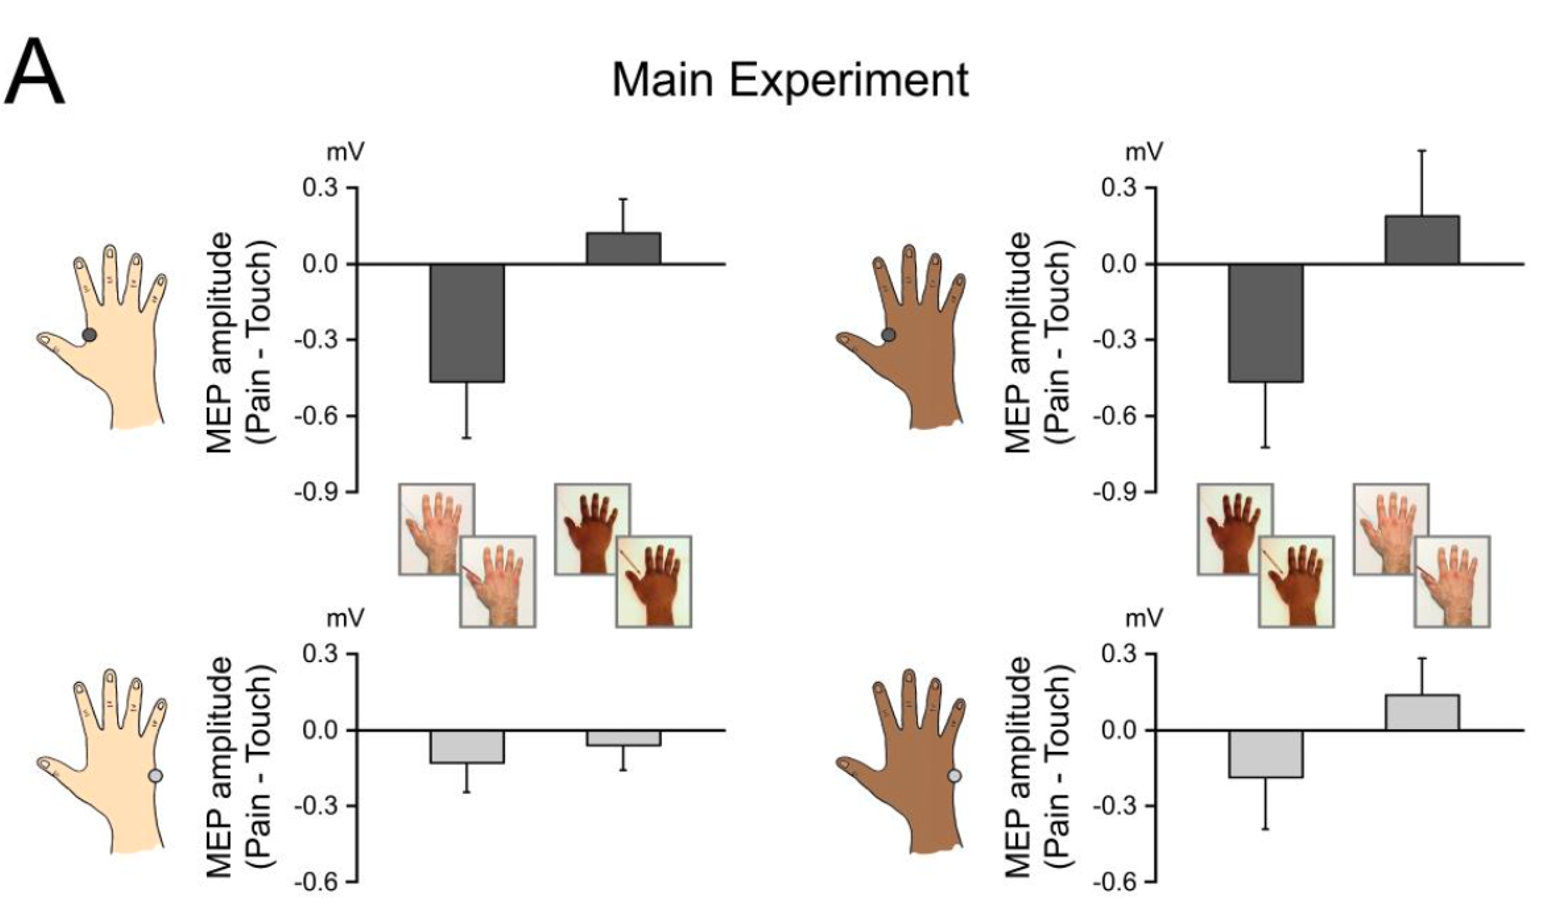
What does this mean?
Found that there was a greater decrease of activation in FDI muscle when watching ingroup models - no effect for outgroup.
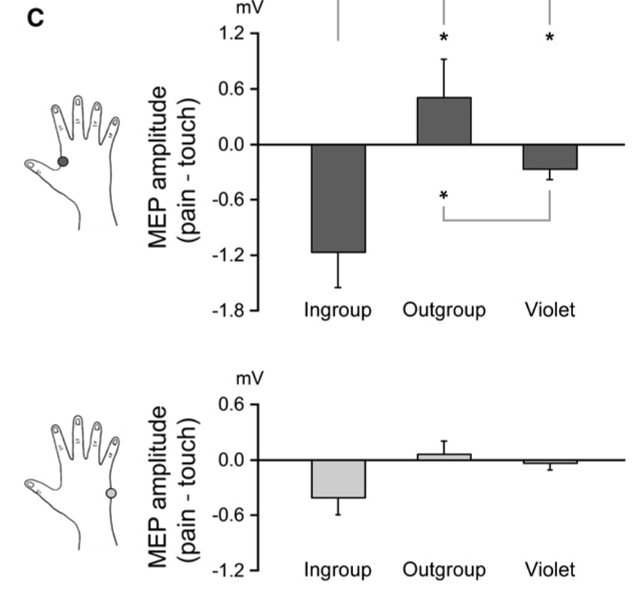
What does this mean?
Inhibition of FDI for the violet hand group was increased more than that for the outgroup.
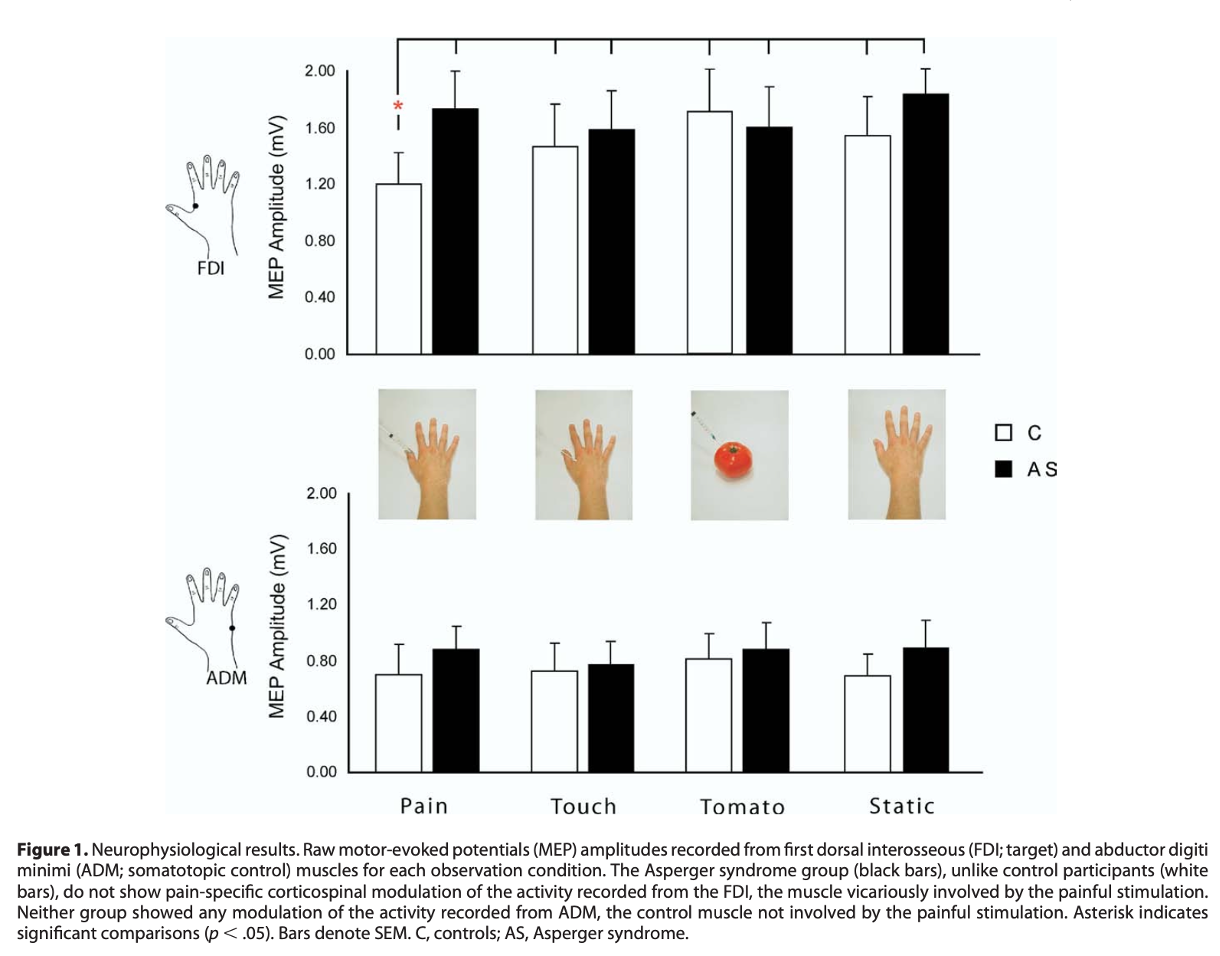
what does this mean?
It was found participants with aspergers, after being given TMS in the FDI can give participants same emotional reactions.
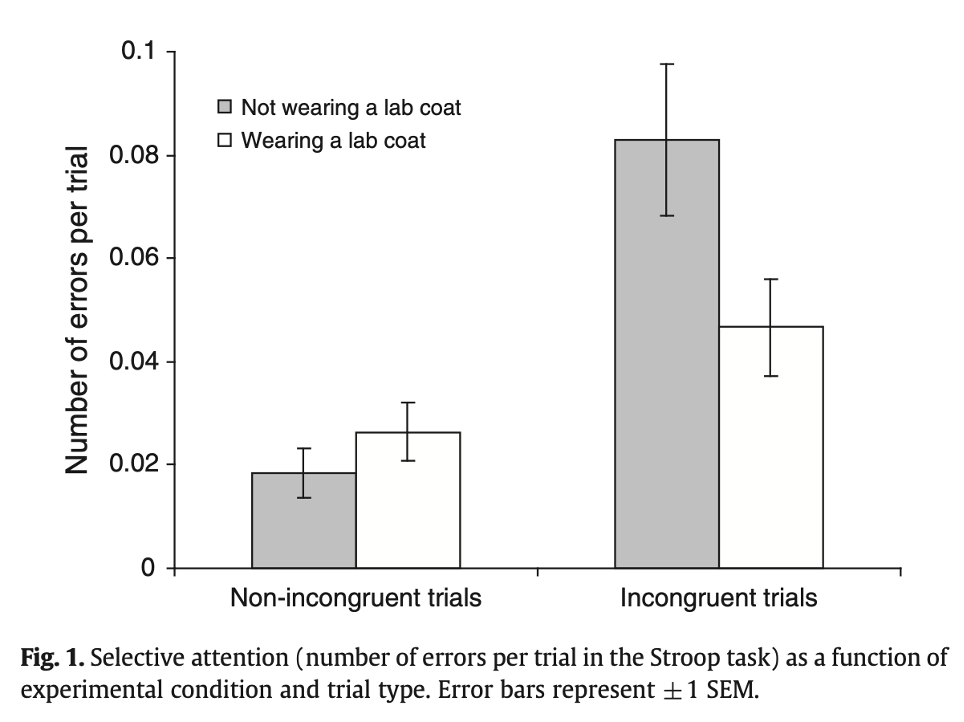
What does this mean?
This shows participants wearing a lab coat made less errors than those not wearing a lab coat.
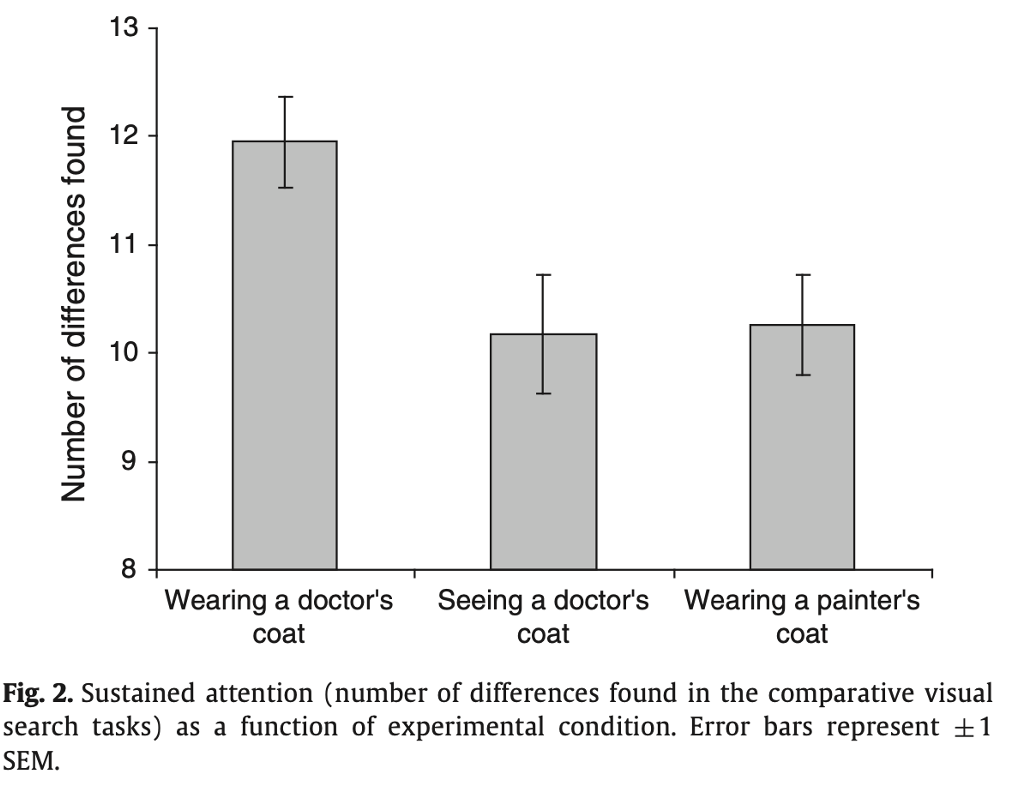
What does this mean?
Wearing and seeing a ‘doctors coat’ increased correct answers on a comparitive search task in comparison to wearing a painters coat.
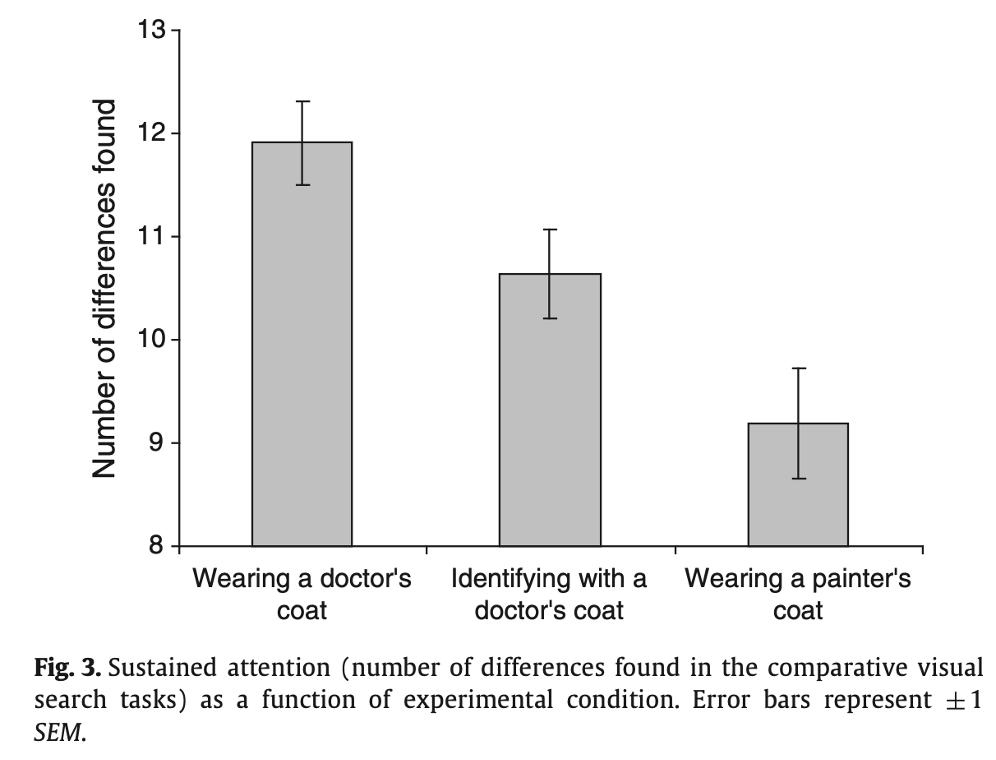
What does this graph mean?
Wearing and identifying with a doctors coat led to improved performance in comparison to wearing a painters coat.
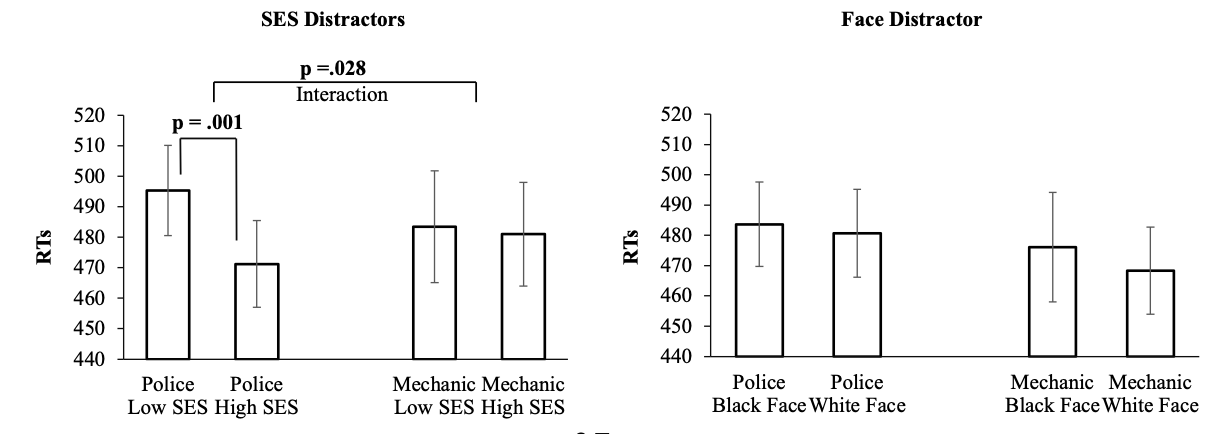
what do these graphs show?
Shows wearing a police uniform leads to being distracted more by low SES than high SES.
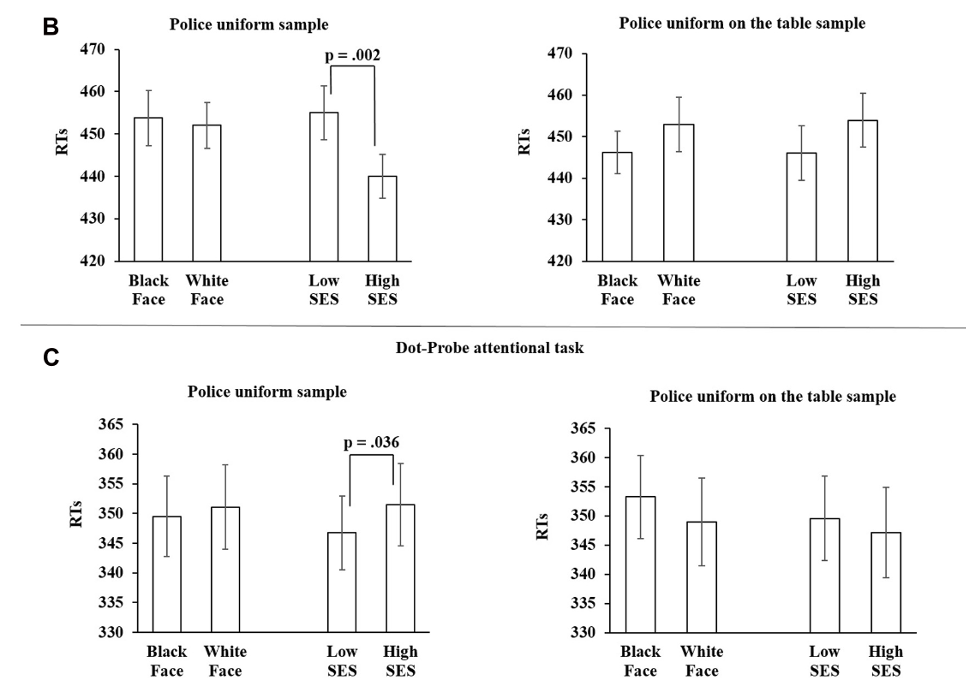
What do these graphs show?
This graph shows that participants need to be wearing the police uniform in order to show the effects of being distracted by low SES.
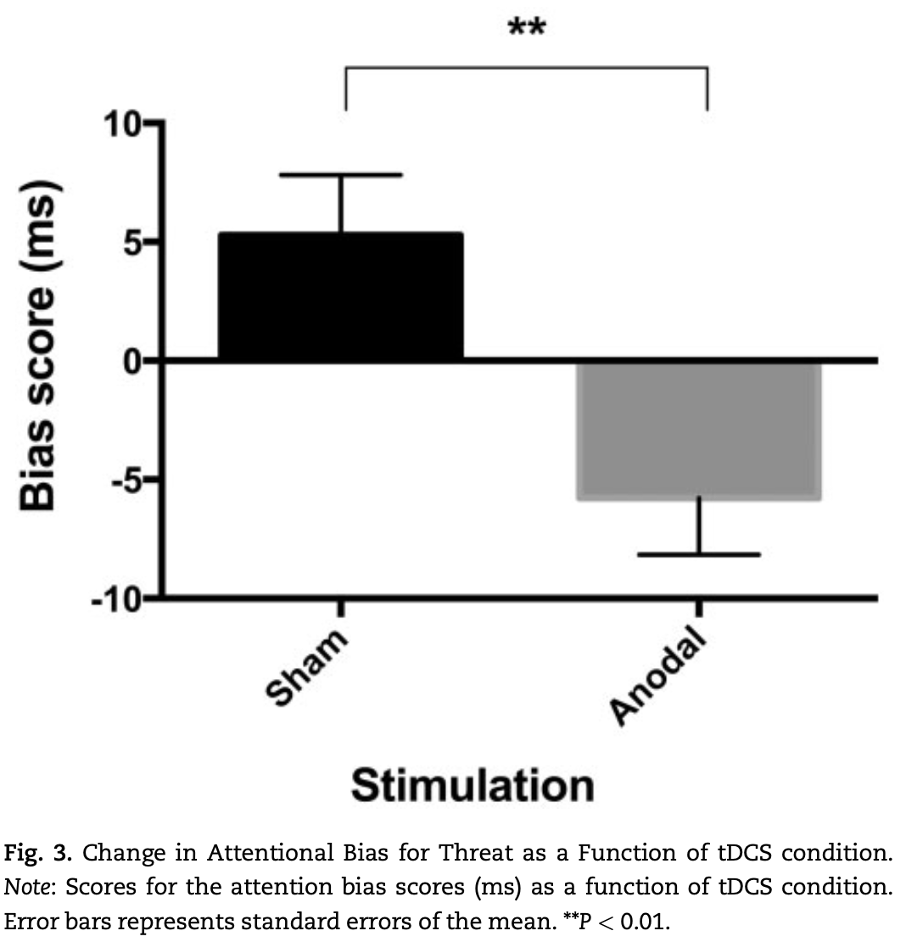
what does this show?
Shows that giving tDCS to individuals with SAD can decrease their bias for threat, can reduce distractions.
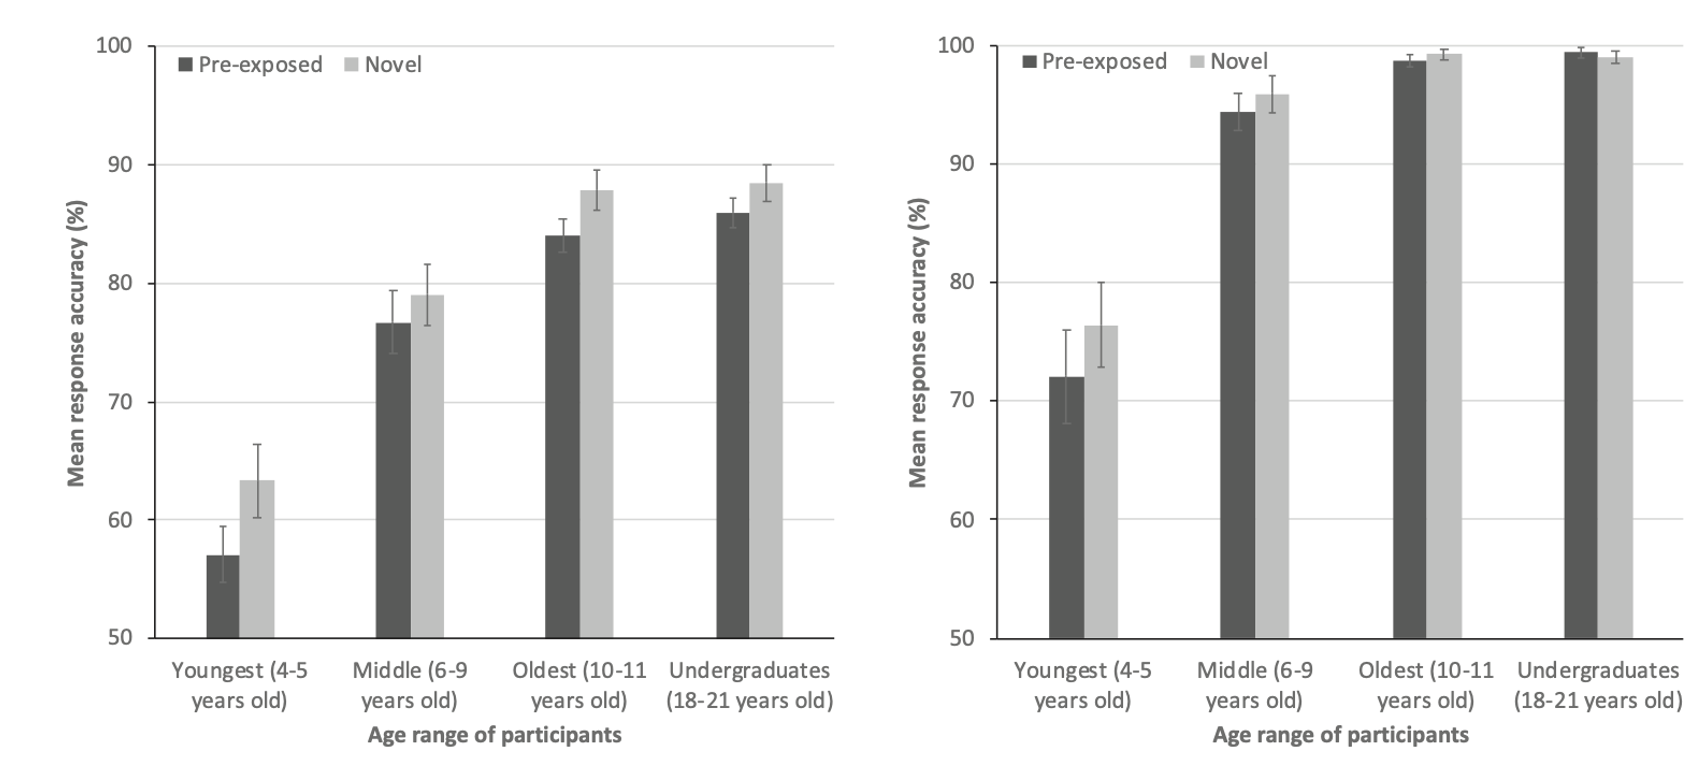
What does this show?
This graph suggests that 4-5 year olds struggle with correct responding if they have been previously exposed to info.
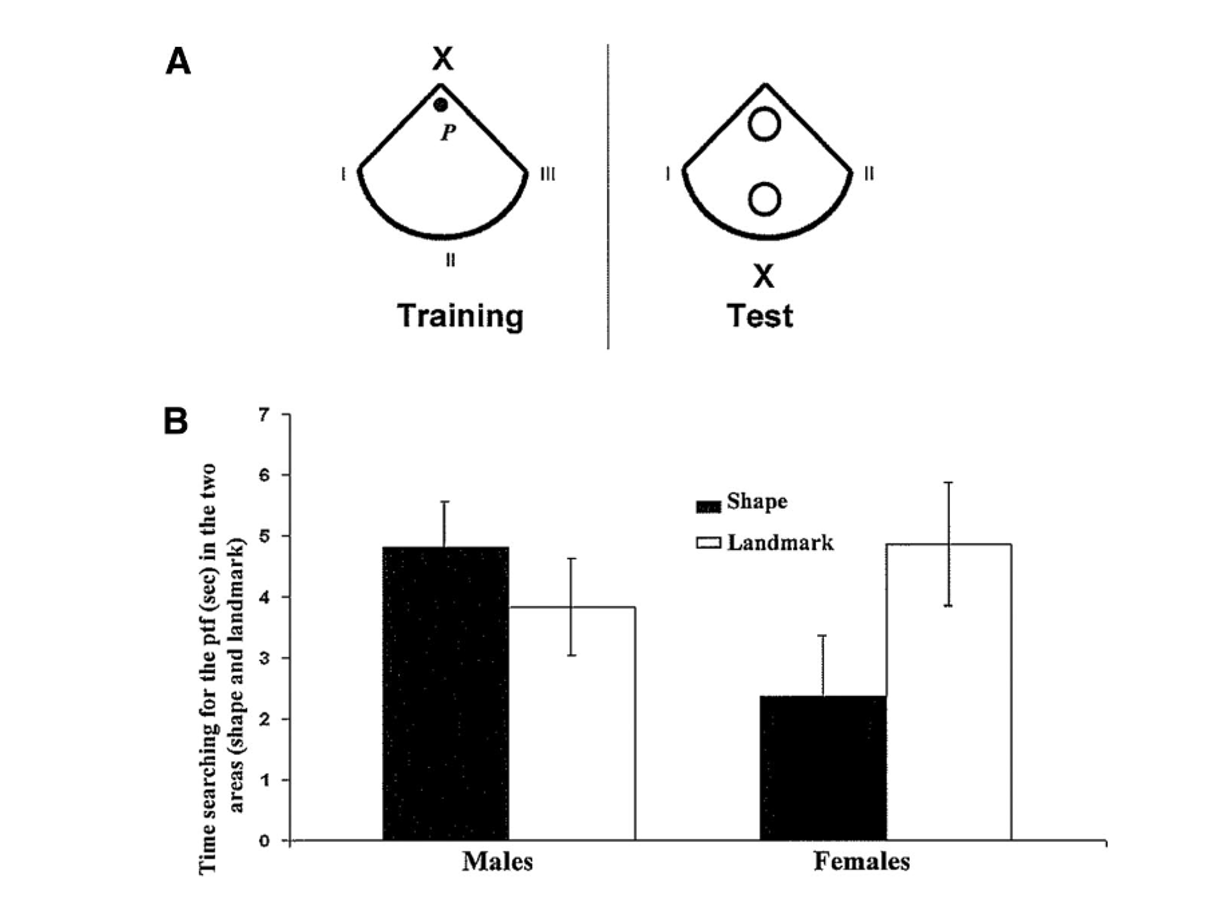
What does this graph mean?
This shows that female rats prefer the landmarks whereas male rats prefer the shapes.
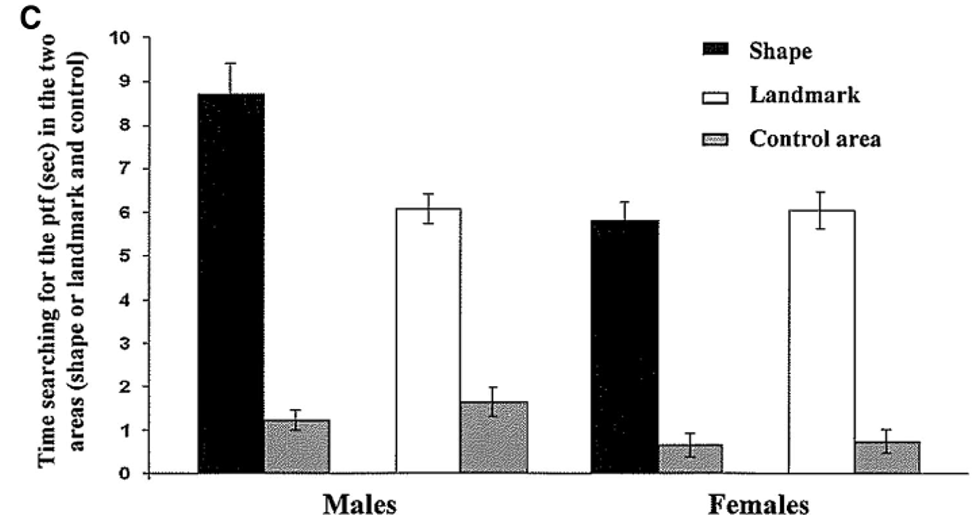
What does this mean?
Shows if shape is removed, male and female rats can still manage to find either the shape or landmark.
What does this mean
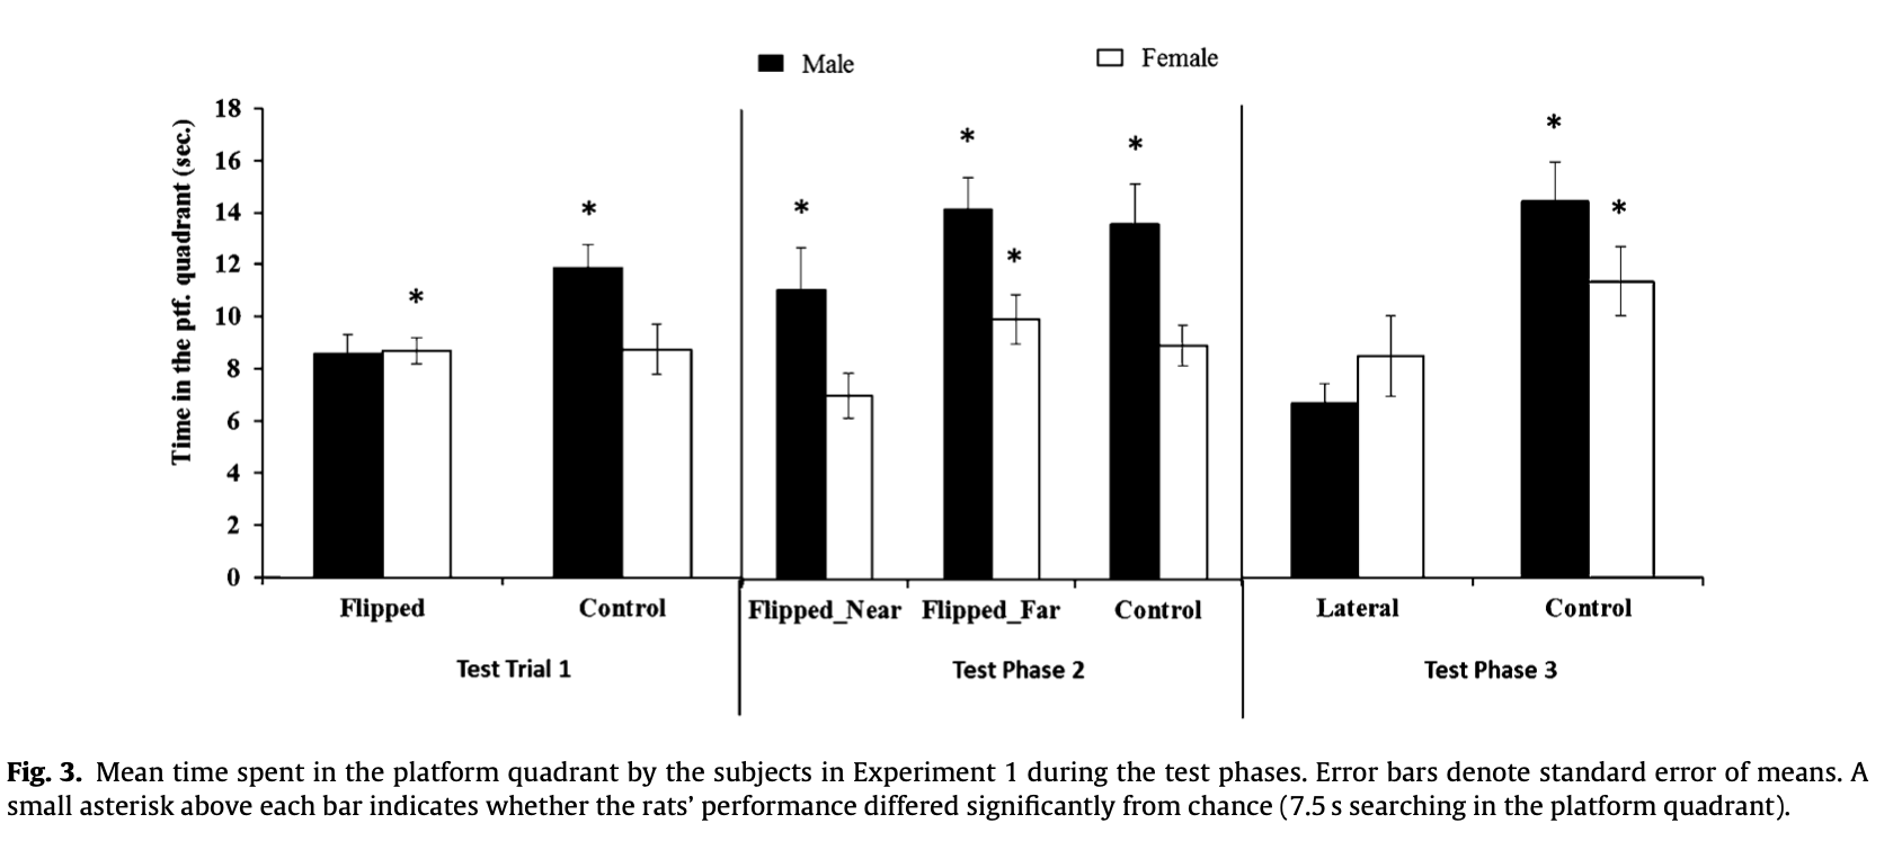
Flipping spatial cues disrupts performance, paticuarly in females. Males have better spatial memory.
What does this suggest?
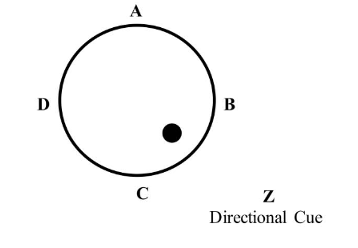
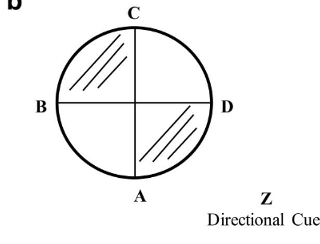
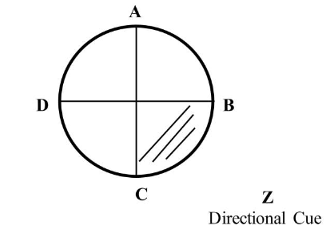
Rats are affected by the inversion of the landmark. Flipping of far landmarks has little affect.
What does this suggest?
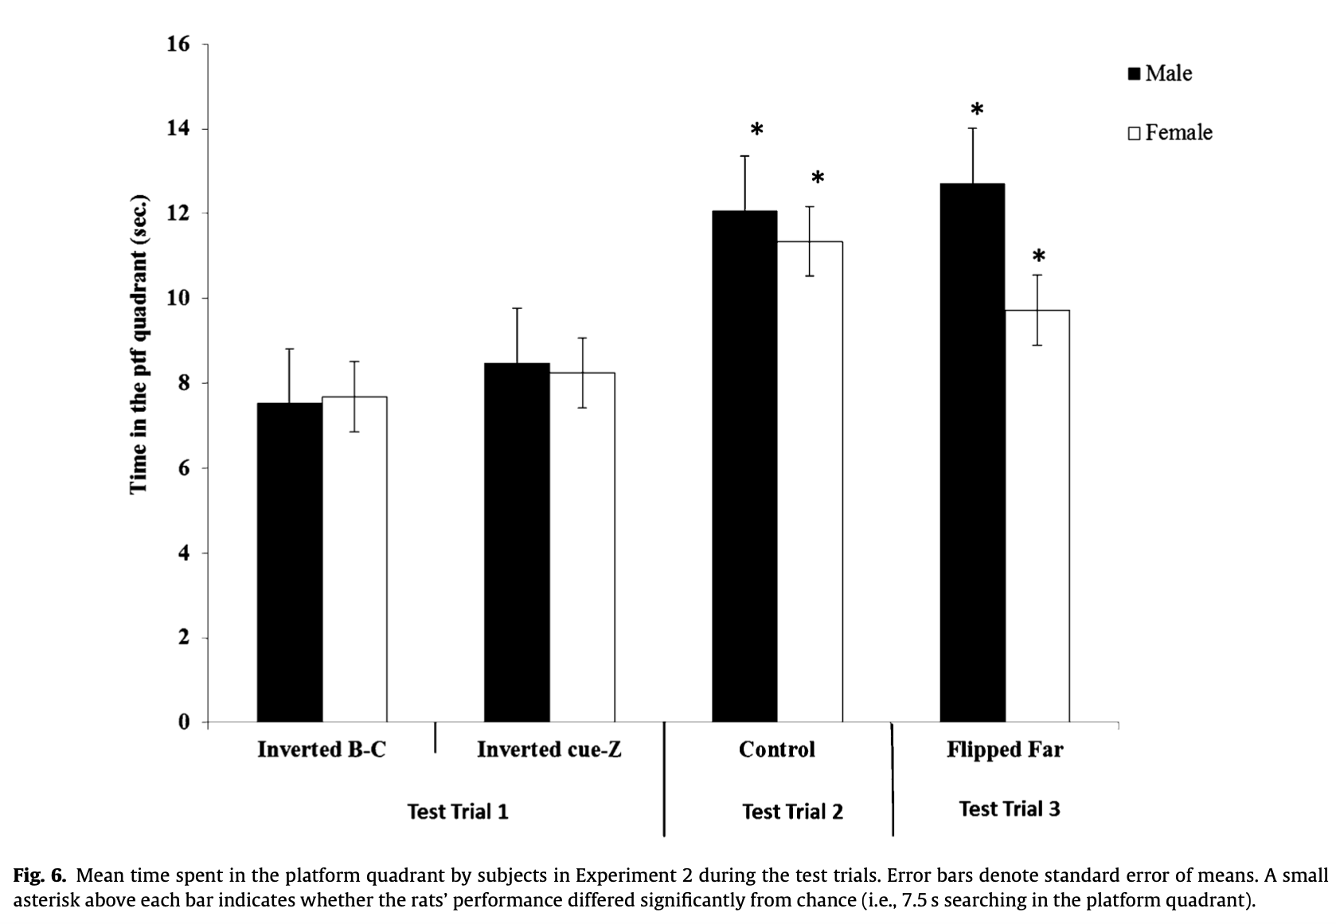
Rats did better with the same landmark config, performance were worst on inverted and flipped conditions. Therefore suggests a combination of all landmarks and Z to find their way.
What does this mean?
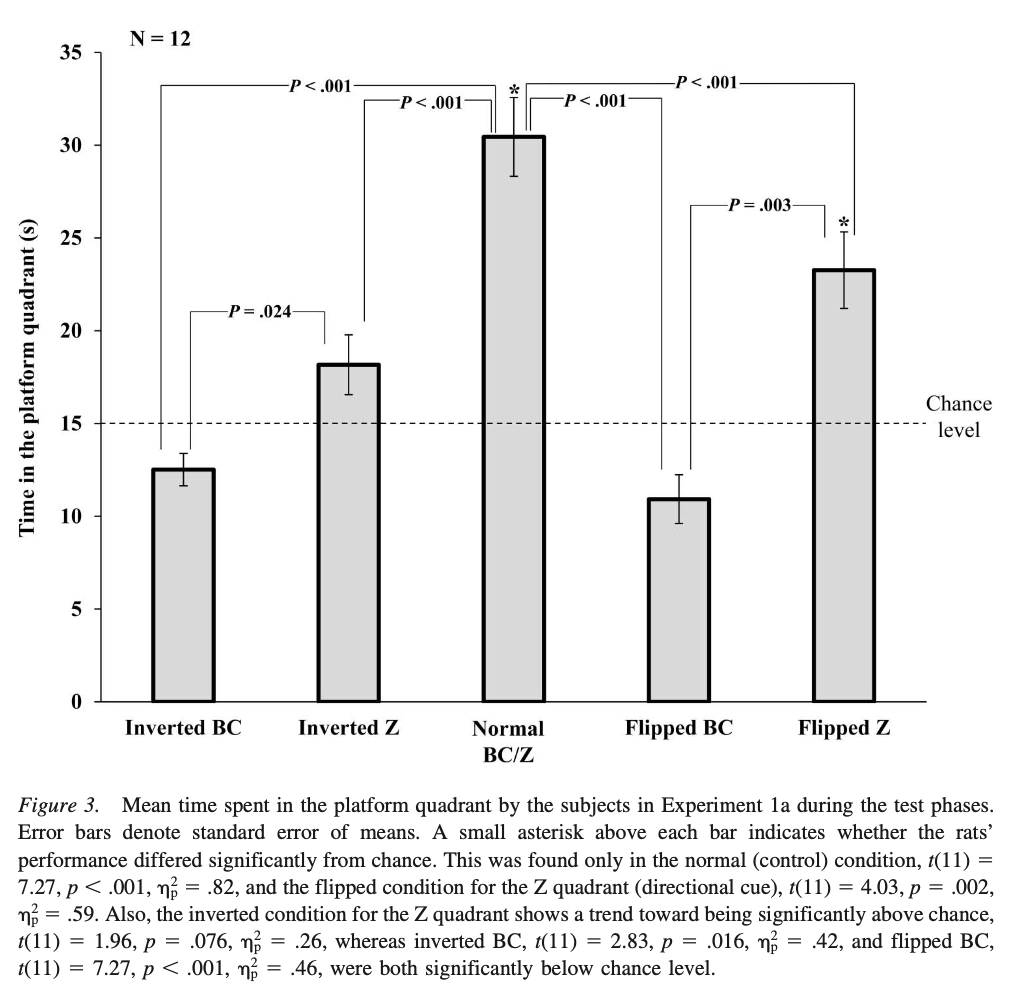
This shows the rats preference for Z, it is the strongest factor alone. BC are also important but Z is the main one.
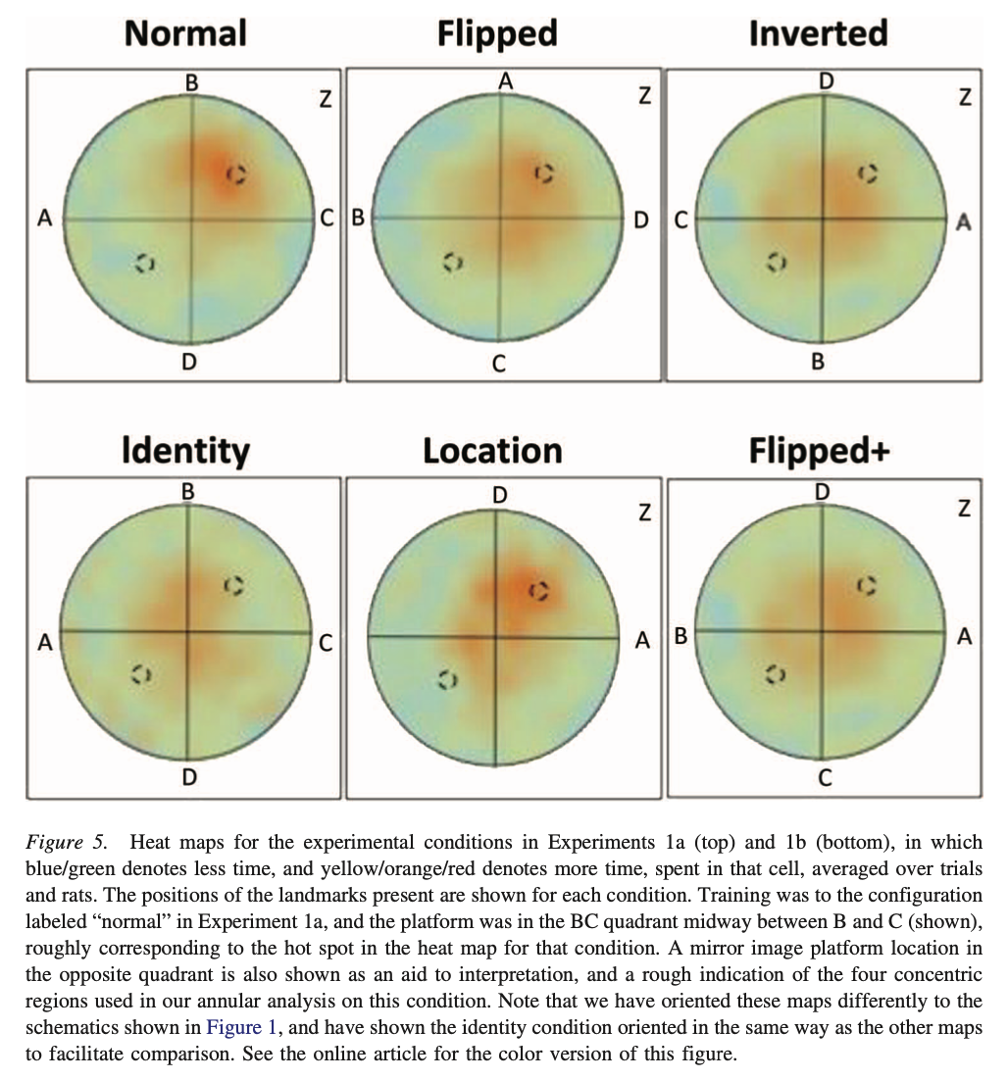
What does this mean?
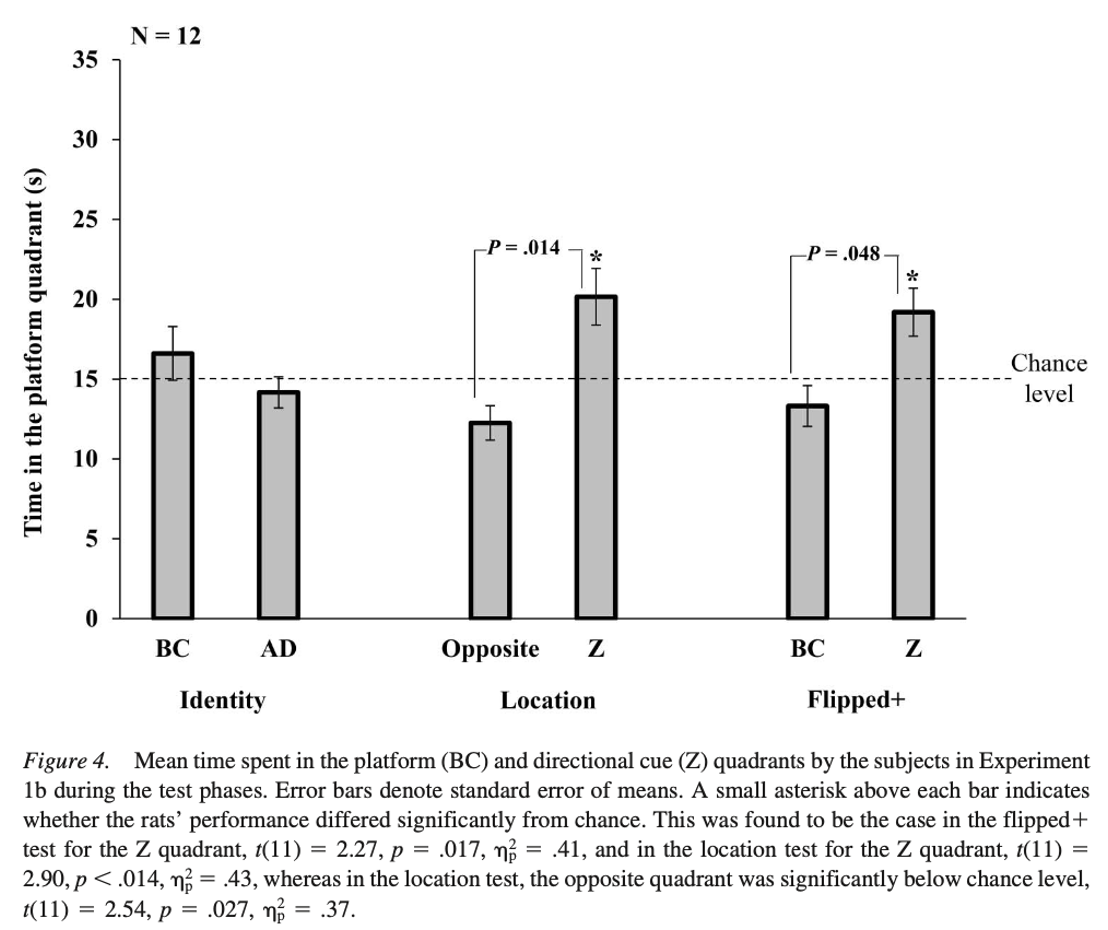
Reveal patters eg: strong localisation in normal, weaker localisation in location.
What part of Civile and Chamzoi et al study is this?
This is the aquistition section - where retraining occurs.
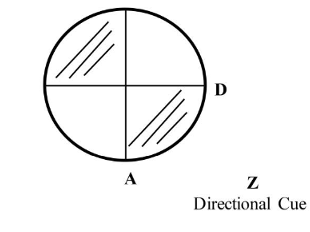
What part of Civile, Chamzoi et at study is this?
Inverted
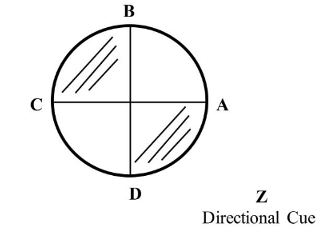
What part of Civile, Chamzoi is this?
Normal
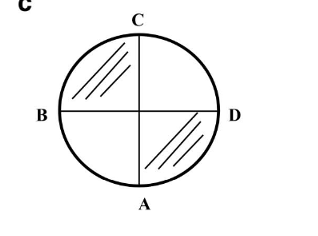
What part of Civile, Chamzoi is this?
Flipped
What part of Civile, Chamzoi is this?
Identity,
What part of Civile, Chamzoi is this?
Location