Biol 208: Lecture 21 - Modelling predator + prey (Lotka-Volterra models of Predation)
1/17
There's no tags or description
Looks like no tags are added yet.
Name | Mastery | Learn | Test | Matching | Spaced | Call with Kai |
|---|
No study sessions yet.
18 Terms
What type of species interaction outcome is HETEROTROPHY/Predator prey?
Mutualism, commensalism, exploitation, neutralism, amensalism + Competition
EXPLOITATION
Herbivores = Feed on plants but usually don’t kill the entire plant
Predators = Kill + feed on other animals
What are the 2 types of herbivory?
What do they normally eat
Give some examples
Are the 2 types mutually exclusive?
Grazers:
Feed on - Low growing, non-woody plants. Often NUTRIENT RICH eg. grasses + herbs
Ex: Horses, cattle, sheep, bison, elk etc.
Browsers:
Feed on - High growing, woody plants. NUTRIENT POOR eg. leaves + twigs
Ex: giraffes, moose, goats, porcupine, elk, mule deer
NOT MUTUALLY Exclusive
Depends on resource availability
Enclosure experiments
what are they used to study
Info dump on the reading assigned about enclosure experiments (Ch 14.1)
What was the organism
What was the question
Methods
Results
A tool to study the effects of Herbivory/predation on a species or community by using fences, mesh or an inaccessible position
Ch 14.1 - Herbivorous stream insect + its algal food
Organism = Larval stage of caddisfly = feeds on algae on surface of submerged rocks
Characteristics:
Builds a portable shelter (sand grains) like snail shell
Develop in summer + fall + Benthic
Question: Caddisfly have ability to reduce density of food supply
Methods: Raised One set of tiles above ground = prevent colonization (due to heavy sand made snail shells)
Results: Tiles excluding caddisfly = higher abundance of algae + bacteria
Influence of exploitation is best seen when exploiting organism/factor is removed

3 Things that influence prey populations
Food availability
Consumptive effects: Direct effects of predators on prey by eating them
Non-consumptive effects: Changes to prey that are due to PRESENCE of predators
includes shifts in behavior, stress physiology + morphological traits (Predators don’t have to kill prey to impact prey population)
Predators don’t have to kill prey to impact prey population: Info dump on the Non-consumptive effects lynx have on Hare example in class
Fitness = affected when predation pressure is high
Hares BLOOD CORTISOL levels increase in the years with higher predation rates + in plots with predators present compared to plots with predators excluded
Hares exposed to lynx also have REDUCED REPROD rates
Oscillation predator prey dynamics: Hare populations are couples with their predator
Talk about the Complementary hypothesis
Answer the Q - is it food or predation that is the bigger factor in prey population?
Enclosure experiment with hare _ link showed that BOTH FACTORS = important when it comes to affecting Hare populations
No predator + Lots of food plots had the highest hare density
The Lotka-Volterra models of predation
What do the subscripts H + P stand for?
What does the model IGNORE?
What does every symbol in the equation provided represent?
The model produces reciprocal oscillations/CYCLING of predator + prey populations
h = PREY (think herbivore cause most of them are)
p = PREDATOR
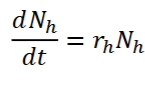
dNh/dt = The basic EXPONENTIAL GROWTH of the PREY
rh = Prey per-capita rate of increase
Nh = Prey population size
Lotka-Volterra model IGNORES:
INTRAspecific competition = assumes that predation will control prey population size not resource limitations + intra competition

What does this equation calculate + what does each symbol represent?
Factors predators into PREY population growth
rh = Prey per-capita rate of increase
Nh = prey pop. size
b = CAPTURE EFFICIENCY
Np = predator pop size

What is Capture efficiency (b)?
what does b equal if a predator catches 1/50 prey?
Proportion of encounters between predator + prey that results in the predator eating the prey
AKA. the success rate of the predator
b = 1/50 = 0.02
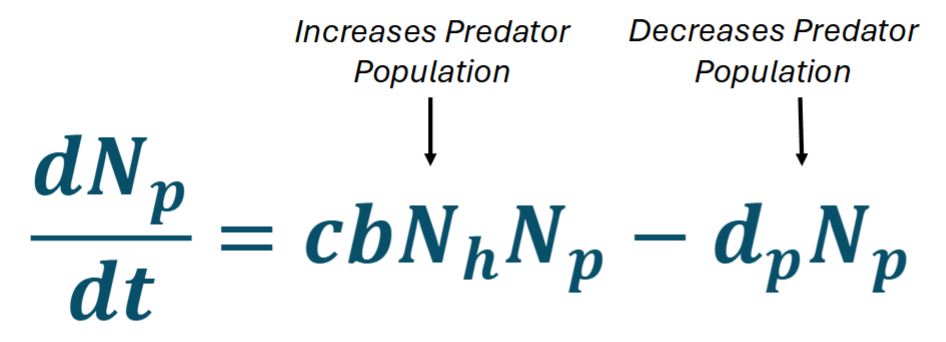
What does this equation calculate + what do each of the symbol represent?
why is there no r in this equation?
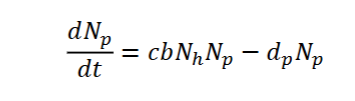
Calculates the GROWTH of PREDATOR population
c = CONVERSION FACTOR of prey to predators
b = capture efficiency
dp = Per capita DEATH RATE of predators due to natural death
no r because population depends on availability of h (prey)
What is Conversion Factor (c)?
what does c equal if a predator has to eat5 prey to have enough excess E to prod 1 offspring?
How many prey are required to produce one predator
how many prey a female needs to consume to make one offspring
c = 1/5 = 0.2

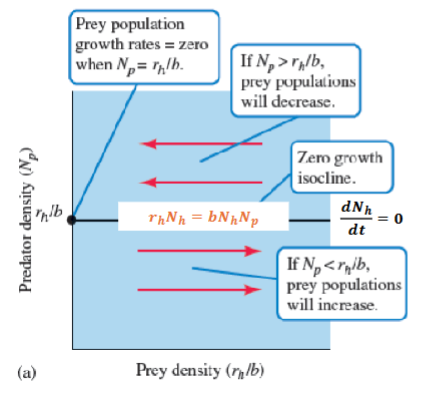
What does this equation represent?
ISOCLINE FOR PREY = Zero prey growth
the density of predator that would result in ZERO population growth for the prey
When Np = rh/b → prey growth (dNh/dt) = zero
On a STATE SPACE GRAPH
What is on the X -axis + What is on the Y?
How would the ISOCLINE FOR PREY be plotted on this graph?
X = Prey density
Y = Predator density
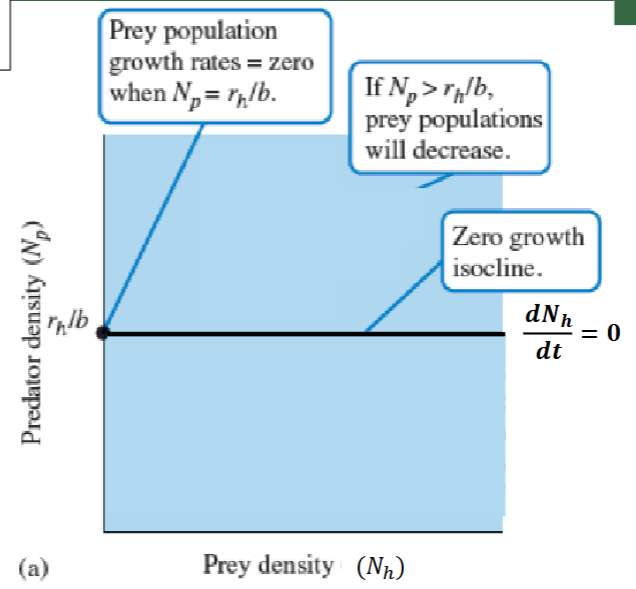
On the state space graph, How does PREY population density change if:
Np is less than rh/b
Np is greater than rh/b
What directions do the arrows point?
IF Np = GREATER = Prey population DECREASES
if Np = LESS = Prey population INCREASES

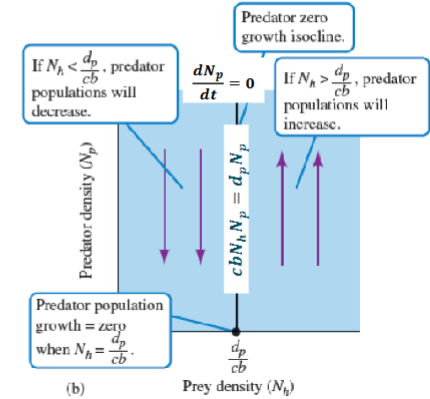
What does this equation represent?
What density of PREY would result in Zero population growth for the predator
ISOCLINE FOR PREDATOR
How would the ISOCLINE FOR PREDATOR be plotted on the state space graph?
How does PREDATOR population density change if:
Nh is less than dp/cb
Nh is greater than dp/cb
What directions do the arrows point?
Nh = LESS = Predator DECREASE
Nh = MORE = Predator INCREASE

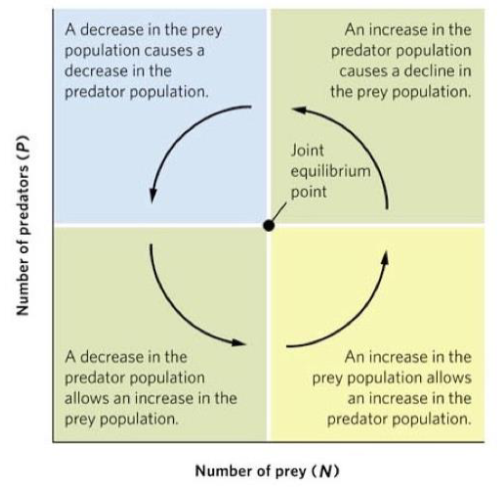
If we super impose the graphs we can show the cycling/oscillating predator-prey population dynamics
What is happening to the Predator vs. Prey populations in each of the quadrants?
Top left = D
Predator + Prey both Decrease
Top right = C
Predator increase + Prey Decrease
Bottom Left = A
Predator Decrease + Prey Increase
Bottom right = B
Predator + prey both Increase
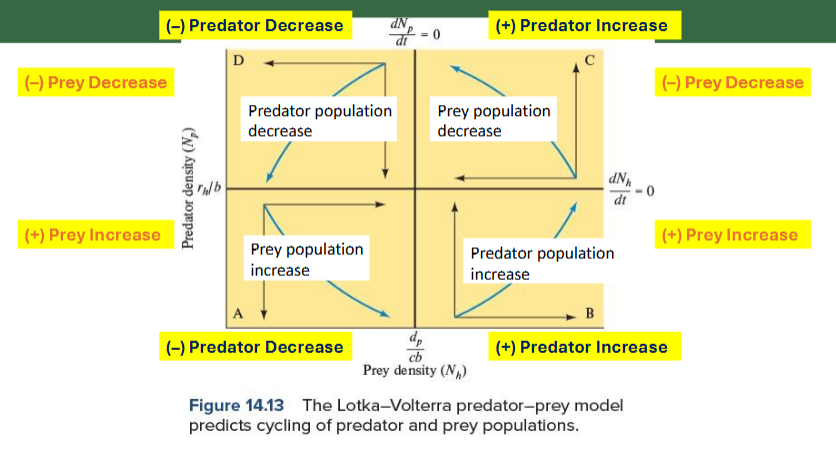
What is the Joint Equilibrium Point?
The point at which the two isoclines of zero growth intersect (in the middle)
this is where both populations are balanced + in equilibrium
No increase or decrease in the population size of either group