EMS: question 1
1/17
There's no tags or description
Looks like no tags are added yet.
Name | Mastery | Learn | Test | Matching | Spaced |
|---|
No study sessions yet.
18 Terms
Explain primary fuel using examples (5 marks)
an unprocessed energy source found in nature.
used directly to generate heat or electricity without needing to be converted.
Examples: coal, crude oil, natural gas, and wood.
typically extracted, mined, or harvested from the earth.
differ from secondary fuels like electricity or hydrogen, which are produced by processing primary fuels.
First Law of Thermodynamics (5 marks)
Also known as law of conservation of energy. Energy cannot be created or destroyed, only converted from one form to another.
In closed system, total internal energy change is equal to heat added to system minus work done by system.
Mathematically:
ΔU=Q-W
ΔU= change in internal energy
Q = heat added to the system
W = work done by the system
explains how energy transfers occur in heating systems, engines, and energy conversions (e.g. fuel → heat → motion).
Secondary Fuel with examples (5 marks)
an energy carrier that has been produced by converting a primary fuel.
does not occur naturally and must be processed from raw energy sources.
Examples: electricity (from coal/gas), petrol and diesel (from crude oil), and hydrogen (from electrolysis).
often easier to store, transport, or use than the original fuel.
used in end-use applications like appliances, vehicles, and industrial processes.
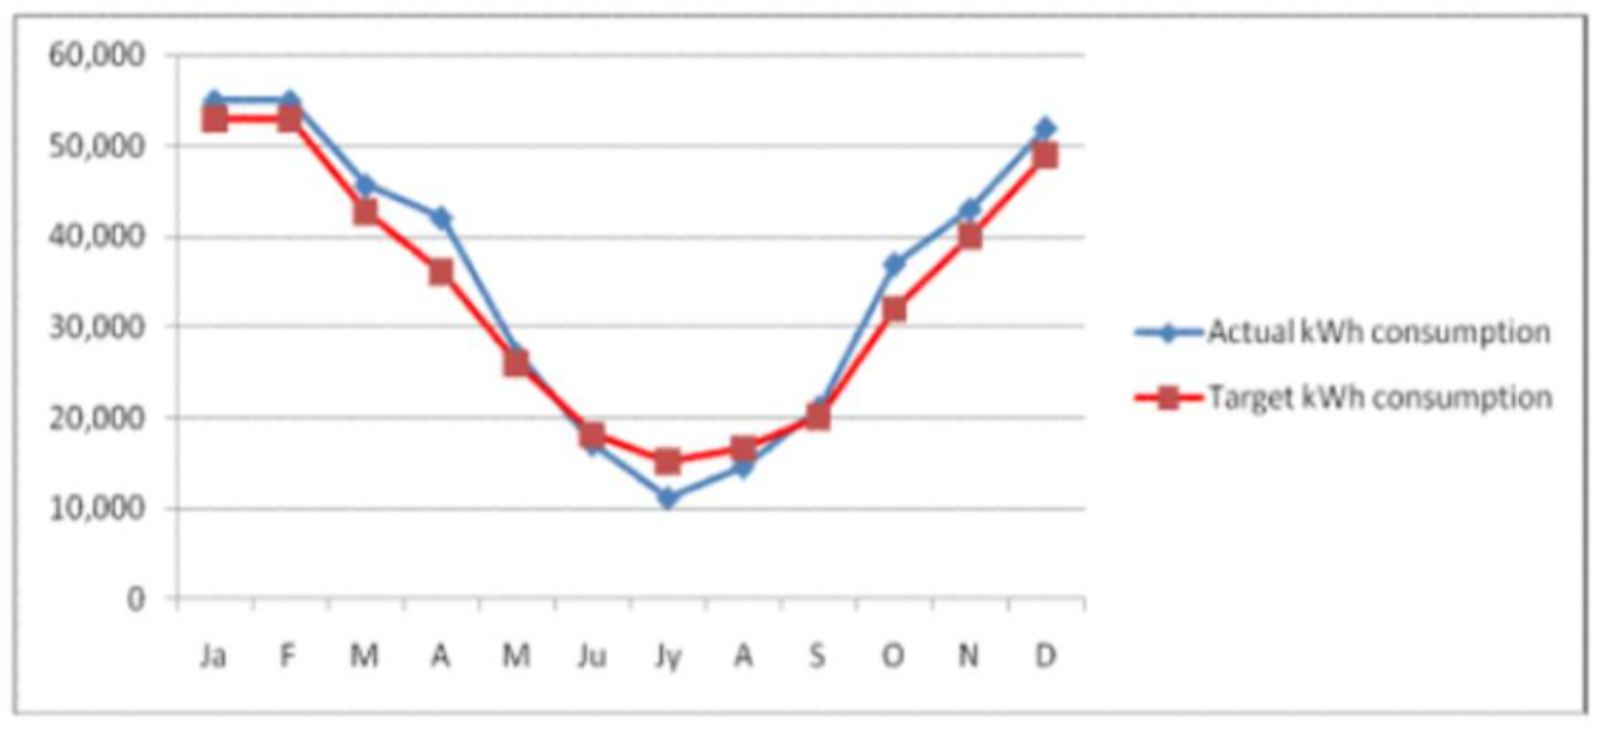
Use a sketch to describe the use of a norm chart to display energy consumption. (5 marks)
Plots actual vs normalised expected energy consumption.
compares monthly kWh usage to a baseline/ benchmark (e.g. weather-corrected use).
Deviations from norm are easily seen. high points may indicate leaks or poor control.
Useful for seeing trends/anomalies.
X= months Y= energy (kWh)
Two bars/ month: Actual and Normal
Lights on for 8 hours, consume 12 units of electricity. What is the wattage? (5 marks)
1 unit of electricity = 1 kWh
Total energy = 12 kWh
Time = 8 hours
Power = Energy / Time = 12 kWh / 8 h = 1.5 kW
Answer: 1500 watts
Why are correction factors needed for intermittently heated buildings? List them. (5 marks)
does not run 24/7, so actual heat loss is less than design value.
Correction factors adjust the calculated heat loss to match reality.
They account for:
Reduced heat-up period
Internal heat gains (people, lights)
Thermal mass delay
Prevents oversizing of heating systems.
Common correction factor = 0.8 for normal intermittent use.
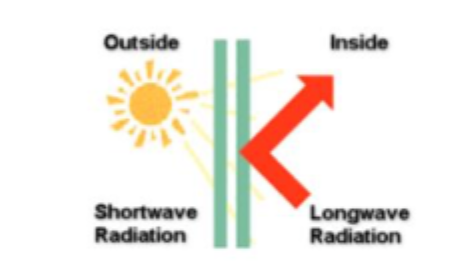
Use a sketch to explain the reason for using low-emissivity glazing. (5 marks)
has a microscopic coating that reflects infrared heat back into the room.
reduces heat loss through radiation.
Helps maintain internal temperature in winter.
Also reflects external heat in summer, improving insulation.
Heating Degree Days Calculation (5 marks)
Temperatures recorded:
12.5, 12.0, 12.6, 13.0, 14.5, 15.5
Base temp = 15.5°C
HDD = (base temp- average temperature)
Average = (12.5 + 12.0 + 12.6 + 13.0 + 14.5 + 15.5) / 6 = 13.35°C
HDD = 15.5 – 13.35 = 2.15
Answer: 2.15 Heating Degree Days
Aim of an energy audit & steps involved (5 marks)
To identify where energy is used, and how to reduce waste and costs.
1: Collect energy bills/data
2: Survey building/processes/equipment
3: Identify high-consumption areas
4: Recommend efficiency improvements
5: Prepare audit report with findings
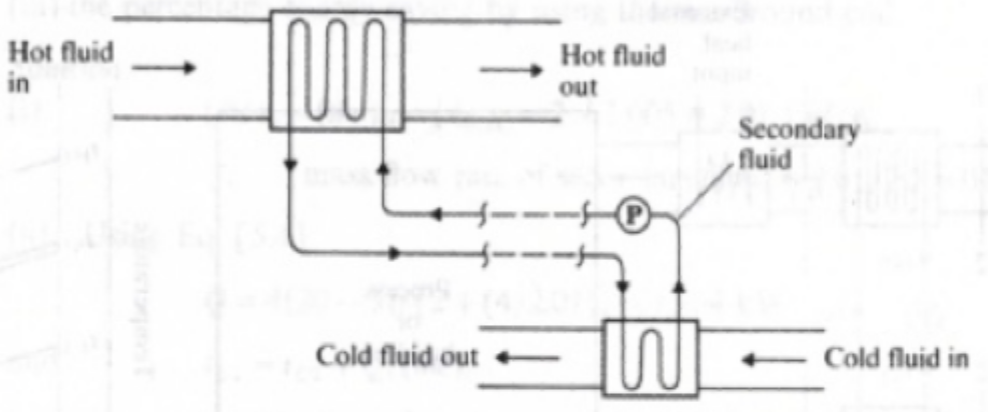
Briefly explain the operation of a run-around coil heat exchanger. Use a sketch. (5 marks)
transfers heat between two separate air streams using a closed-loop water system.
It consists of two finned coil heat exchangers connected by insulated piping.
Warm exhaust air heats the fluid in one coil; the fluid is pumped to the second coil.
There, it transfers heat to the incoming cooler fresh air stream.
Ideal where cross-contamination must be avoided
Fabric loss through floor (5 marks)
Given:
Area = 250 m²
U = 0.45 W/m²K
Ti = 20°C
Te = -1°C
ΔT = 21°C
Q=U×A×ΔT
Q=0.45×250×(20−(−1))=0.45×250×21=2,362.5 W
Answer: 2,362.5 watts
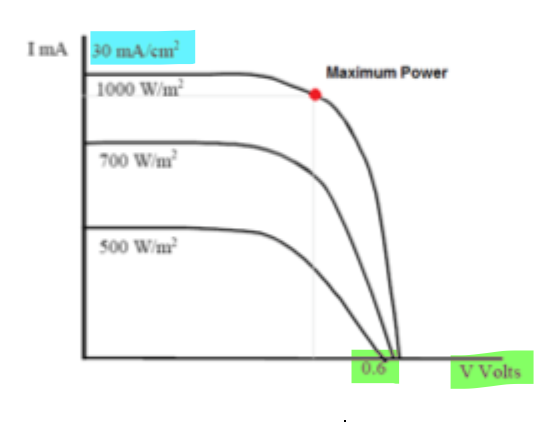
Solar PV VI curve + power rating (5 marks)
Given:
Voc = 22V
Isc = 3A
Estimate Pmax
As temperature increases, voltage decreases, but current stays similar.
Draw two curves:
Voc drops by 2v every 25 °c rise in temp
25°C middle curve reaches Voc = 22V
Estimate 75°C bottom curve shifts lower left. (50 deg so 4v less than 25)
mark max power V*I (red dot)
List and briefly explain five features of a renewable energy source. (5 marks)
Naturally replenished – constantly regenerated (e.g. sun, wind).
Low emissions – produces little or no CO₂ when operating.
Sustainable – can be used long-term without depletion.
Diverse sources – includes solar, wind, hydro, biomass, tidal.
Reduced dependency – lowers reliance on fossil fuel imports.
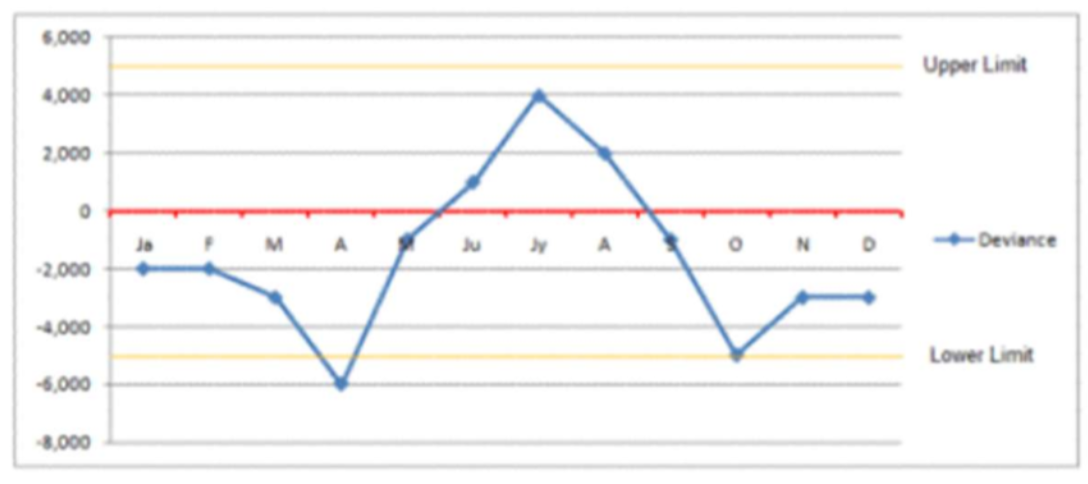
Deviance Chart use (5 marks)
Shows the difference between actual and expected energy use.
It helps identify overuse or savings compared to a target or norm.
Commonly used in energy management to detect anomalies or waste.
X-axis = time (e.g. months)
Y-axis = kWh deviation
Bars above = overuse, below = savings
Five causes of possible error in sub-meter energy data transfer (5 marks)
Communication failure- data packets can be lost due to poor wireless or network connections.
Incorrect meter calibration- leads to inaccurate readings being recorded.
Clock mismatch or time drift- results in data being logged at the wrong intervals.
Duplicate or missing readings- caused by system resending or skipping data due to glitches.
Incorrect unit conversion- energy readings may be misinterpreted if scaling factors or units (e.g. kWh vs Wh) are not handled properly.
Power Factor and Phase Angle Calculation (5 marks)
Given:
Voltage (V) = 230 V
Real Power (P) = 0.3 kW = 300 W
Current (I) = 1.42 A
Step 1: Apparent Power (S):
S=V×I=230×1.42=326.6 VA
Step 2: Power Factor (PF):
PF=P/ S=300/326.6=0.918
Step 3: Phase Angle:
θ=cos−1(0.918)≈23.8∘
Step 4: Leading or Lagging?
Since it’s a motor (inductive load), it’s lagging.
Final Answer:
Power Factor = 0.918,
Phase angle = 23.8°,
Lagging load
List 3 renewable energy resources (5 marks)
Solar energy – harvested from sunlight using PV panels or thermal collectors.
Wind energy – generated by wind turbines converting kinetic energy into electricity.
Hydropower – electricity from flowing or falling water (e.g. dams or rivers).
Calculate the kWh equivalent to an amount of natural gas given
natural gas m³
MJ of energy per m³
(5 marks)
kWh= volume(m³)*MJ/m³*conversion factor
conversion factor found in formulas