1.2: How Markets Work (EDEXCEL A LEVEL ECONOMICS)
1/87
There's no tags or description
Looks like no tags are added yet.
Name | Mastery | Learn | Test | Matching | Spaced | Call with Kai |
|---|
No study sessions yet.
88 Terms
rational decision making
describes choices that are logical and consistent and maximize value (consumers want to maximize utility and producers want to maximize profit)
Utility
Ability or capacity of a good or service to be useful and give satisfaction to someone.
Demand
the quantity of a good or service that consumers are willing and able to buy at any given price in a given time period
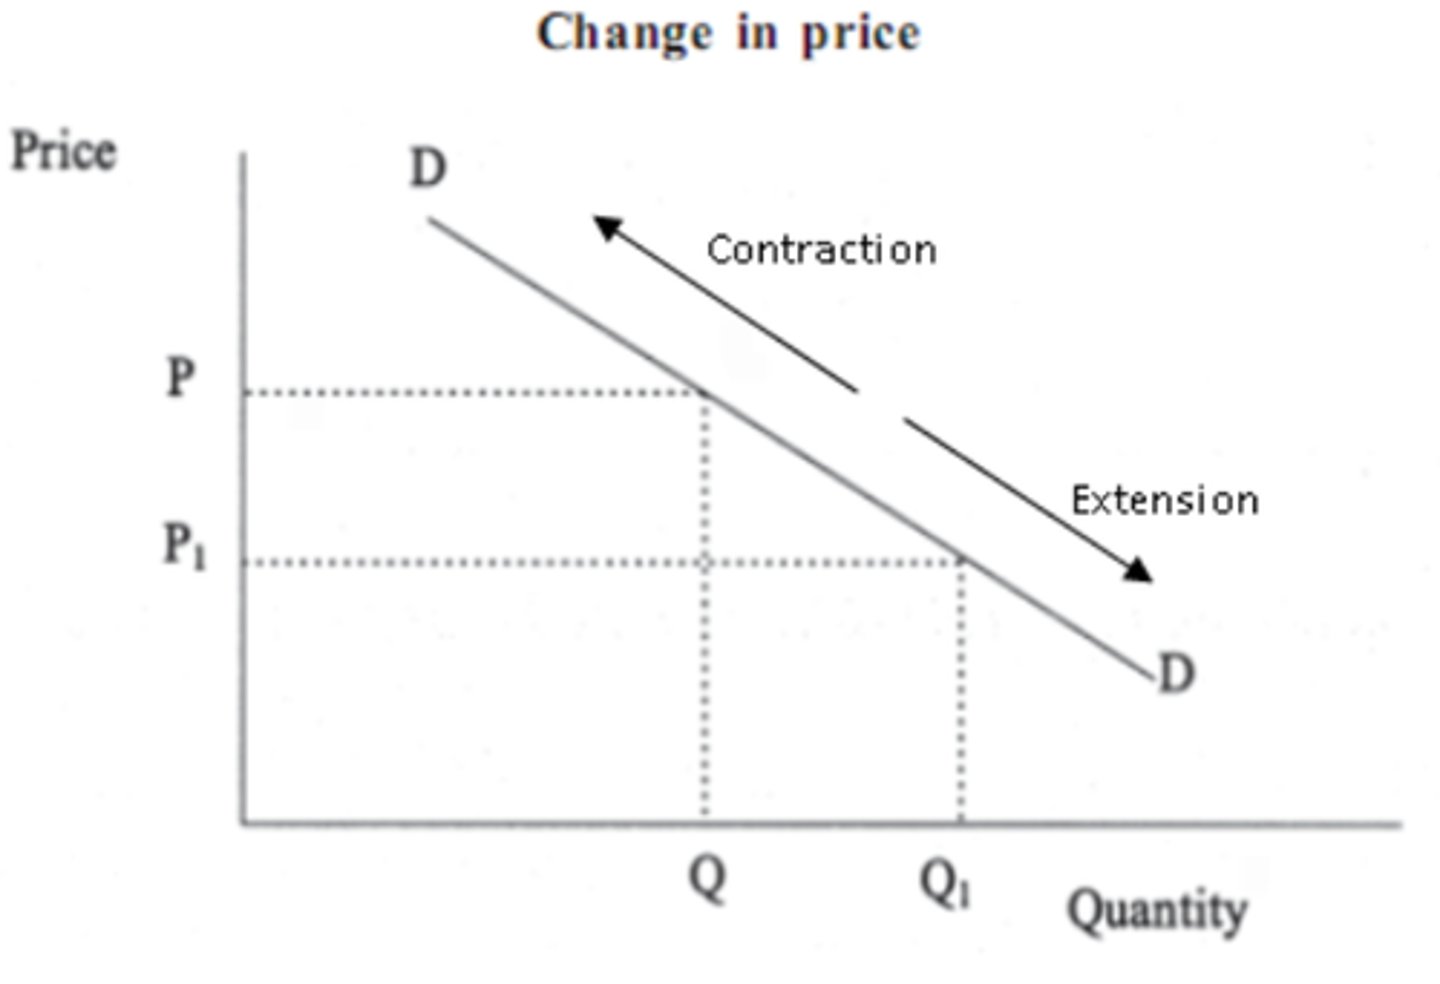
Law of Demand
quantity demanded varies inversely with price
extension of demand
the increase in quantity demanded due to a fall in price

contraction of demand
the fall in the quantity demanded due to a rise in price
the income effect
the change in consumption that results when a price increase causes real income to decline
consumers can buy less with a given budget
the substitution effect
the change in the quantity demanded of a good that results from a change in price, making the good more or less expensive relative to other goods that are substitutes ( depends on closeness of substitutes )
Shifting the Demand Curve
things that determine buyers' demand for a good, other than the good's price (non-price determinants) (shift right=increase; shift left=decrease)
Conditions of demand
changes in income
fashion/tastes/preferences
advertising and branding
population size/demographic change
external shocks
seasonality
market expectations
price of complements
price of substitutes
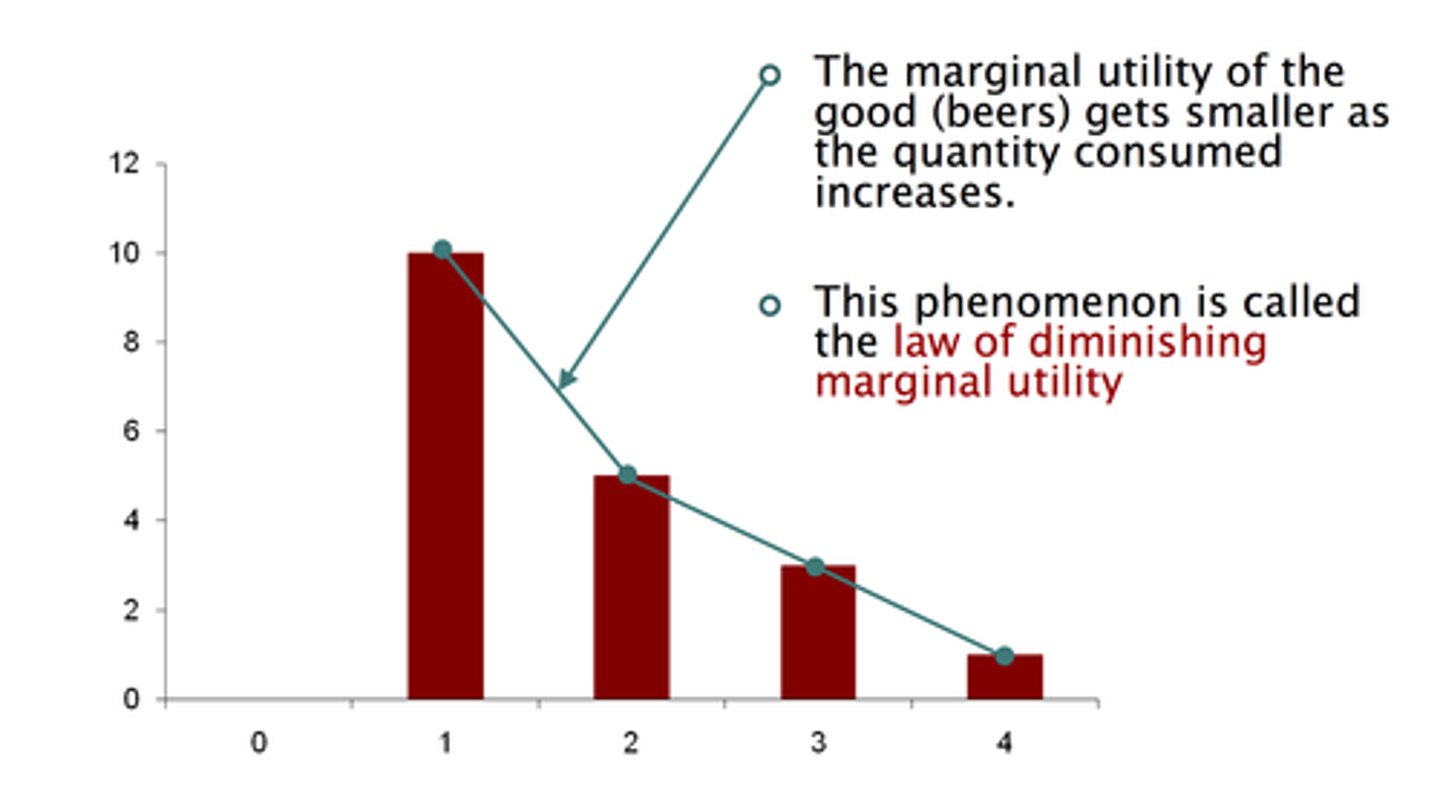
Marginal utility
the extra usefulness or satisfaction a person gets from acquiring or using one more unit of a product, customers are willing to pay a price less than or equal to their marginal utility
Diminishing marginal utility
the principle that our additional satisfaction, or our marginal utility, tends to go down as more and more units are consumed, the additional satisfaction obtained from the consumption of the next unit will go down as we consume more units
Derived demand
demand for a good when it is required in the making of another
veblen goods
are goods that have snob value and are bought to display wealth rather than utility. Their demand curve slopes upwards from left to right, as the higher the price the greater the quantity demanded, reverse economic logic, more expensive they are the more effectively they claim their status
Supply
quantity that producers are willing and able to sell at any given price in a given time period
law of supply
supply has a direct relationship with price because the higher the price the more opportunity for profit
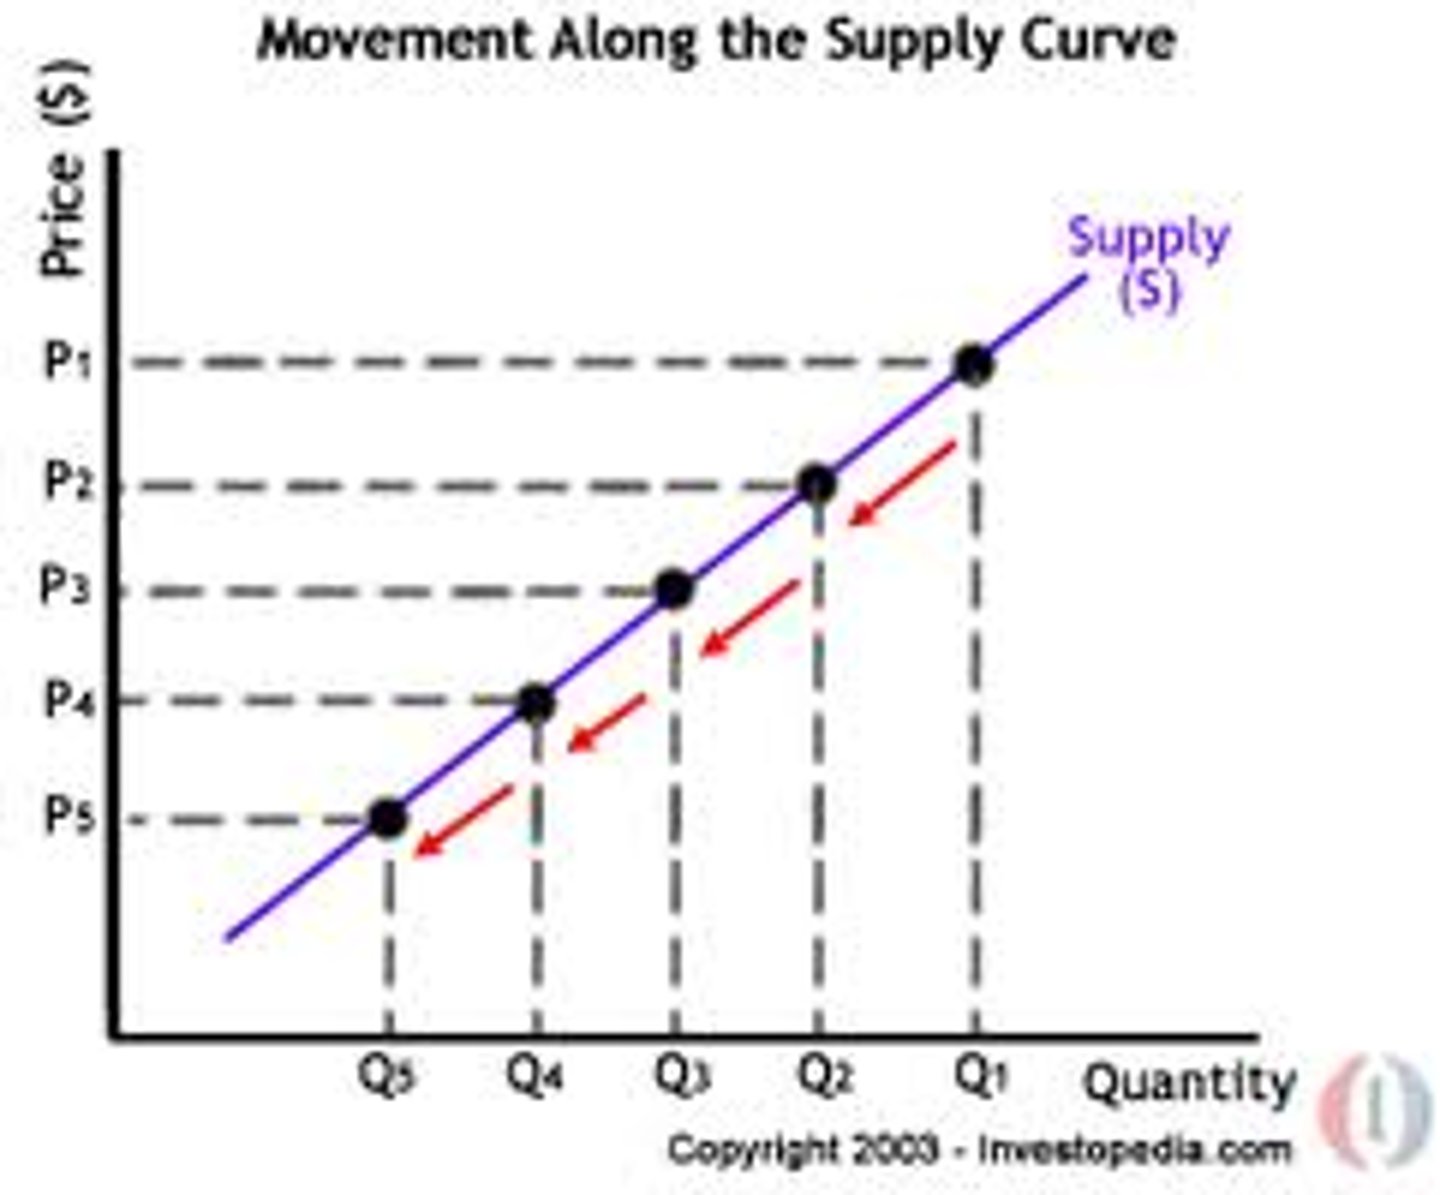
extension of supply
When there is an increase in supply because the market price has risen.

contraction of supply
When the amount offered for sale is reduced because the price level has fallen.
shifting the supply curve
non-price determinants shift the supply curve (shift right=increase; shift left=decrease)
conditions of supply
cost of production
external shock
new technology
indirect taxes (increases cost of production)
subsidies
equlibrium price
The quantity consumers are willing and able to buy is exactly equal to the quantity firms are willing and able to sell. here there is no excess supply causing surplus and no excess demand causing shortage
When market price is above equilibrium price
producers supply more and consumers demand less so there is a surplus, market price will fall. there will be a contraction of supply and extension of demand until equilibrium price and quantity is reached
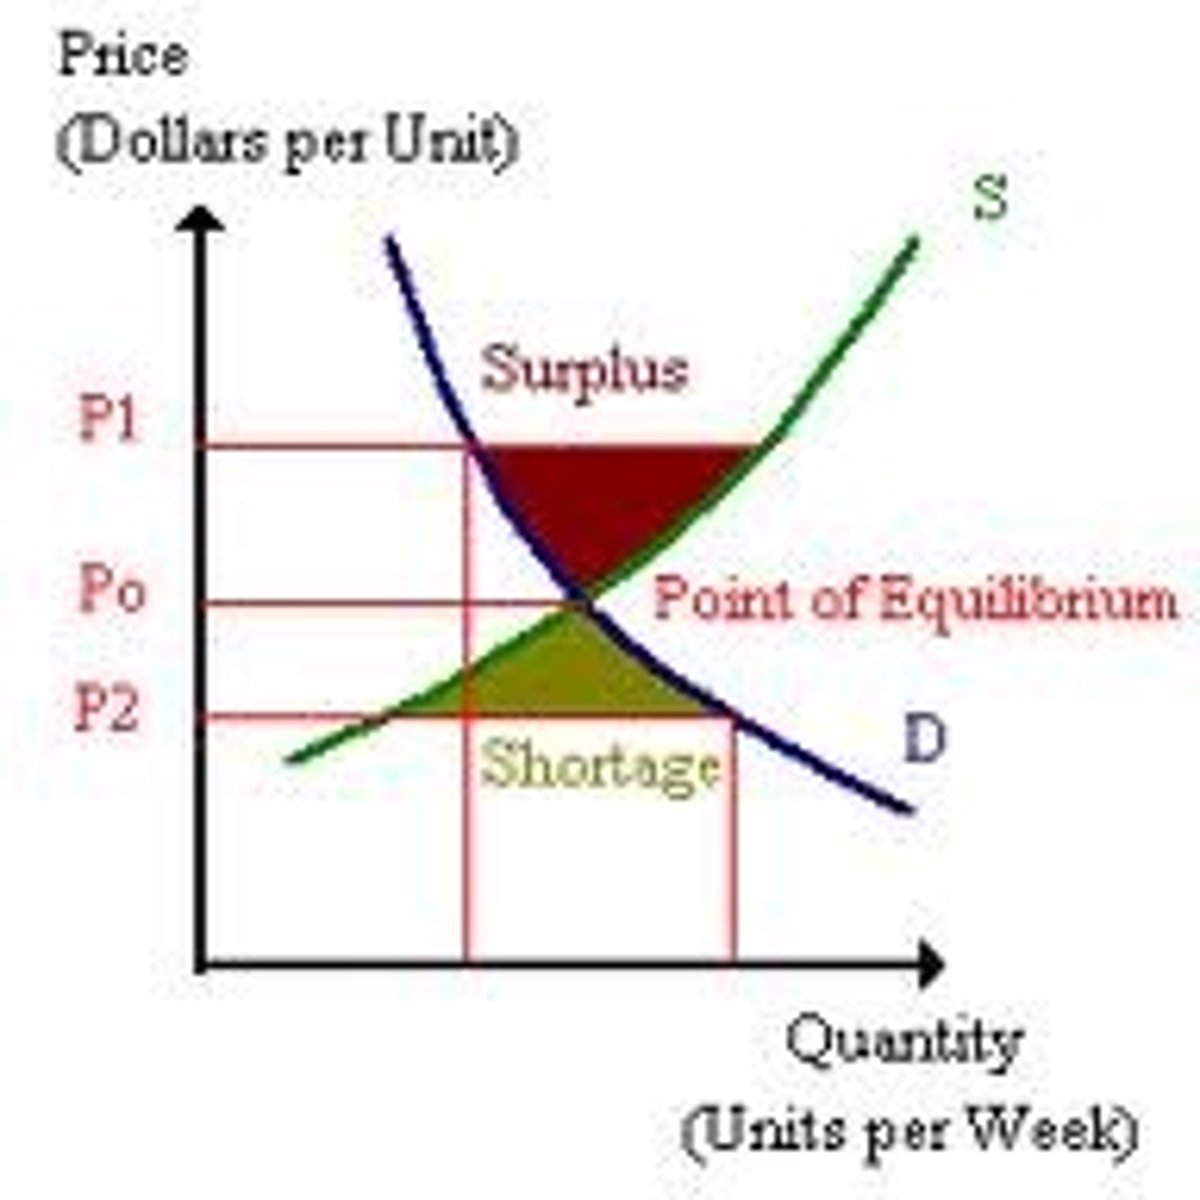
when market price is below equilibrium price
consumers demand more and producers supply less so there is a shortage, which causes the market price to rise. there is an extension of supply and contraction of demand until equilibrium price is reached
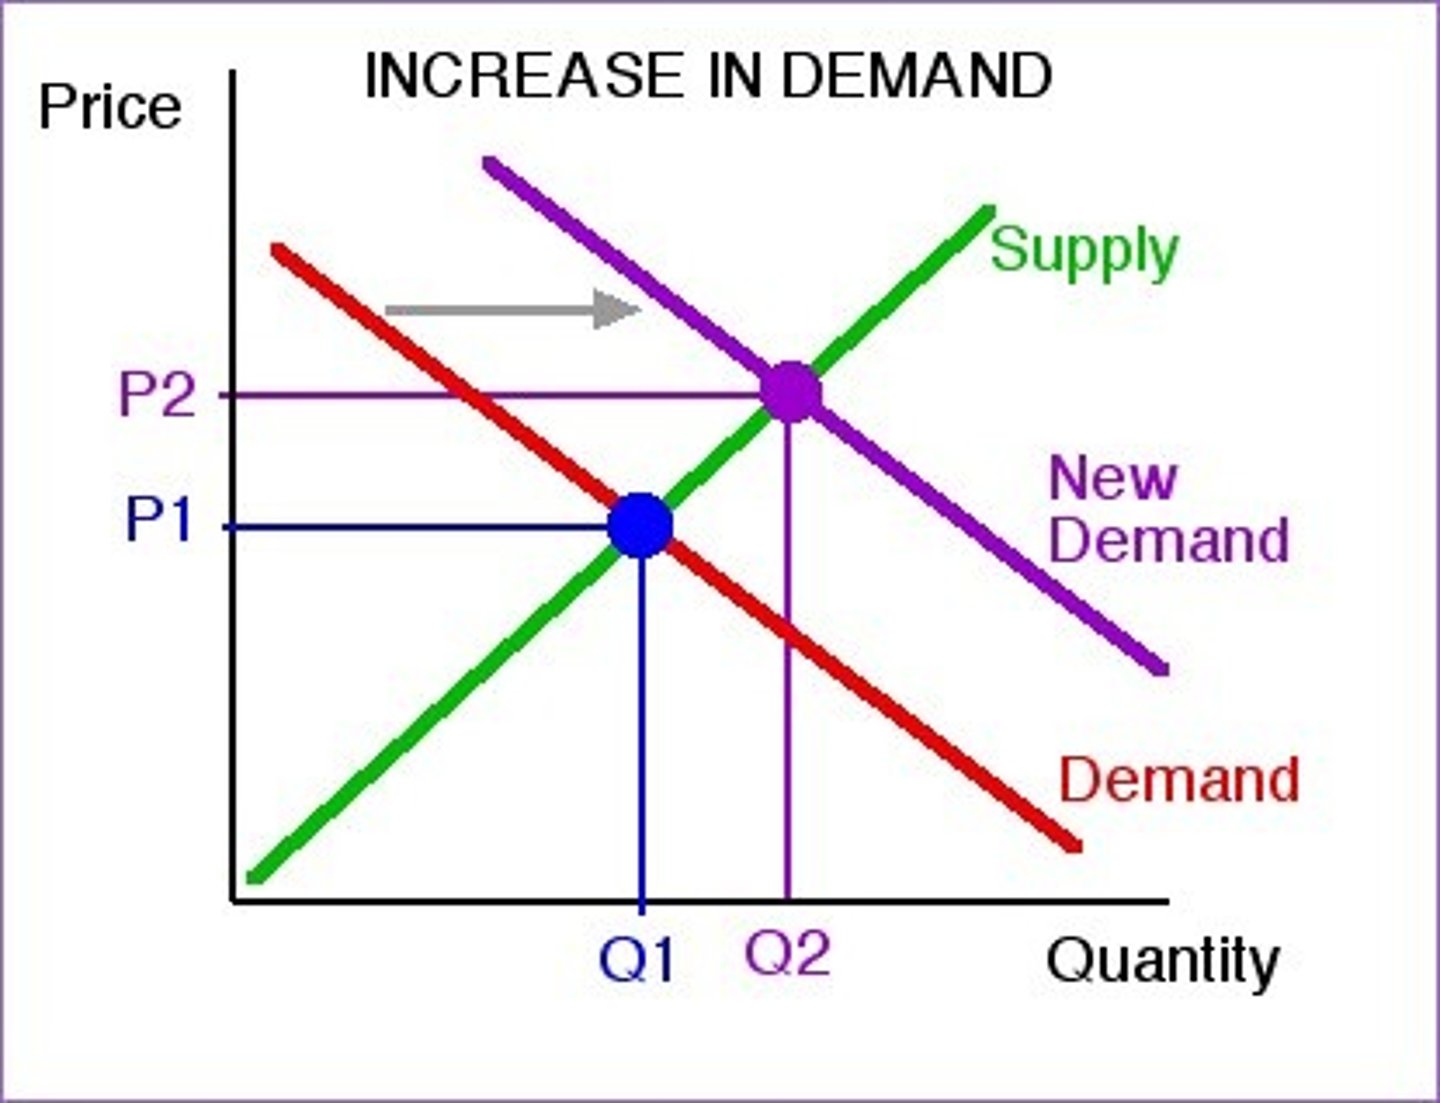
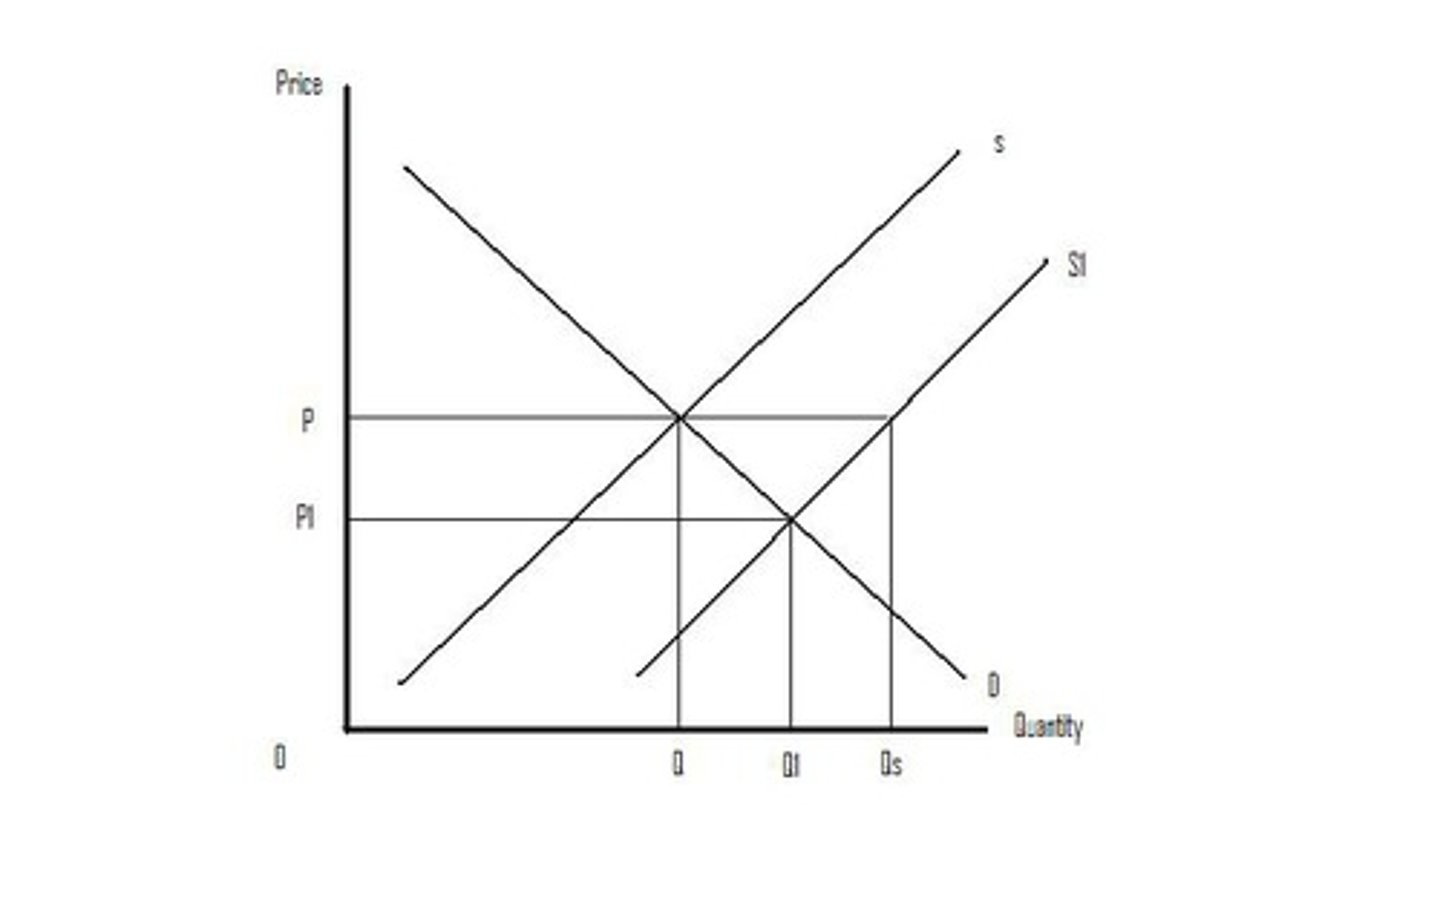
increase in demand
a rightward shift in the demand curve representing a willingness on the part of buyers to demand more of a good or service at any price. equilibrium price will increase and so will equilibrium quantity

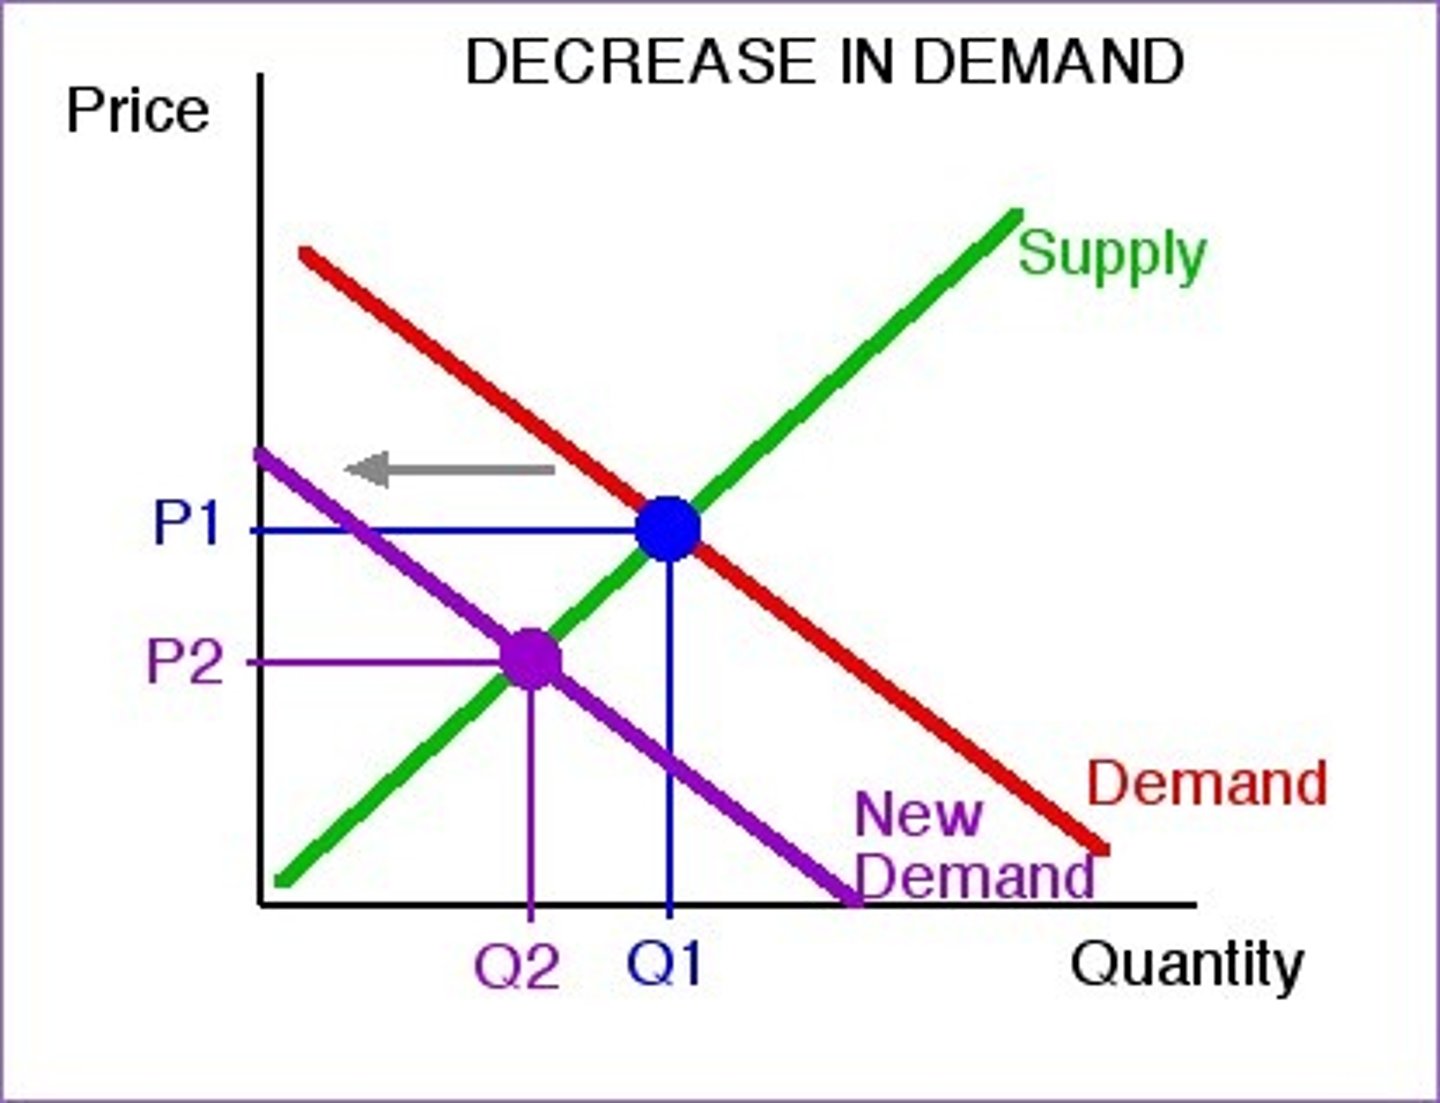
decrease in demand
a leftward shift in the demand curve representing a decrease in the willingness of buyers to demand an item at any price. equilibrium price will fall as will equilibrium quantity
increase in supply
a rightward shift in the supply curve indicating a willingness of business firms to produce more of an item at any given price. equilibrium price will fall and equilibrium quantity will rise
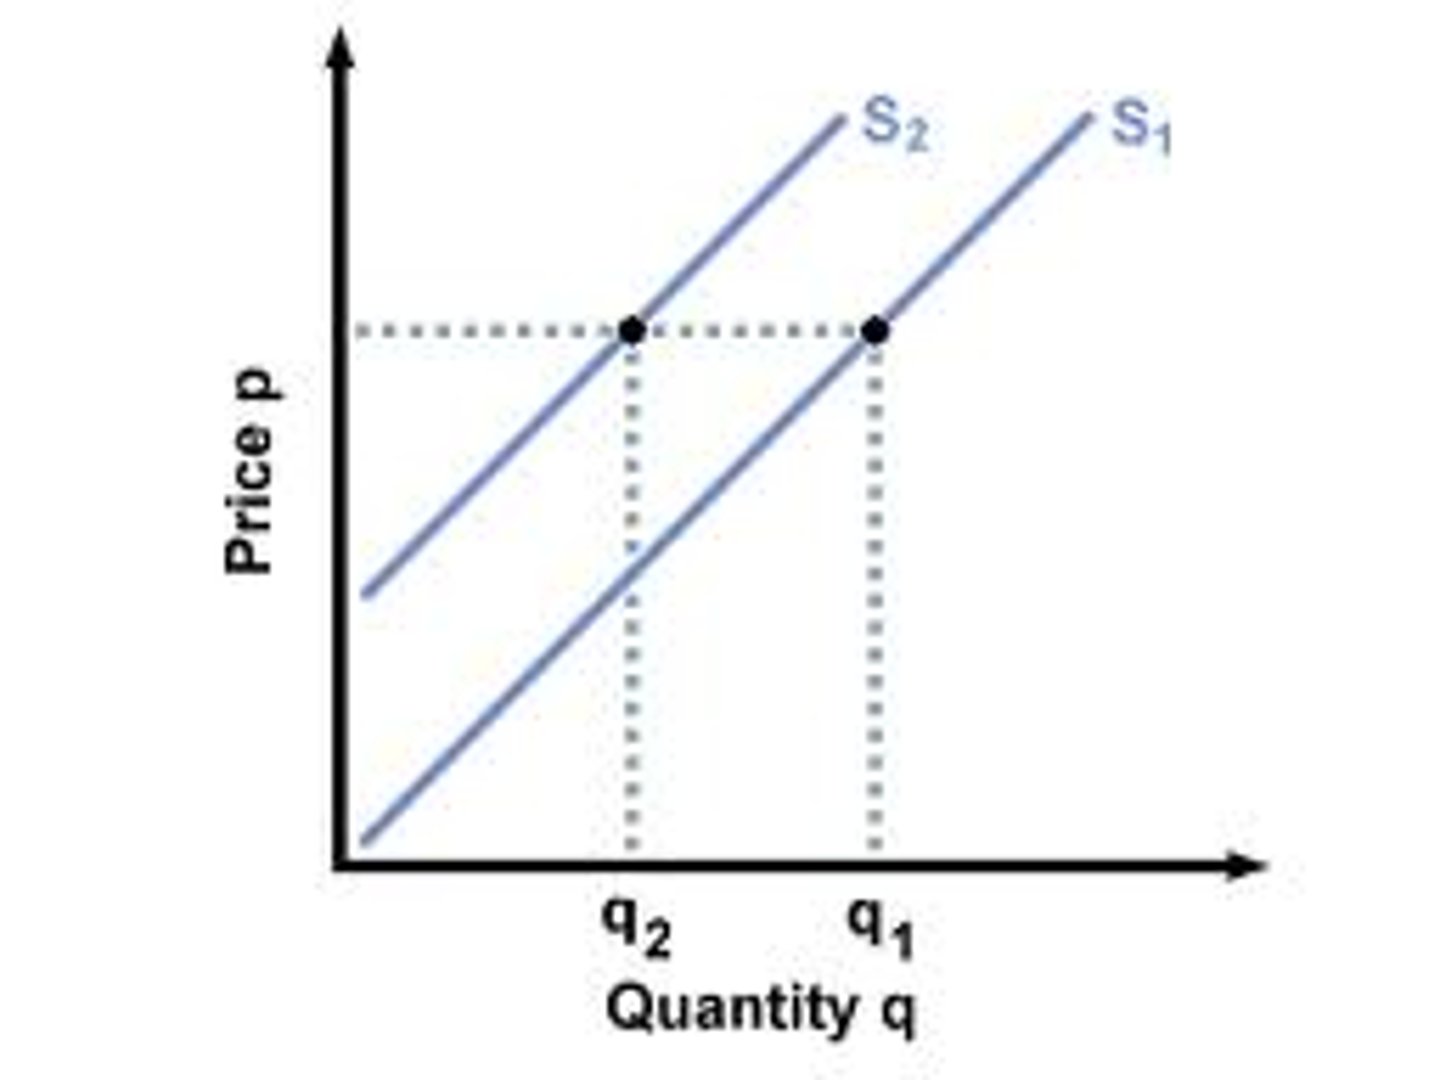
decrease in supply
a leftward shift of the supply curve indicating a decrease in the quantity suppliers are willing to produce at any price. equilibrium price will rise and equilibrium quantity will fall
the price mechanism
forces of supply and demand determine the price of commodities, therefore influencing how scare resources are allocated to their highest value use
rationing
A system of allocating scarce goods and services using criteria other than price, when demand is greater than supply prices rise and the good is rationed so that only those who can afford to pay the higher prices get it
incentivising
when price rises it creates an incentive for firms to produce more to meet demand, if it falls it creates an incentive to leave the market
signalling
long term impact, changes in curves signals for producers and consumers to enter or leave the market
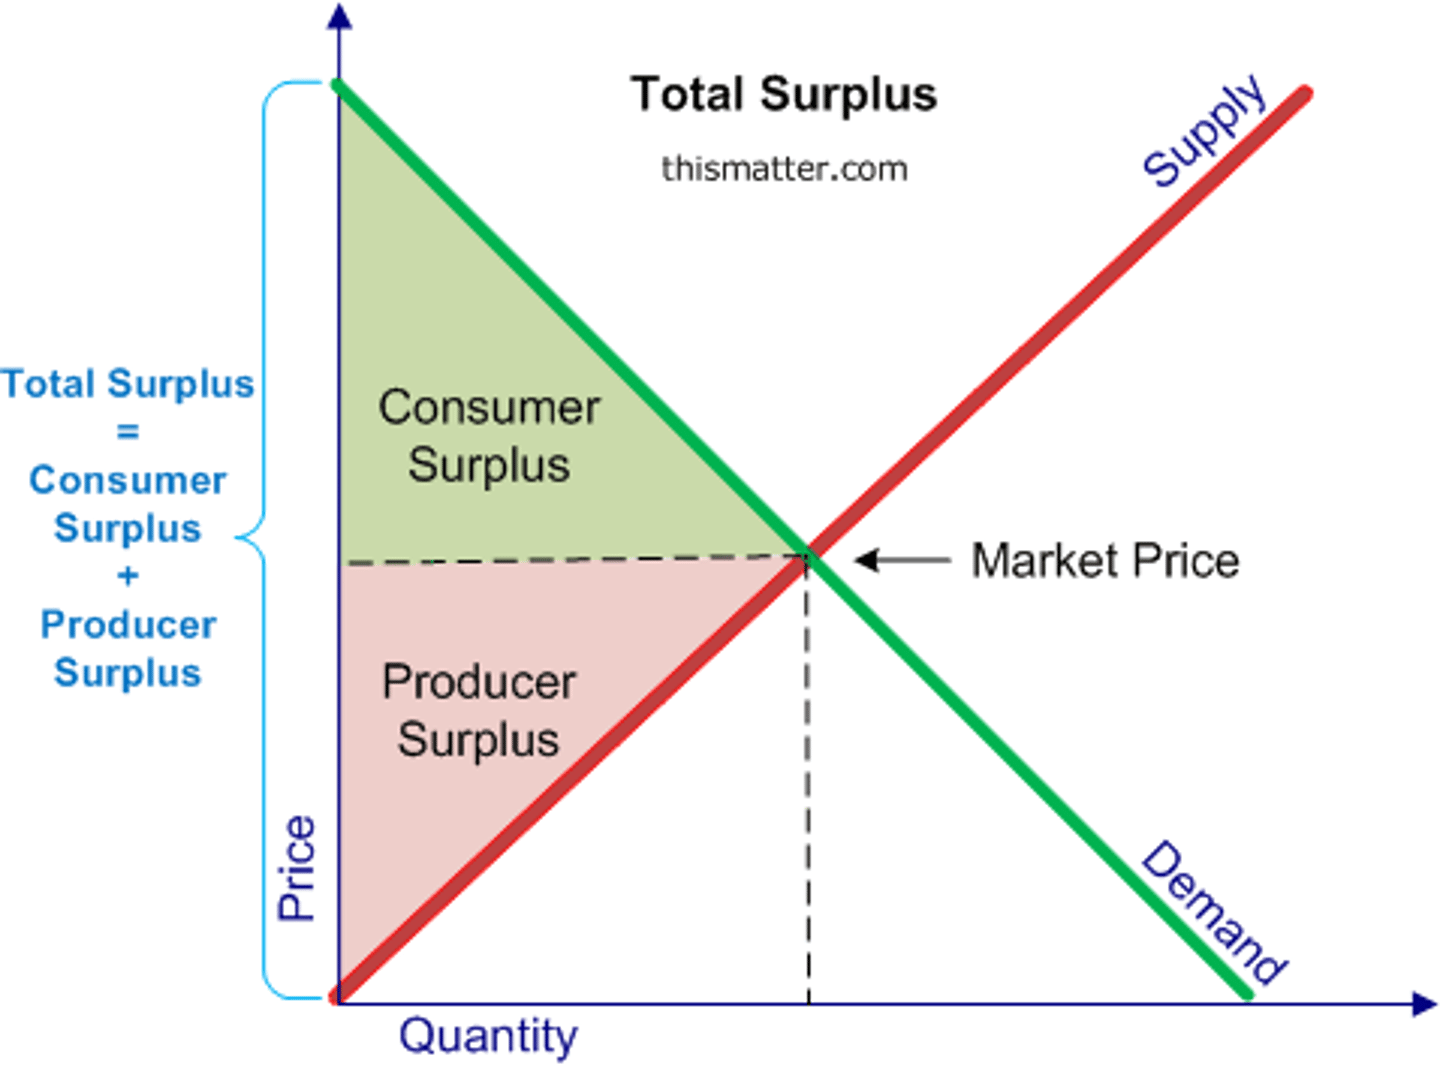
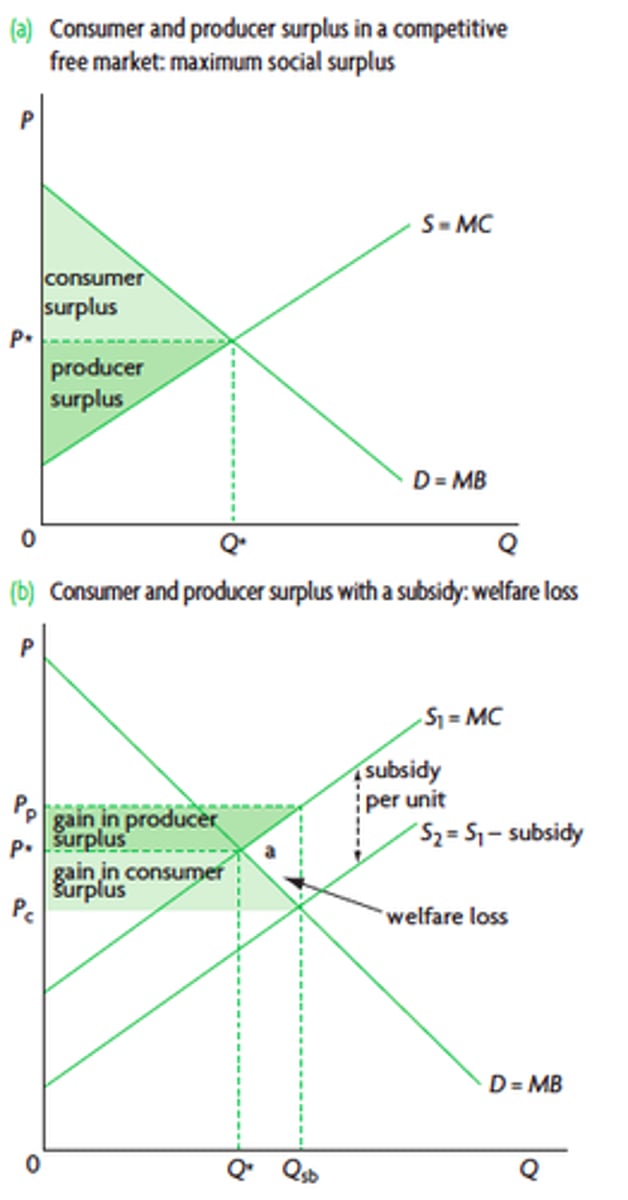
consumer surplus
The difference between the maximum amount a person is willing to pay for a good and its current market price.

producer surplus
the difference between the lowest price a firm would be willing to accept for a good or service and the price it actually receives
elasticity
a measure of responsiveness to a change in another variable
PED
the responsiveness of the quantity demanded to a change in price
price elastic demand
% change in QD> % change in P
price inelastic demand
%change in QD< % change in P
unit elastic demand
% change in QD=% change in P
PED determinants
ease of substitution
luxury or necessity
frequency of purchase
proportion of income
elasticity is effected by...
time period
width of market definition
elastic demand curve
Elasticity is greater than 1, quantity moves proportionately more than the price
inelastic demand curve
Elasticity is less than 1, quantity moves proportionately less than the price
PED
% change in QD/% change in P
values of PED
elastic= -1 to -infinity
inelastic= 0 to -1
it is always negative to show that the relationship between price and quantity demanded in inverse
PED: effect on total revenue
ELASTIC: price rises= total revenue falls
price falls= total revenue rises
INELASTIC: price rises= total revenue rises
price falls= total revenue falls
UNIT ELASTIC: price rises= no change
price falls= no change
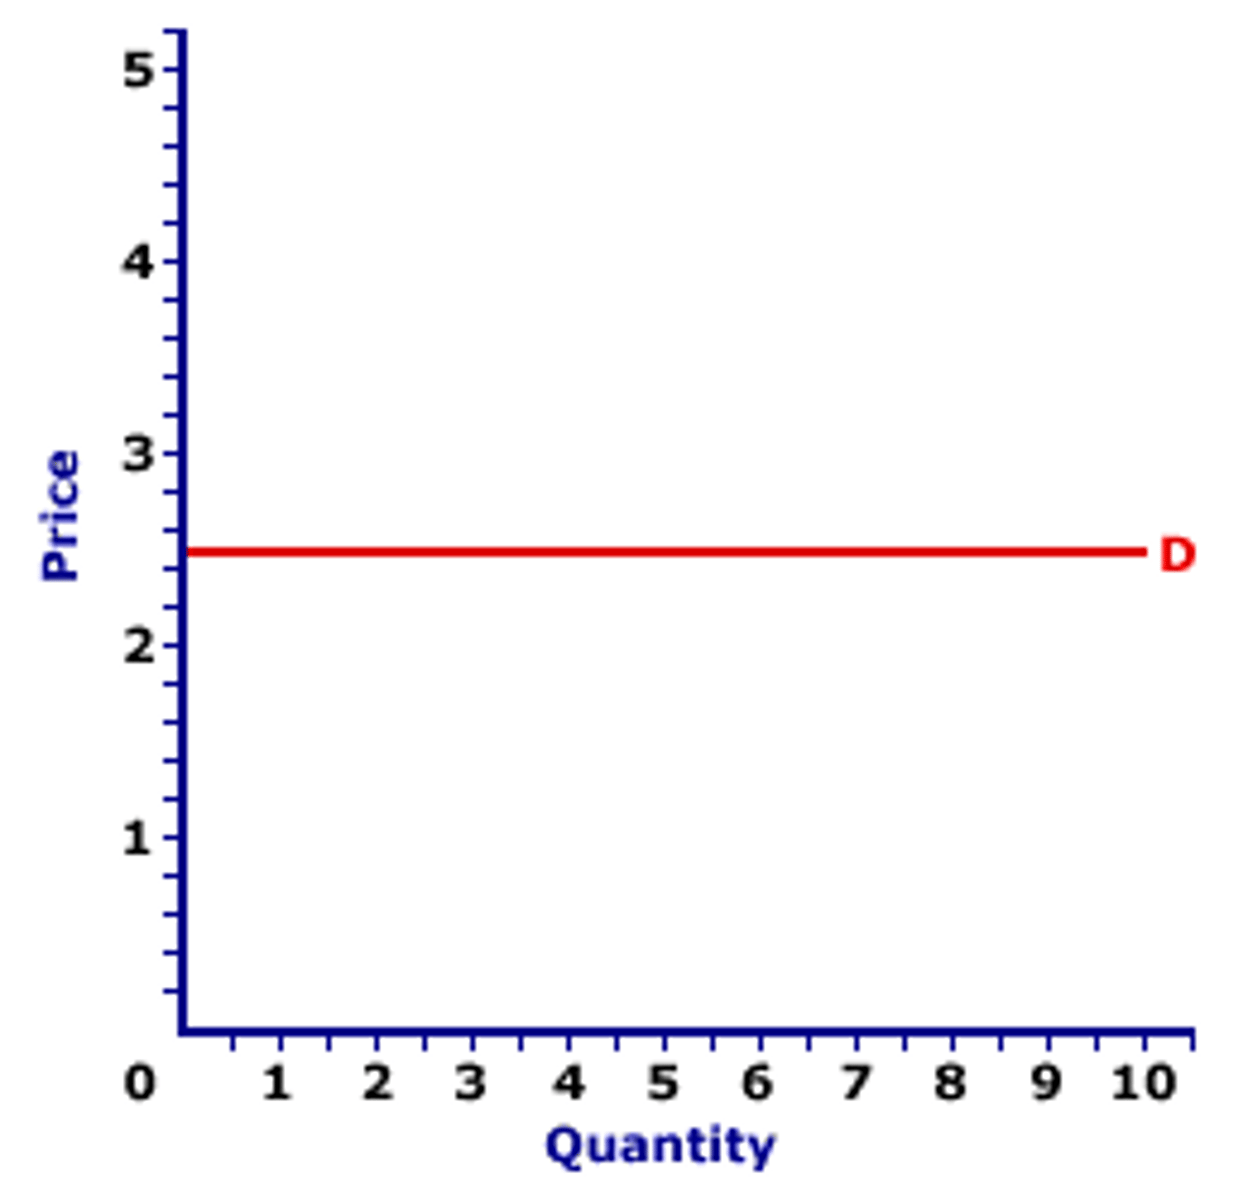
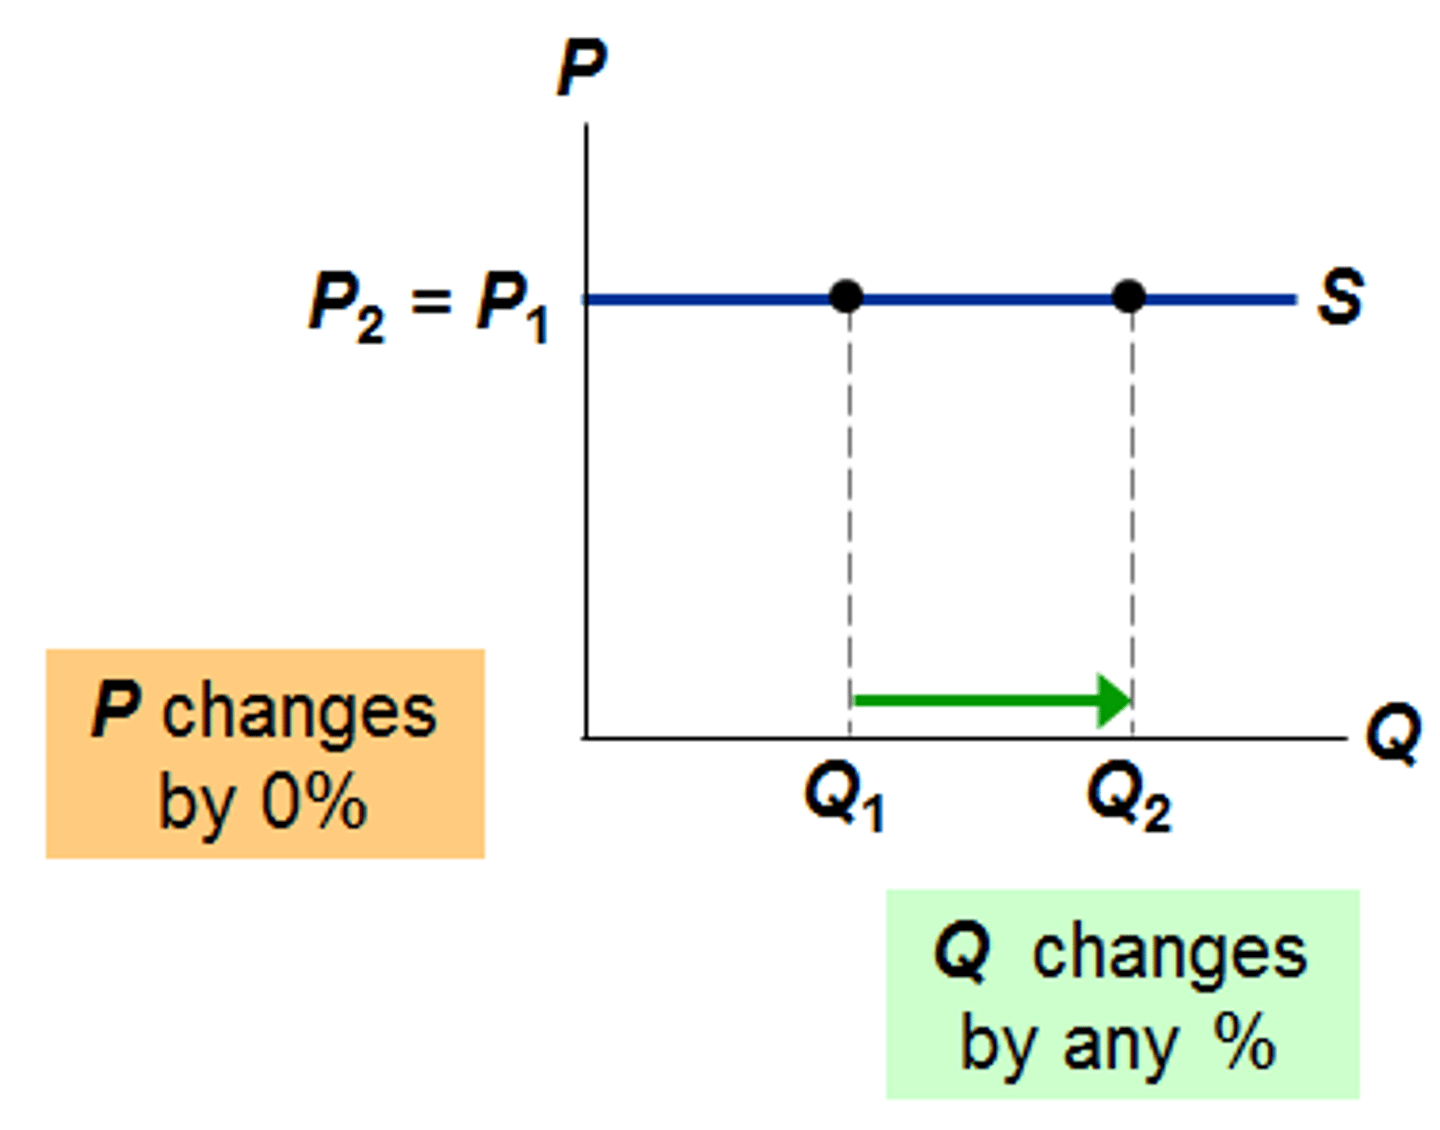
perfectly elastic demand curve
a horizontal line reflecting a situation in which any price increase reduces quantity demanded to zero; the elasticity has an absolute value of infinity
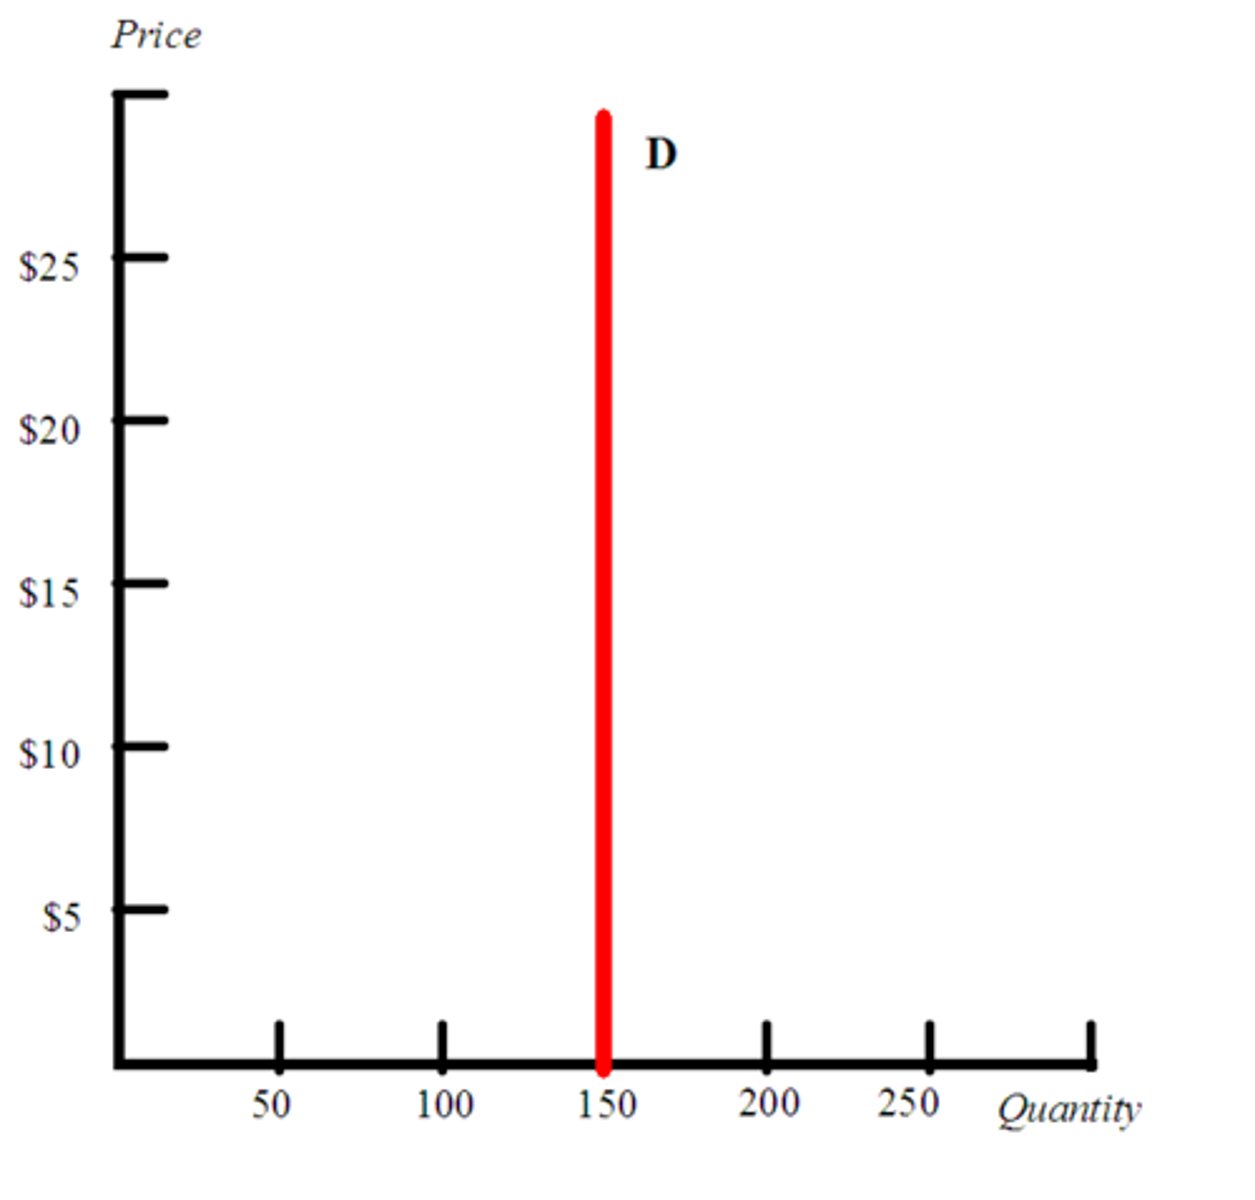
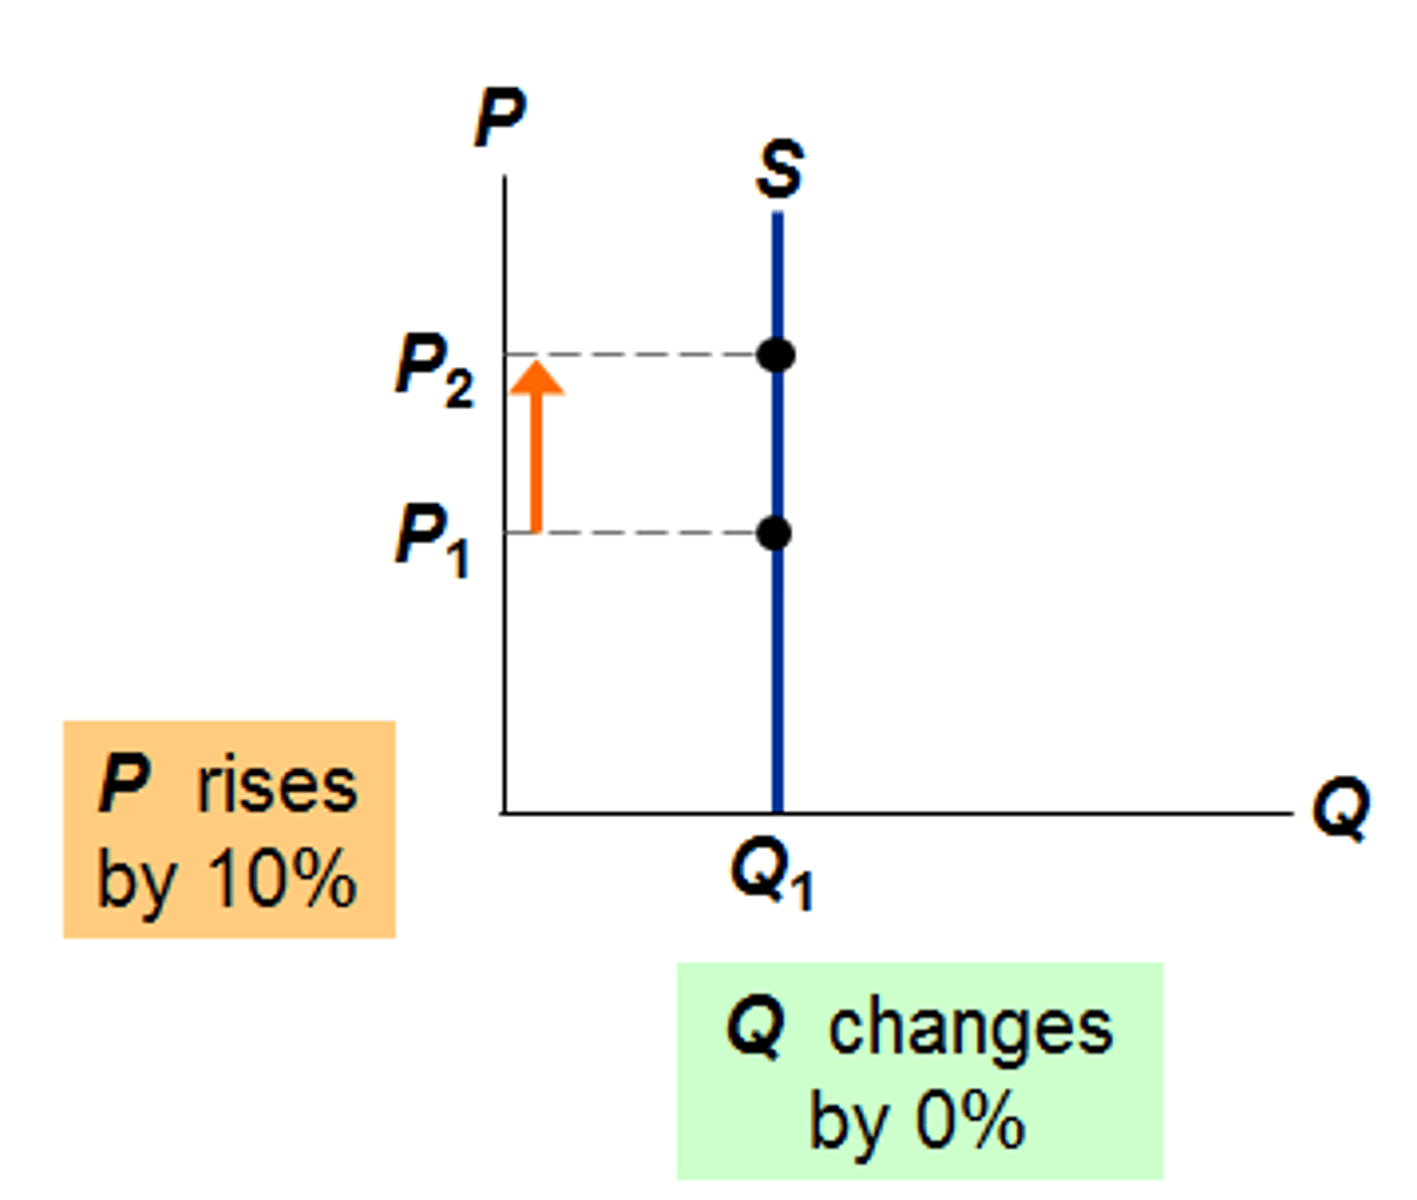
perfectly inelastic demand curve
a vertical line reflecting a situation in which any price change has no effect on the quantity demanded; the elasticity value equals zero
income elasticity of demand
measures responsiveness of quantity demanded to a change in income
YED
% change in QD/ % change in Y
YED normal goods
positive: rise in income causes a rise in quantity demanded
if it is a necessity it will likely be less than one
if it is a luxury it will likely be more than one
YED inferior goods
negative: a rise in income causes a fall in quantity demanded
YED values
NORMAL GOODS:
elastic= >1
inelastic= <1
INFERIOR GOODS:
elastic= -1 to - infinity
inelastic= 0 to -1
Cross elasticity of demand
measures responsiveness of quantity demanded of good A to a price change of good B
XED
% change QD A / % change P B
XED values
XED > 0 when they are substitutes
XED < 0 when they are complements
XED = 0 when they are unrelated
the more closely related they are the higher the numerical value
why XED is important for businesses
firms need to know how their demand will alter to a change in price of competitors
Price elasticity of supply
measures responsiveness of quantity supplied to a change in price
PES
% change in QS / % change in P
PES values
always positive to reflect direct relationship between price and quantity supplied
PES > 1 = relatively elastic
PES < 1 = relatively inelastic
Perfectly elastic PES
supplies any amount at the same price, at a constant cost per unit, no production limits
PES = infinity
Perfectly inelastic PES
no matter the change in price, supply won't change
PES = 0
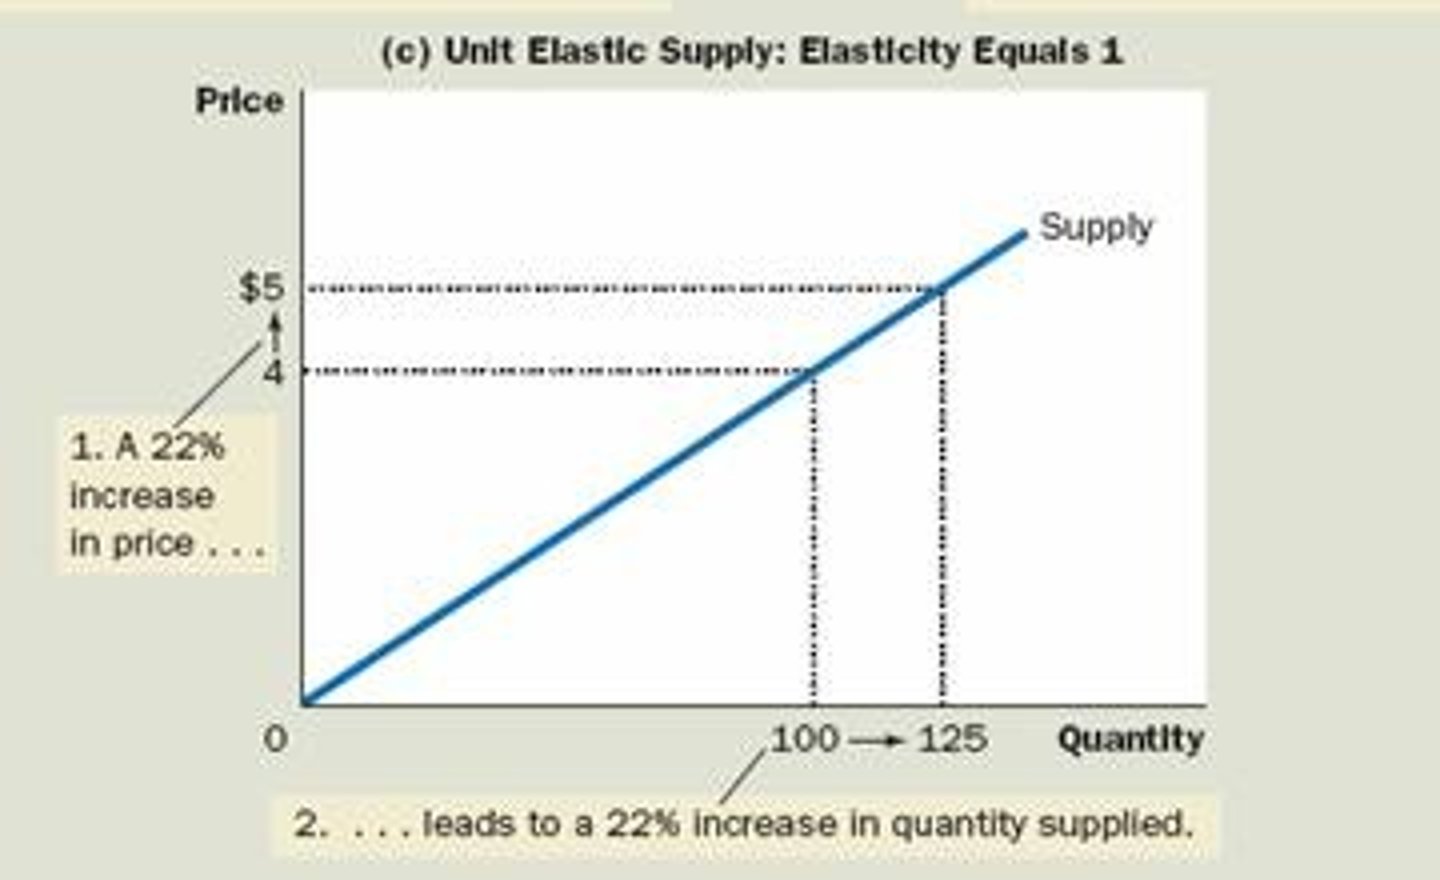
Unit elastic PES
% change QS = % change P
length of production period
availability of spare capacity
ease of expanding capacity
access to raw materials
ease of accumulating stock
number of firms/ ease of entering
time
Determinants of PES
Short run vs Long run
Short run- difficult to adjust production as some factors of production are fixed so supply is inelastic
Long run- all factors are adjustable so firms can change supply in response to price change - more elastic
an involuntary fee levied on individuals and corporations by the government
tax
tax is charged on...
income
wealth
spending
levied directly on an individual organisation, payed on income or profit ( income tax, national insurance)
Direct tax
charged on values of goods, services or properties. Charged when consuming goods or using services, responsibility of consumer ( VAT, council tax )
Indirect tax
doesn't depend on value of good but is a fixed amount on each unit
Indirect tax: specific tax
based on retail price of a good or service ( VAT )
Indirect tax: ad valorem
proportion of tax liability rises as an individual or entity's income rises
Progressive tax
those with lower incomes pay a higher amount of it in tax compared to higher earners, percentage of tax as a percentage of income decreases
Regressive tax
charges same rate to tax payers regardless of income, a set percentage of their income
Proportional tax
tax burden allocated to buyer an seller when an indirect tax is introduced, shifts supply curve left as price of production is higher so profitability is lower
incidence of tax
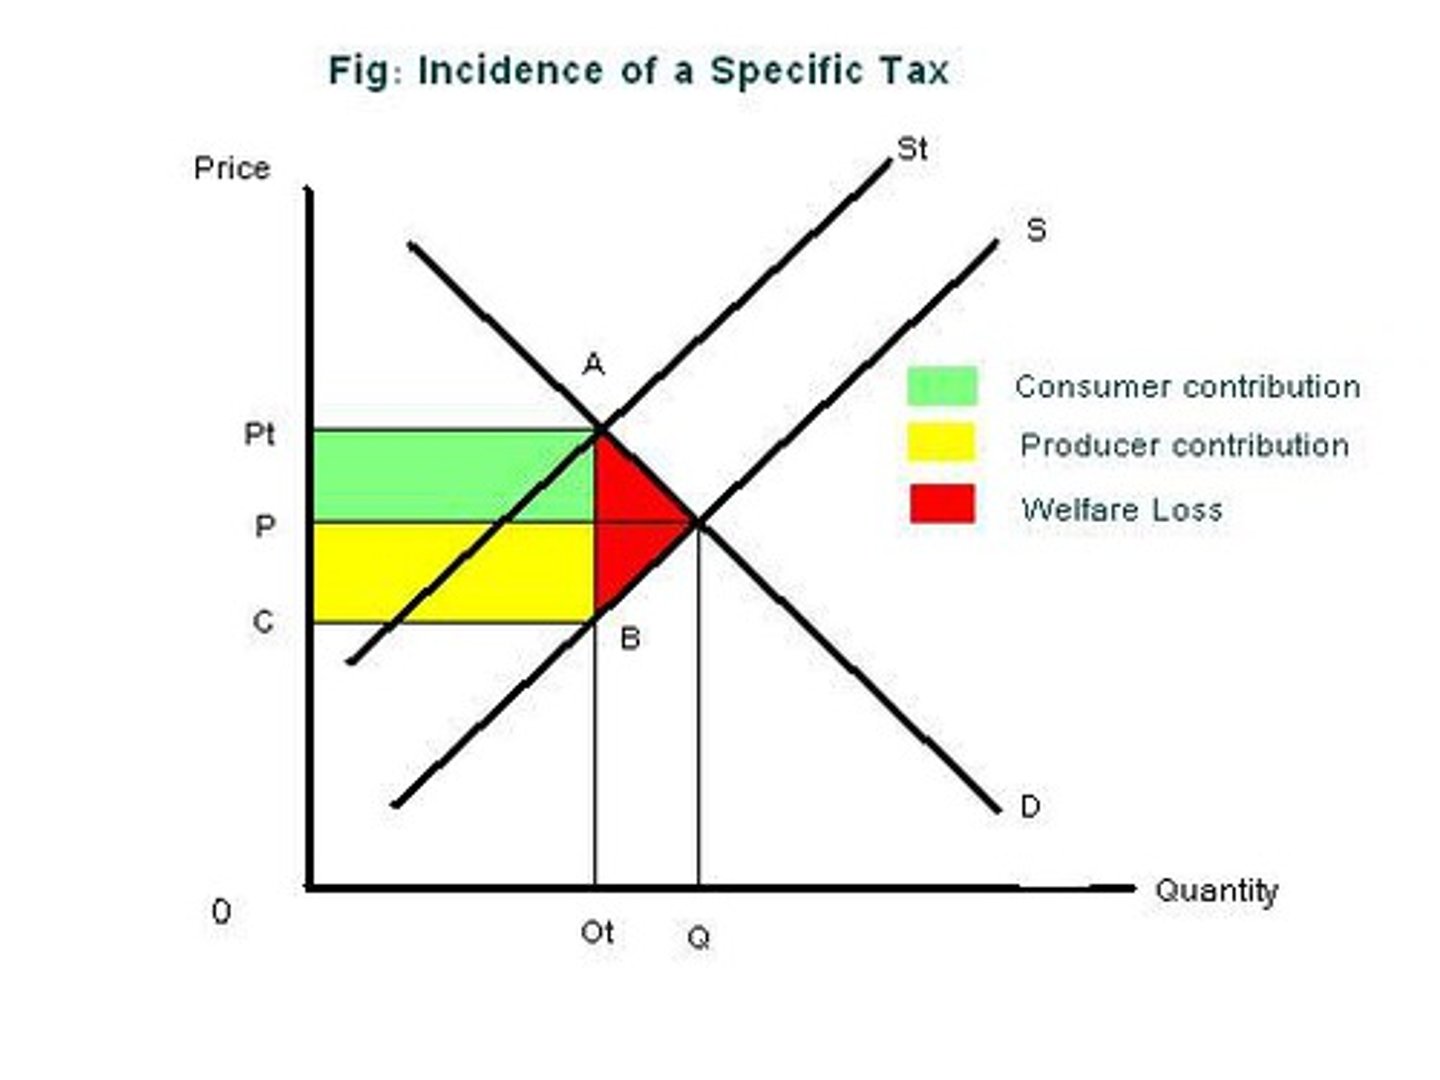
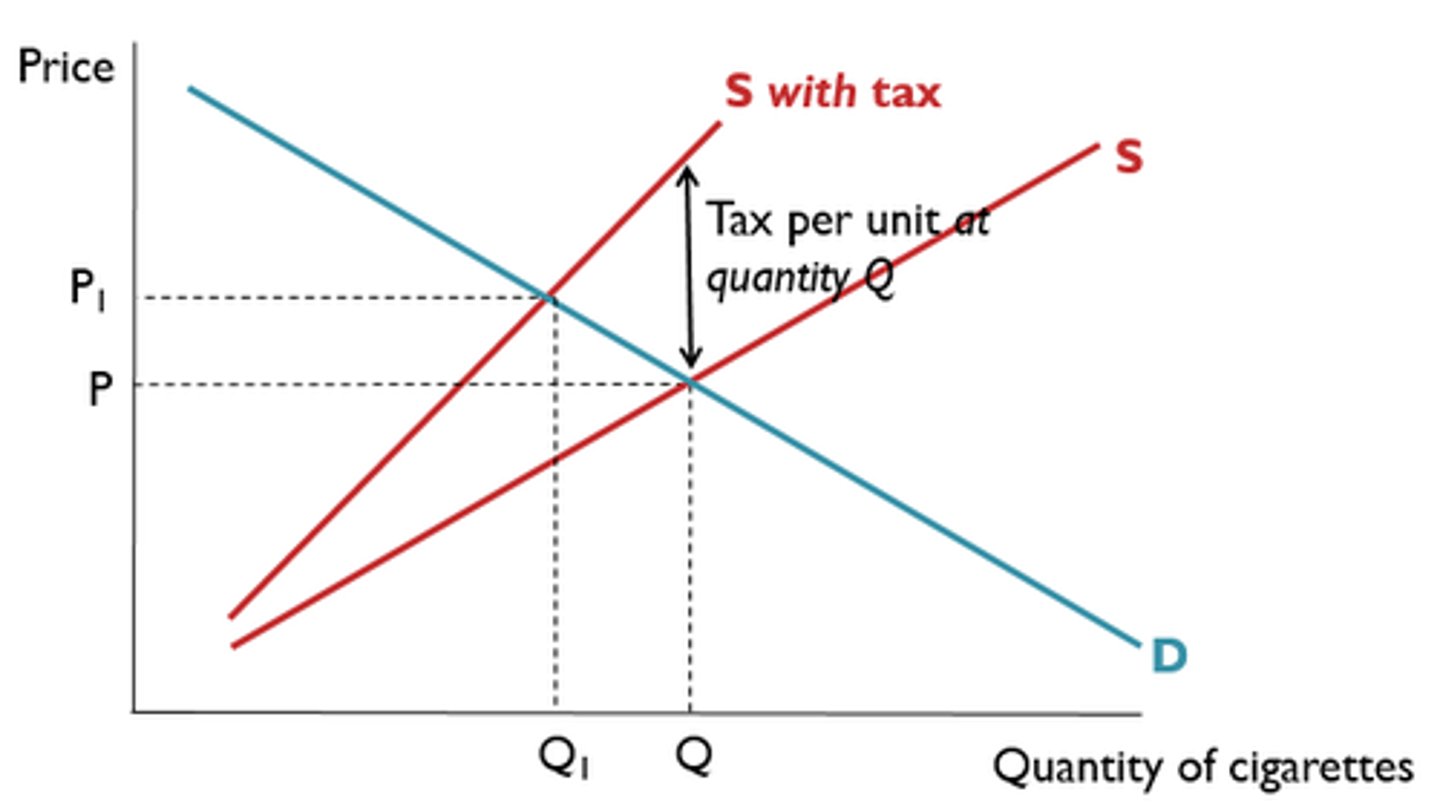
incidence of tax: elastic demand
producers have a greater incidence of taxation, if prices increase too much customers will leave
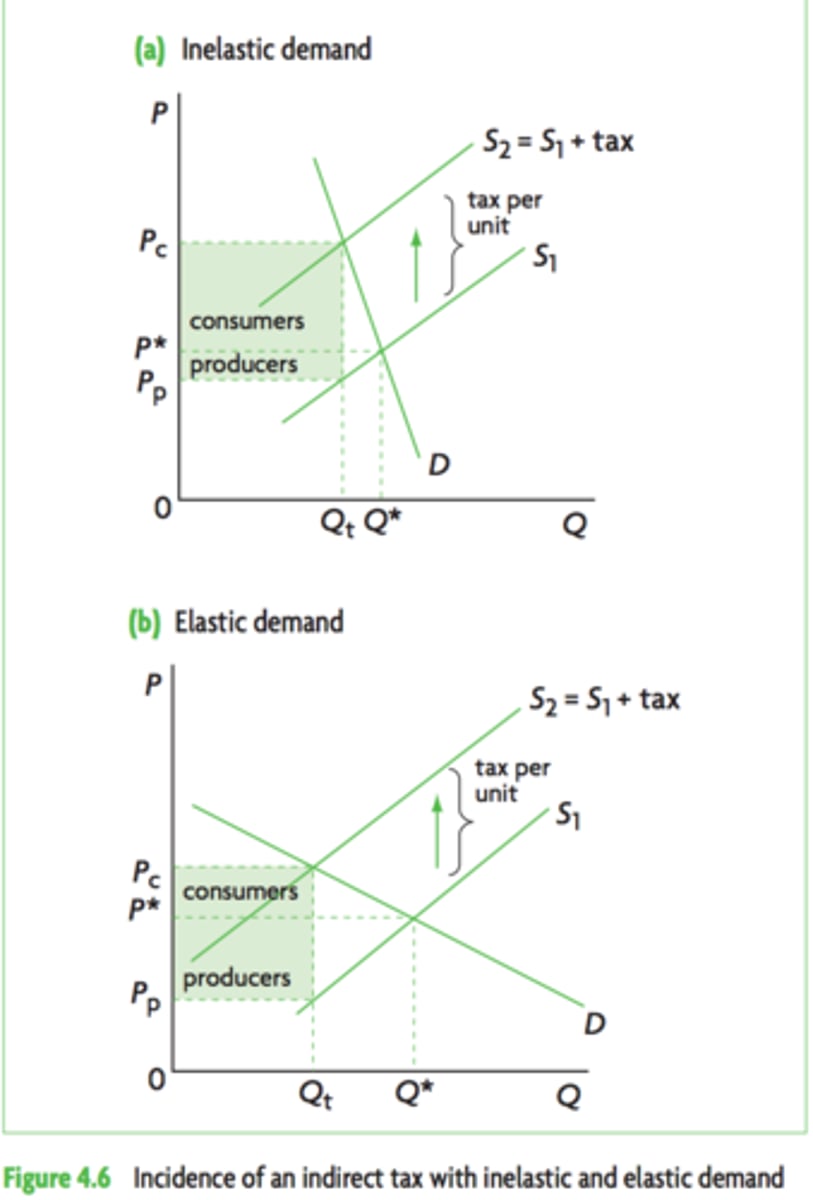
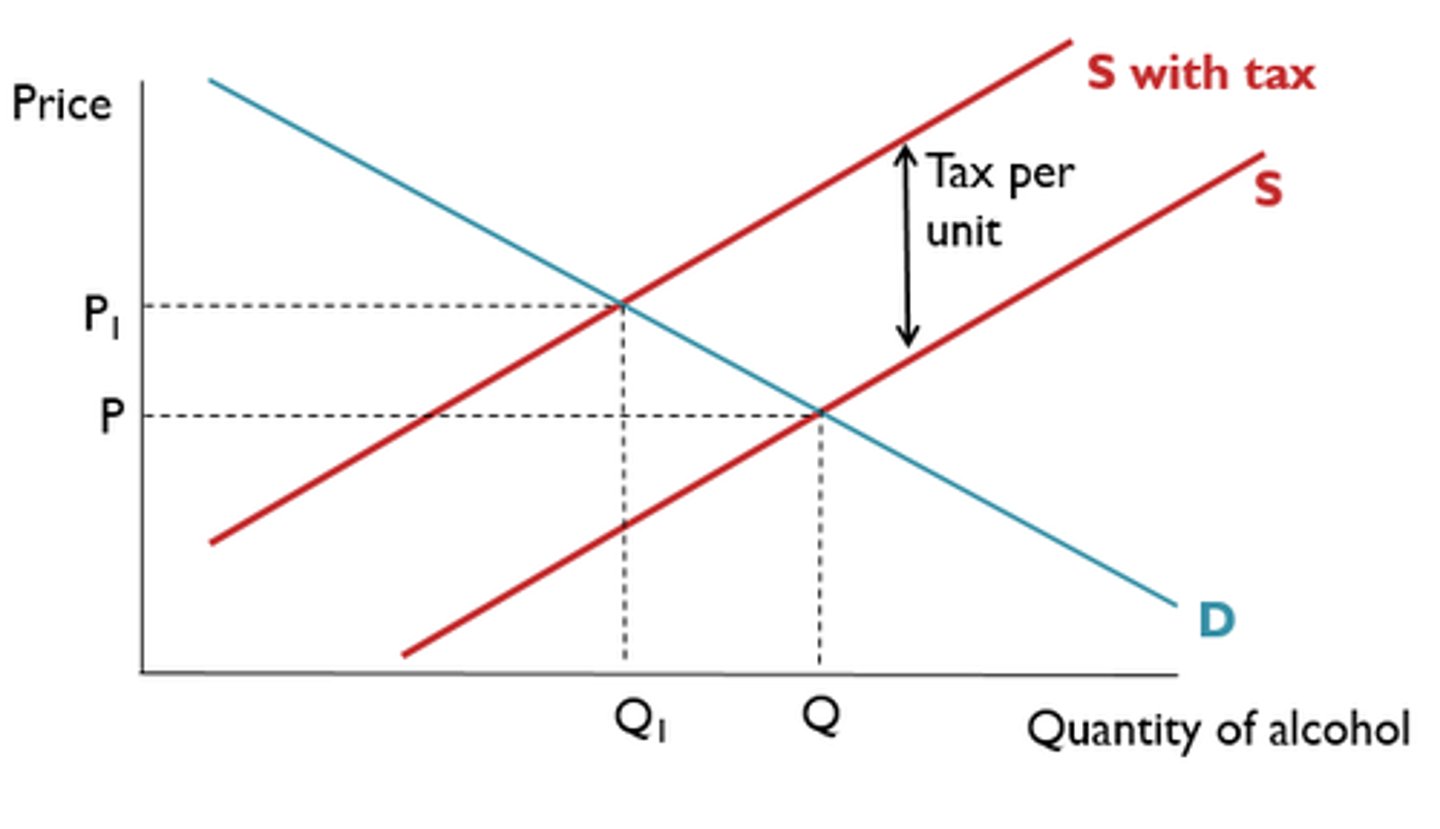
incidence of tax: inelastic demand
consumers have a greater incidence of taxation, if price increases customers still won't leave

decrease in surplus
may need to substitute
if demand is inelastic they will have less money for other goods
impact of tax on consumers
decrease in surplus
change in profits
change in revenues ( Depends on PED )
impact of tax on producers
increase in tax revenues ( amount of tax x equilibrium quantity) and savings on public services
chance to redistribute funds
impact of tax on the government
potential loss of employment
switch to producing other products
substitute industries may benefit
impact of tax on industry
specific tax graph
causes a parallel shift left because the price increase on each unit is the same
ad valorem tax graph
non-parallel shift left because the price increase gets bigger the more units
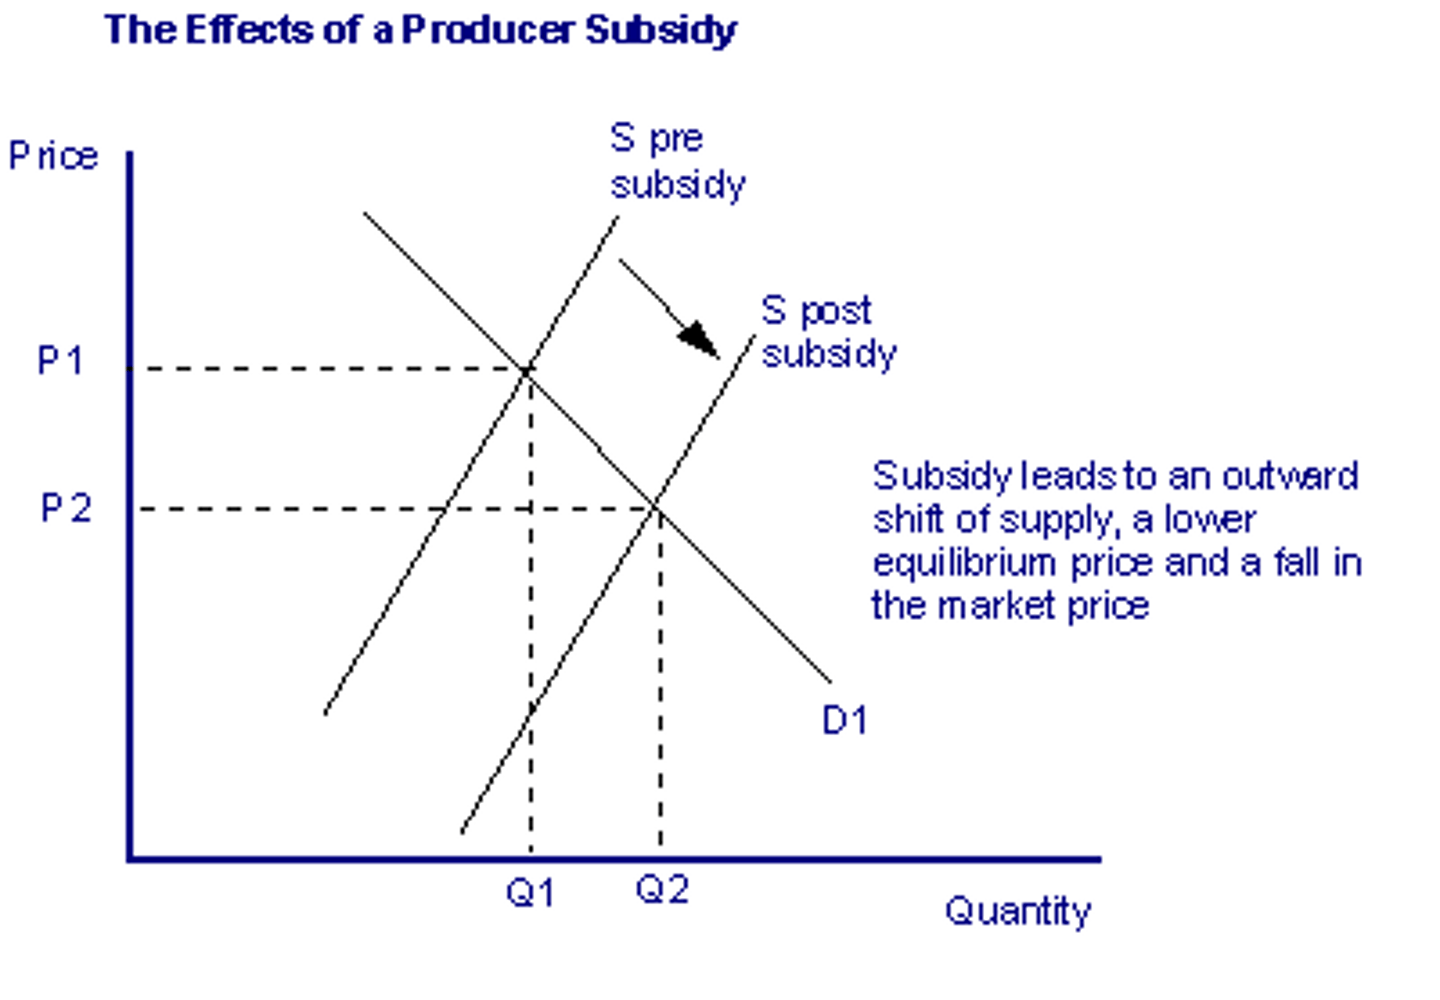
a non-refundable payment to a producer intended to lower the market price and encourage provision
reduces cost of production
leads to increased supply
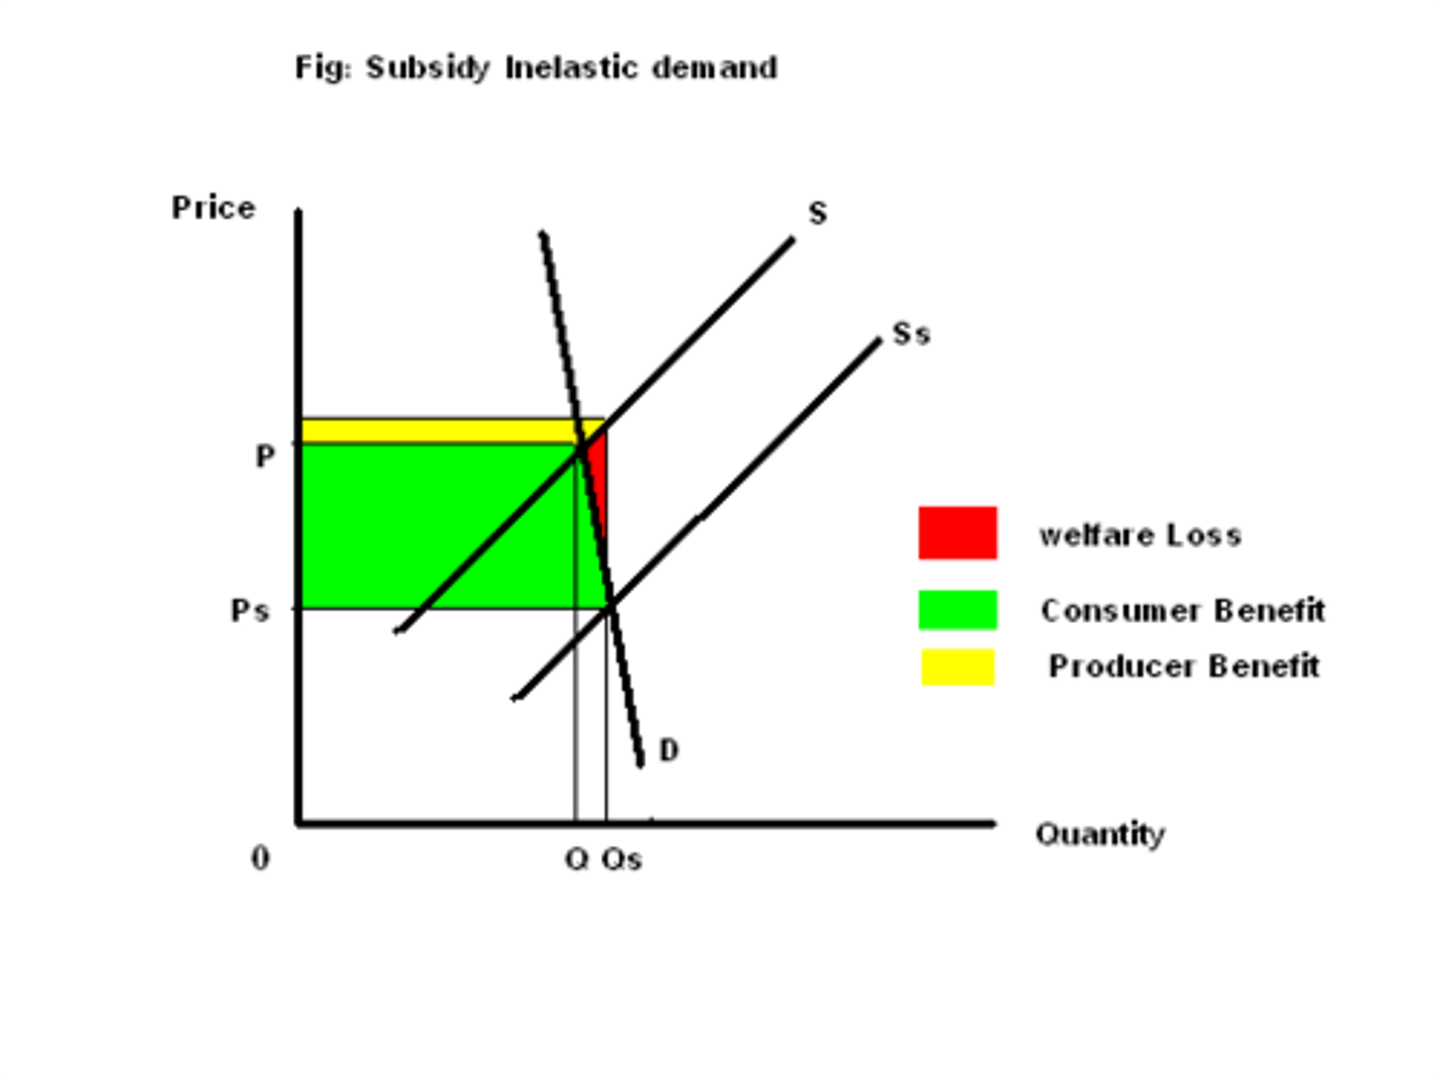
subsidy
Subsidy graph
shifts right because producers increase supply as reduced production costs increase profitability
incidence of subsidation
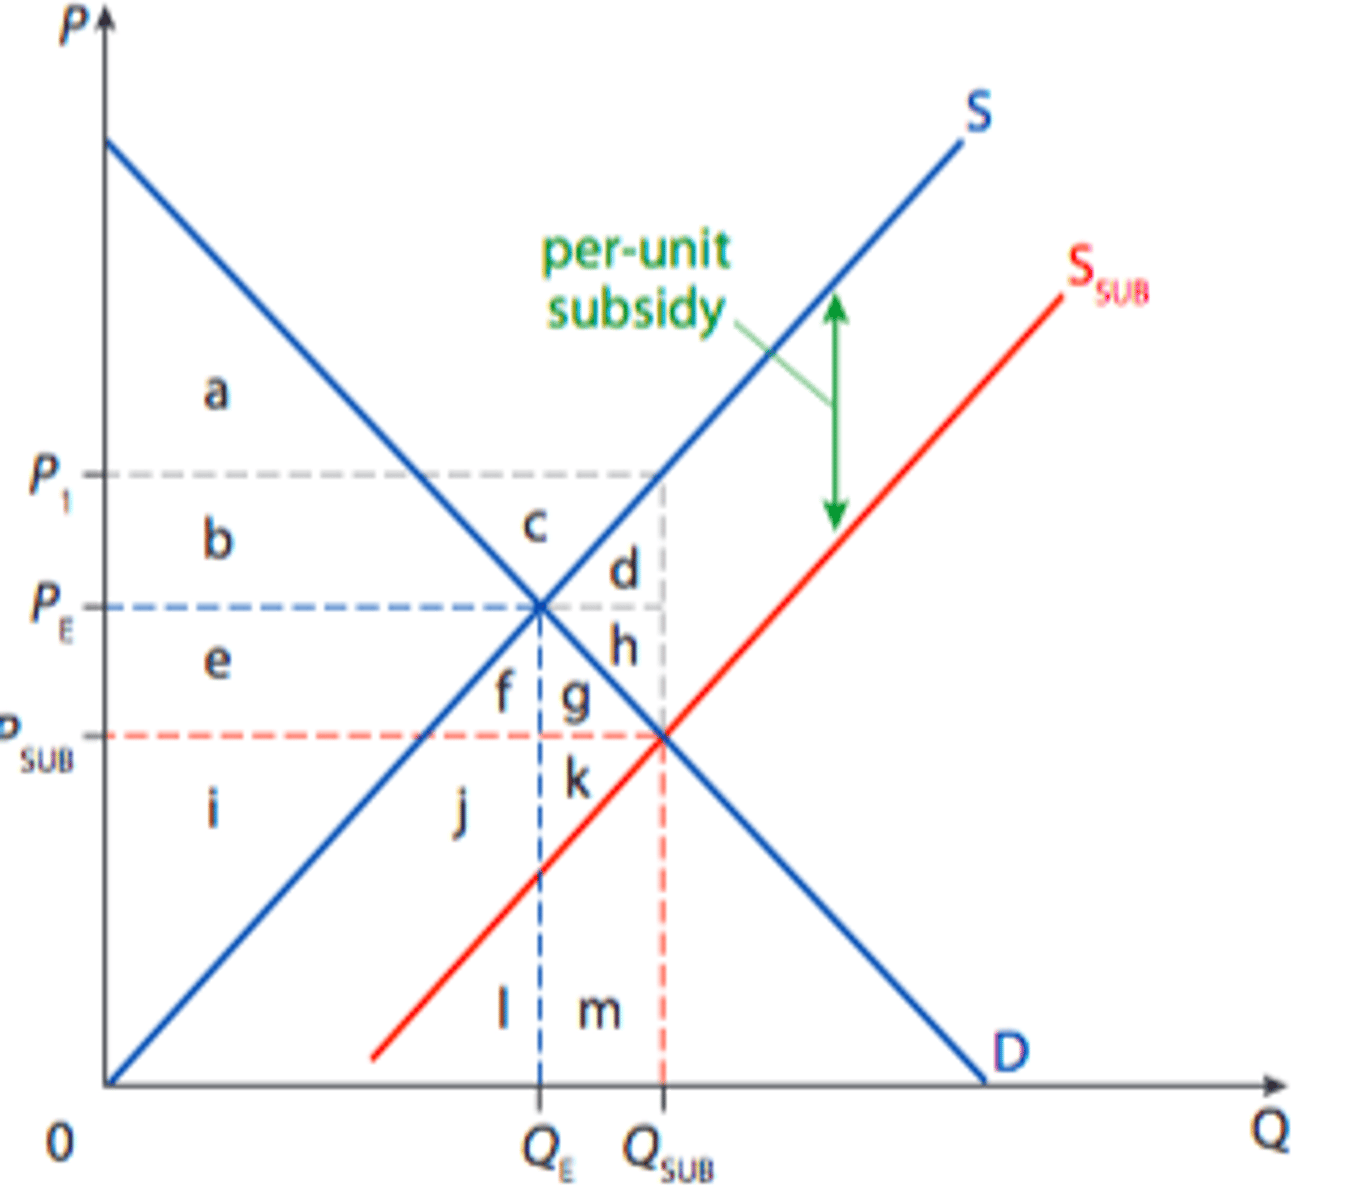
subsidies: surplus
both consumer and producer surplus increase meaning so does economic welfare
subsidies: elastic demand
producer gets most of the benefit from the subsidy

subsidies: inelastic demand
consumer gets most of the benefit from the subsidy