EXS 407 exam 2: Correlation and Regression
1/37
There's no tags or description
Looks like no tags are added yet.
Name | Mastery | Learn | Test | Matching | Spaced | Call with Kai |
|---|
No study sessions yet.
38 Terms
What is correlation?
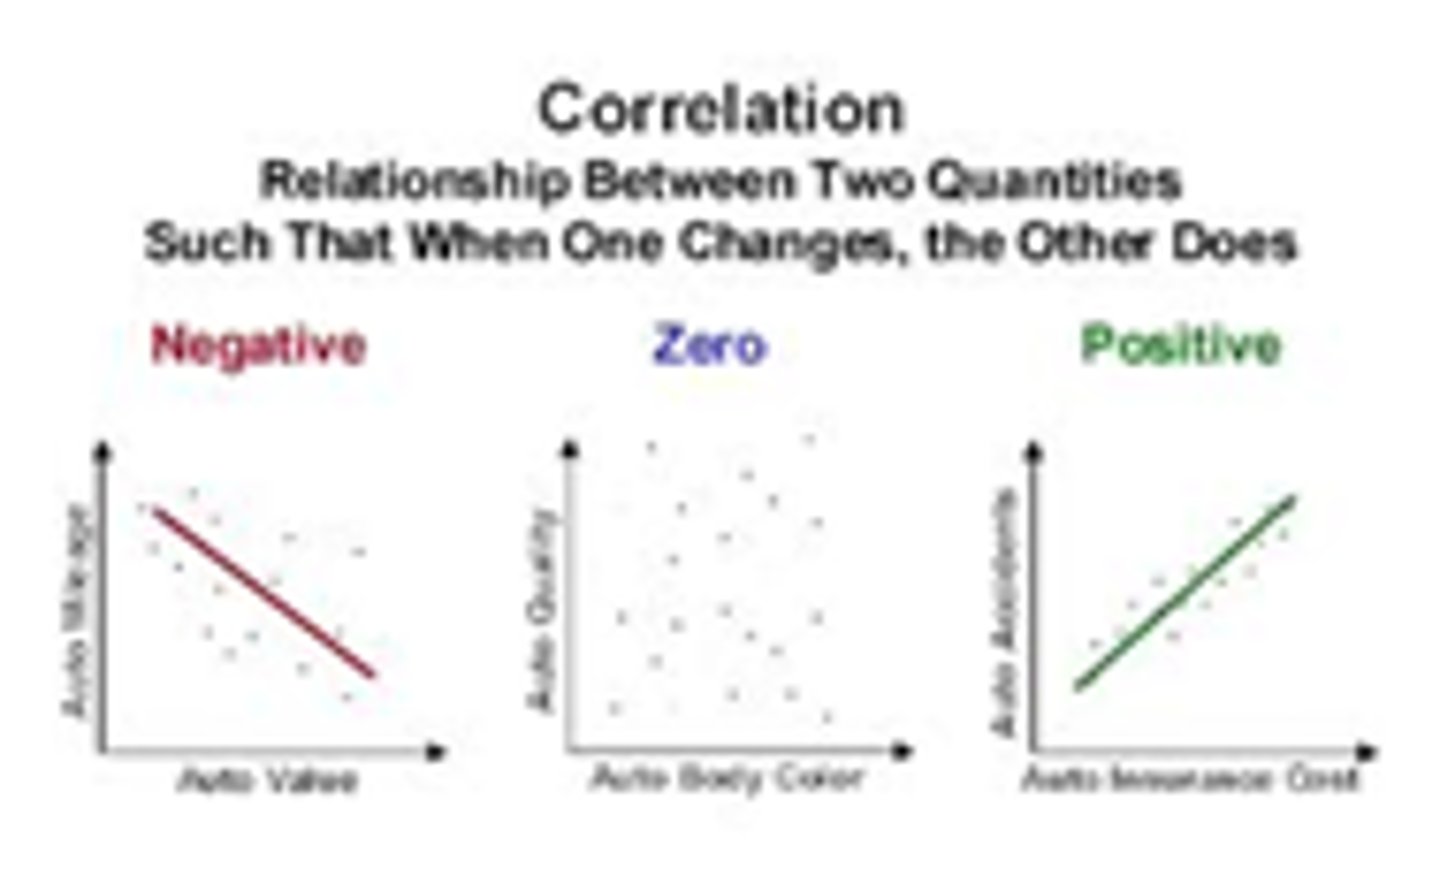
The degree of association between two interval-level variables, represented by a coefficient between +1.00 and -1.00.
What does a correlation coefficient of +1.00 indicate?
Perfect positive correlation, where deviations from the mean in both variables are equal in the same direction.
What does a correlation coefficient of -1.00 indicate?
Perfect negative correlation, where deviations from the mean in both variables are equal in opposite directions.
What does a correlation coefficient of 0 indicate?
No correlation, meaning there is no pattern to the size and direction of deviations from the mean between variables.
What is the significance of the sign of a correlation coefficient?
The sign indicates the direction of the relationship, while the magnitude indicates the strength.
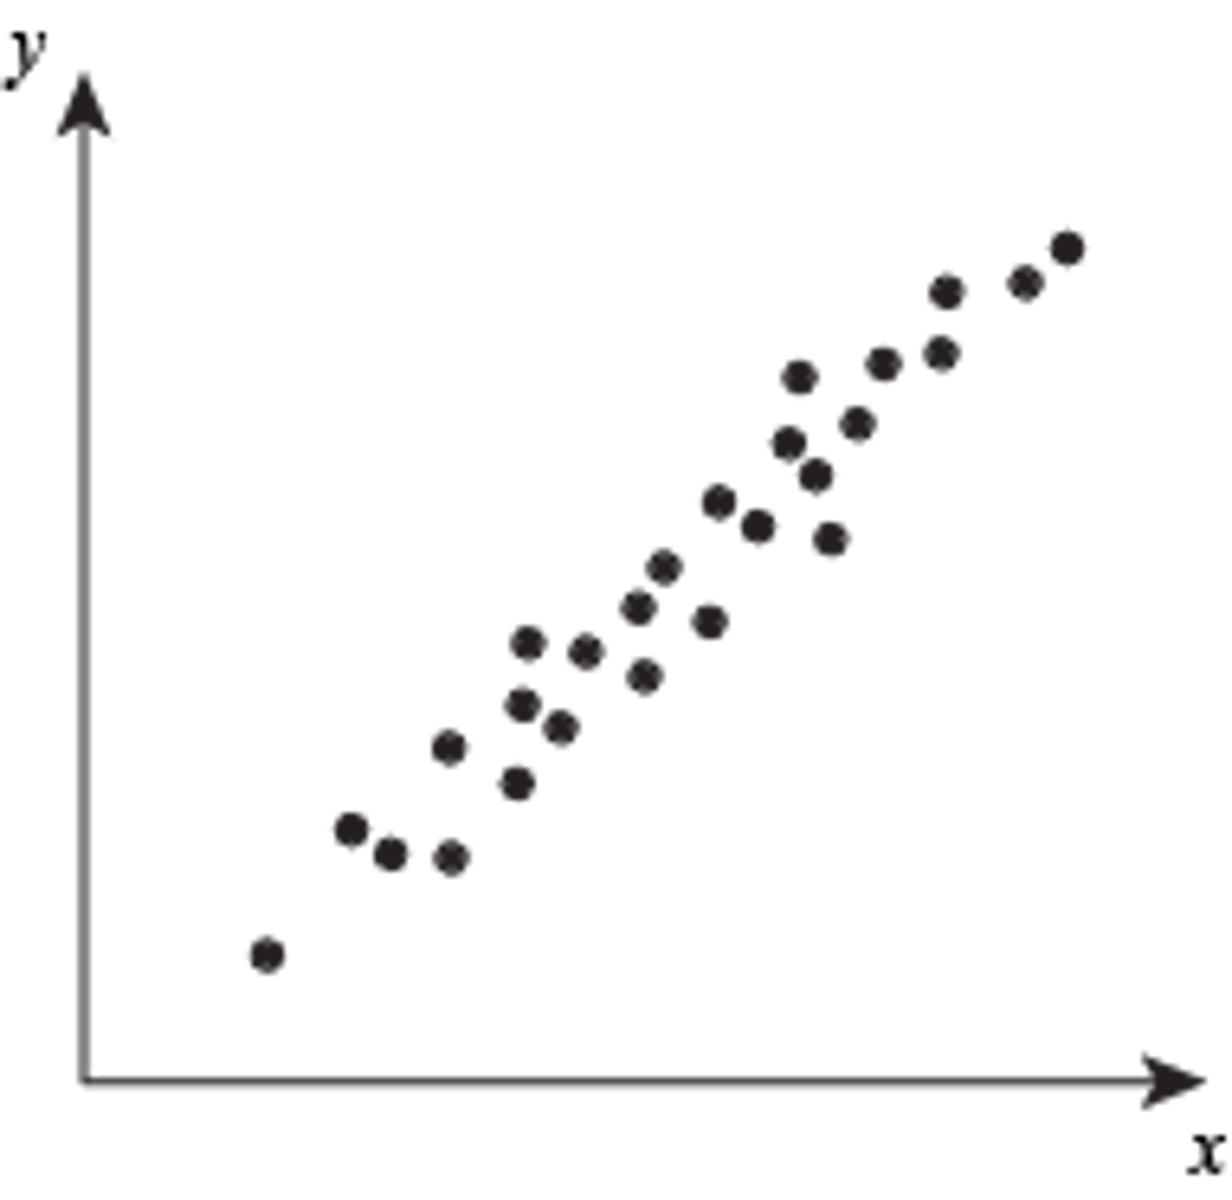
What is a scatter plot used for?
To visualize the correlation between two variables.
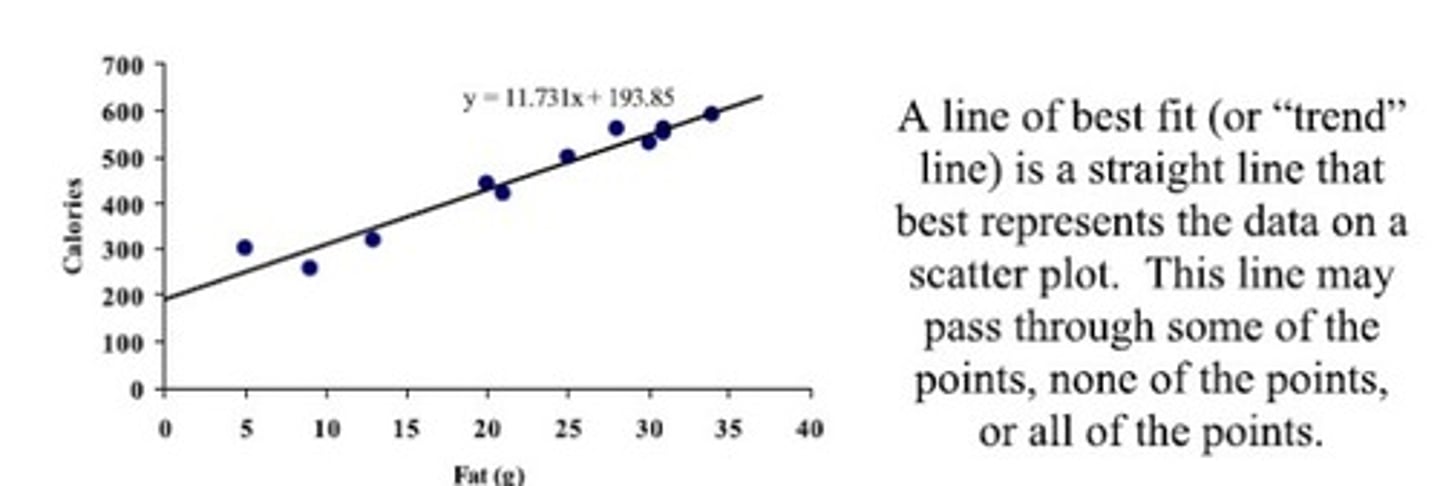
What is the line of best fit?
The best linear estimate of the relationship between variables
-minimizes residuals or error between measured and predicted values.
What is Pearson's Product Moment Correlation Coefficient?
(r) A method to calculate correlation
What are the assumptions of Pearson correlation?
Both variables must be continuous, each pair is independent, approximately normally distributed, the relationship must be linear, no outliers
What is Spearman's rank correlation?
A nonparametric test (less assumptions)
-do not need to be normally distributed
• Variables can be discrete (ordinal at least)
• Relationship between variables can be non-linear, but must be monotonic
• Less sensitive to outliers
What is the formula for Spearman's rank correlation coefficient?
𝜌 = 1 - (6 * Σd²) / (n(n² - 1)), where d is the difference between ranks and n is the number of observations.
interpreting correlation coefficients
Step 1: State the null and alternative hypotheses.
Step 2: Set the significance level.
Step 3: Determine the appropriate statistical test.
Step 4: Look up the critical value of 𝑟 or 𝜌.
Step 5: Calculate 𝑟 or 𝜌.
Step 6: Accept or reject the null hypothesis.
Step 7: Draw conclusions
What does a correlation coefficient of r = -0.8 indicate?
A strong negative correlation between the variables.
What does a monotonic relationship mean in correlation?
A relationship where one variable consistently increases or decreases as the other variable does, but not necessarily in a linear manner.
What is alpha (𝜶) in statistical testing?
The maximum acceptable probability that the observed relationship is due to chance to reject the null hypothesis.
What are degrees of freedom (𝒅f) in correlation?
The number of scores that are free to vary, calculated as 𝑑 = 𝑁umber of pairs - 2 for correlations.
What is the null hypothesis (H0) in correlation analysis?
H0 states that there is no association between the two variables (𝑟 or 𝜌 = 0).
What is the alternative hypothesis (HA) in correlation analysis?
HA states that there is an association between the two variables (𝑟 or 𝜌 ≠ 0.00).
What is the limitation of increasing the confidence interval from 95% to 99%?
It results in a wider confidence interval, which may reduce the precision of the estimate.
What is a Type II error?
Failing to reject the null hypothesis when it is actually false.
What is the first step in hypothesis testing?
Set the significance level.
What is the coefficient of determination (r²/p^2)?
It quantifies the shared variance between variables.
ex: "64% of the variance in 100 m dash times can be explained by the variance in long jump distances."
What does the phrase 'Correlation does not imply causation' mean?
A correlation between two variables does not mean that one causes the other.
Bivariate regression
(1 IV, 1 DV)
Strong enough correlations allow for predictions of one variable based on the values of another variable
• Line of best fit = equation to predict the dependent variable from the independent variable(predictor)
𝑦𝑝𝑥 = 𝛽0 + 𝛽1 𝑥 + 𝜖
assumptions for bivariate regression
1. linear
2. Each pair must be independent
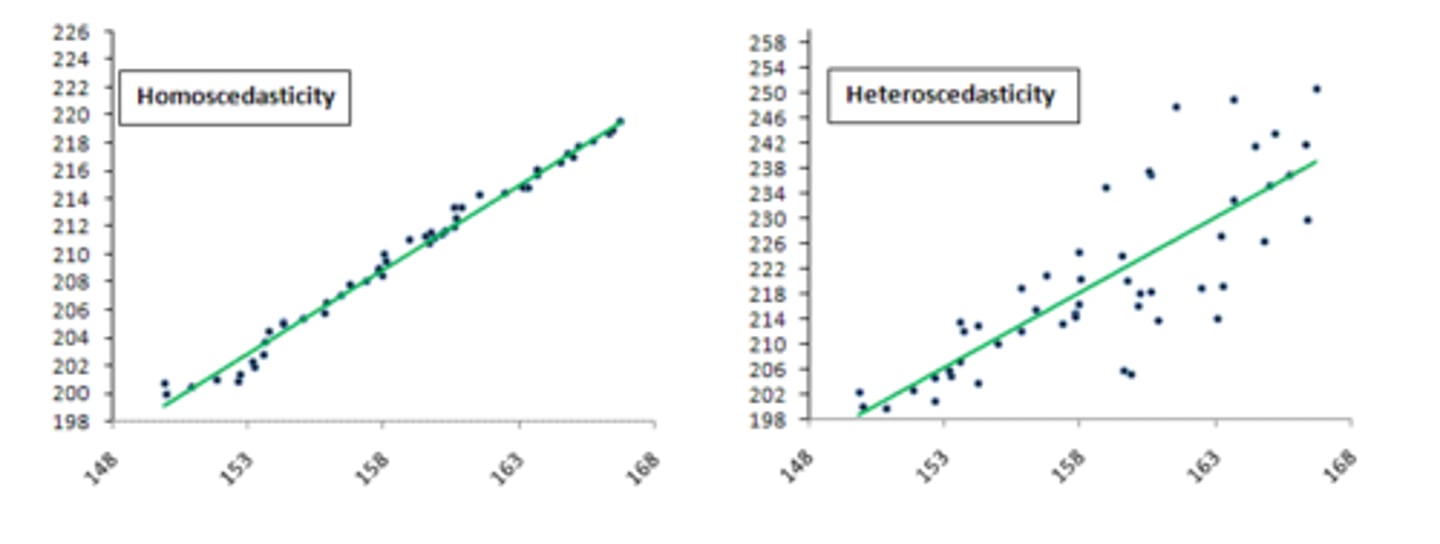
3. For any value of a predictor (IV), the dependent variable must be approximately normally distributed
4. The variance of the residuals must be consistent across the range of predictor values (a.k.a., homoscedasticity)
What is homoscedasticity in the context of regression?
The variance of the residuals must be consistent across the range of predictor values.
What is the equation for the line of best fit in regression analysis?
y = mx + b, where m is the slope and b is the y-intercept.
What does the slope coefficient (β1) represent in regression?
The change in the dependent variable for each one-unit change in the independent variable.
What does a high regression coefficient allow for?
It allows for predictions of one variable based on the values of another variable.
How is the standard error of the estimate (SEE) calculated?
SEE = √(∑(ypred - yactual)² / (n - 2))
-its the representation of the residuals/uncertainty
What is the significance of the t-statistic in regression analysis?
It is used to determine the significance of the slope coefficient (β1).
What does the residual in a regression model represent?
The amount of uncertainty in the estimate of the dependent variable.
What is the formula for calculating the slope coefficient (β1) using correlation?
β1 = r(SDy / SDx)
What are the null hypothesis (H0) and alternative (HA) in the context of regression coefficients?
H0: β1 = 0, meaning there is no relationship between the IV/DV variables.
HA: β1 ≠ 0, there is a relationship
What is the meaning of the term 'confidence interval' in regression?
It provides a range of values within which the true value of the parameter is expected to fall.
What does the coefficient of determination (r²) indicate in practical terms?
It indicates the percentage of variance in the dependent variable that can be explained by the independent variable.
What is the relationship between the standard deviation of residuals and prediction accuracy?
A smaller standard deviation of residuals indicates more accurate predictions.
What is the significance of the critical value in hypothesis testing?
It is used to determine whether to accept or reject the null hypothesis.