biom301 mod 4 - probability
1/24
There's no tags or description
Looks like no tags are added yet.
Name | Mastery | Learn | Test | Matching | Spaced |
|---|
No study sessions yet.
25 Terms
probability
you know the population values and predict the likelihood of certain outcomes/samples collected
opposite of statistics
experiment
the process that yields one random result or observation
experiment is spinning the spinner
outcome
all the possible results
outcomes are landing on yellow, green, blue, or red
event
one of the outcomes of interest
might be interested in landing on blue
probability (spinner example)
the measure of how likely an event is to happen
the probability of landing on blue is 1 out of 4
¼
25%
0.25
3 probability methods
empirically
theoretrically
subjectively
ways so show probability
fraction → 10/100
decimal → 0.1
percent → 10%
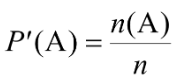
empirical probability
determines probability by running an experiment many times
used when it’s not obvious what the results should be
uses results to estimate probability of that even
long-term behavior (large sample size)
P = probability
P’ = empirical probability
A = specific outcomes
n(A) = # of times the event “A” has occurred
n = total # of times the experiment is attempted
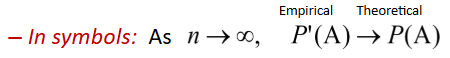
Law of Large Numbers
with repetition, empirical results will approach the expected theoretical probability
subjective probability
probability determined based on personal judgement
be critical of a person’s expertise
theoretical probability
calculate probability through reasoning or calculation
P(A) = theoretical probability
4 approaches to show probability experiment results
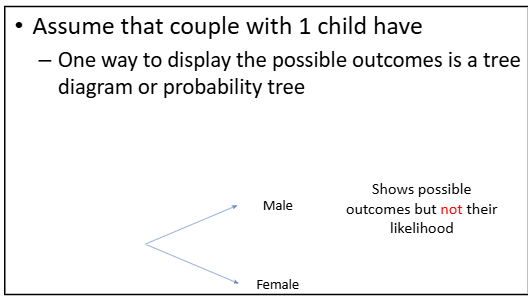
probability tree
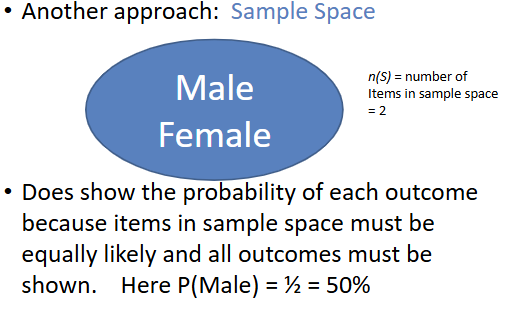
sample space
venn diagram
contingency table
simple events
run the experiment one time
probability tree
shows the outcomes, not probability
sample space
a circle with all possible events inside the circle that are all equally likely
n(S) = the # of items in the sample space
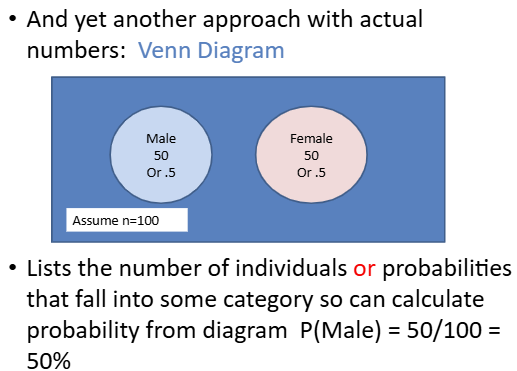
Venn diagram
have circles that each represent an event and inside has the number or percent of the outcomes
all of the circles = total sample size
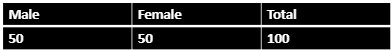
contingency table
always gives number of times something happens
calculate probability from info shown
P(female) = 50/100 = 0.5 = 50%
compound events
run the experiment more than 1 times
conditional probability
need to know
if Event A or Event B occurs
if Event A and Event B occurs
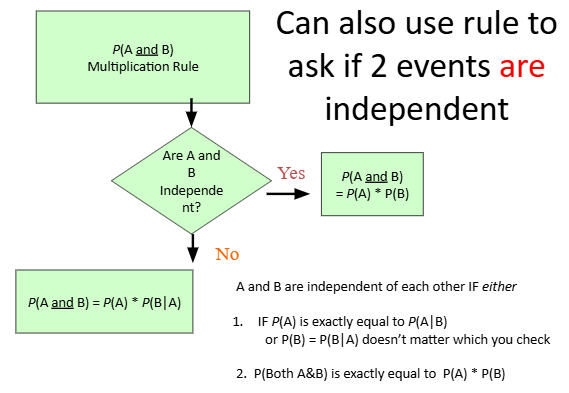
multiplication rule
P(A and B)
independent events → multiply probabilities together
P(2 female children)
= P(1st F child) x P(2nd F child) → 0.48 × 0.48 = 0.23 → 23%
probability that both will occur will have smaller probability than then individually
must be GIVEN probability of both
independence
when the outcome of the 1st event has NO influence on the outcome of the 2nd event
i.e rolling a dice
if 2 events are independent, what is the likelihood that Event A doesn’t change if you are looking at a subset of a population?
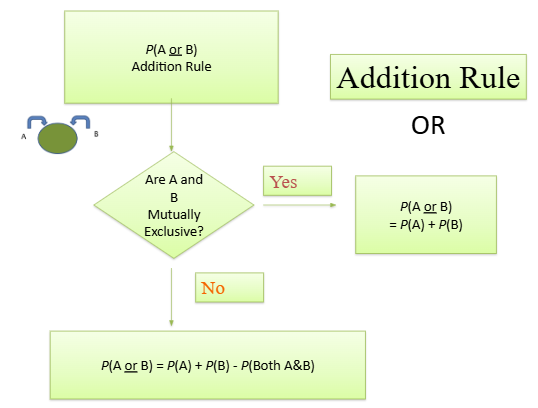
addition rule
P(A or B)
think about whether 1 outcome OR the other occurred
mutually exclusive events → ADD probabilities together
can be done w/ events that are NOT mutually exclusive
P(A or B) = P(A) + P(B) - P(both A&B)
some outcomes have been double counted & that probability must be removed
mutually exclusive
dependent events, considering one spot if filled with ‘A’, it can’t be filled with ‘B’
A & B are mutually exclusive if:
P(A&B) = 0
P(A or B) = P(A) + P(B)
more than 1 outcomes fulfill question so probably will increase
roll a dice & get ‘6’ OR ‘5’
1/6 + 1/6 = 2/6 → 1/3
compliment
the probability that an event will NOT occur
compliment of A → probability that Event A will NOT occur
Probability of the compliment = 1
P(A) = 1 - P(A)
sampling w/o replacements
sample w/o replacement for a compound event, need to change probability of event as you go
You have 10 balls in a jar, 7 balls are red, 3 balls are blue.
What is the probability of randomly sampling WITHOUT REPLACEMENT and getting the following balls in this order: Red, Red, Blue, Blue?
= (7/10) (6/9) (3/8) * (2/7)