geog 370 theory!
1/176
There's no tags or description
Looks like no tags are added yet.
Name | Mastery | Learn | Test | Matching | Spaced |
|---|
No study sessions yet.
177 Terms
geographic information
data that can be given a location in space (latitude, longitude)
earliest GIS use
John Snow's 1854 Cholera outbreak map
geographic information system
a system to organize, analyze, and visualize spatial data
discrete raster
classification of features in a landscape
continuous raster
resulting from measurement of an environmental variable such as temperature, elevation, etc.
data resolution
city, county, state, etc
global positioning system
efficient way to find a point in space and navigate to that point
trilateration
process of determining absolute or relative locations of points by measurement of distances, using the geometry of circles, spheres, or triangles
intersection of the satellite ranges, at least 4 needed
factors to improve GPS measurements
- receivers have a book to know when/where to expect a satellite
- satellites are in predictable orbits
- correction signals are sent from the satellite
- SBAS (WASS and EGNOS)
causes of measurement errors
changes in satellite orbit, the clock isn't perfect, selective availability
selective availability
got or military decision to add error on purpose
limit access
multipath effect
interference of buildings, trees, or mountains that result in the receiver not getting / reflecting signals
differential GPS
a correction method that uses a series of base stations at known locations on the ground to provide a correction of GPS positional information
can be processed in real time (requires a radio or cellphone signal) or later on
coordinate precision
each degree (111 km): location of a small country
1st decimal (11.1 km): positions of large cities
2nd decimal (1.1 km): positions of villages
3rd decimal (110 m): ID a large field/campus
4th decimal (11 m): ID a parcel of land, typical uncorrected GPS unit
5th decimal (1.1 m): distinguish trees from each other
categorical rasters
the number attached to each means a category
can be very useful for chloropleths
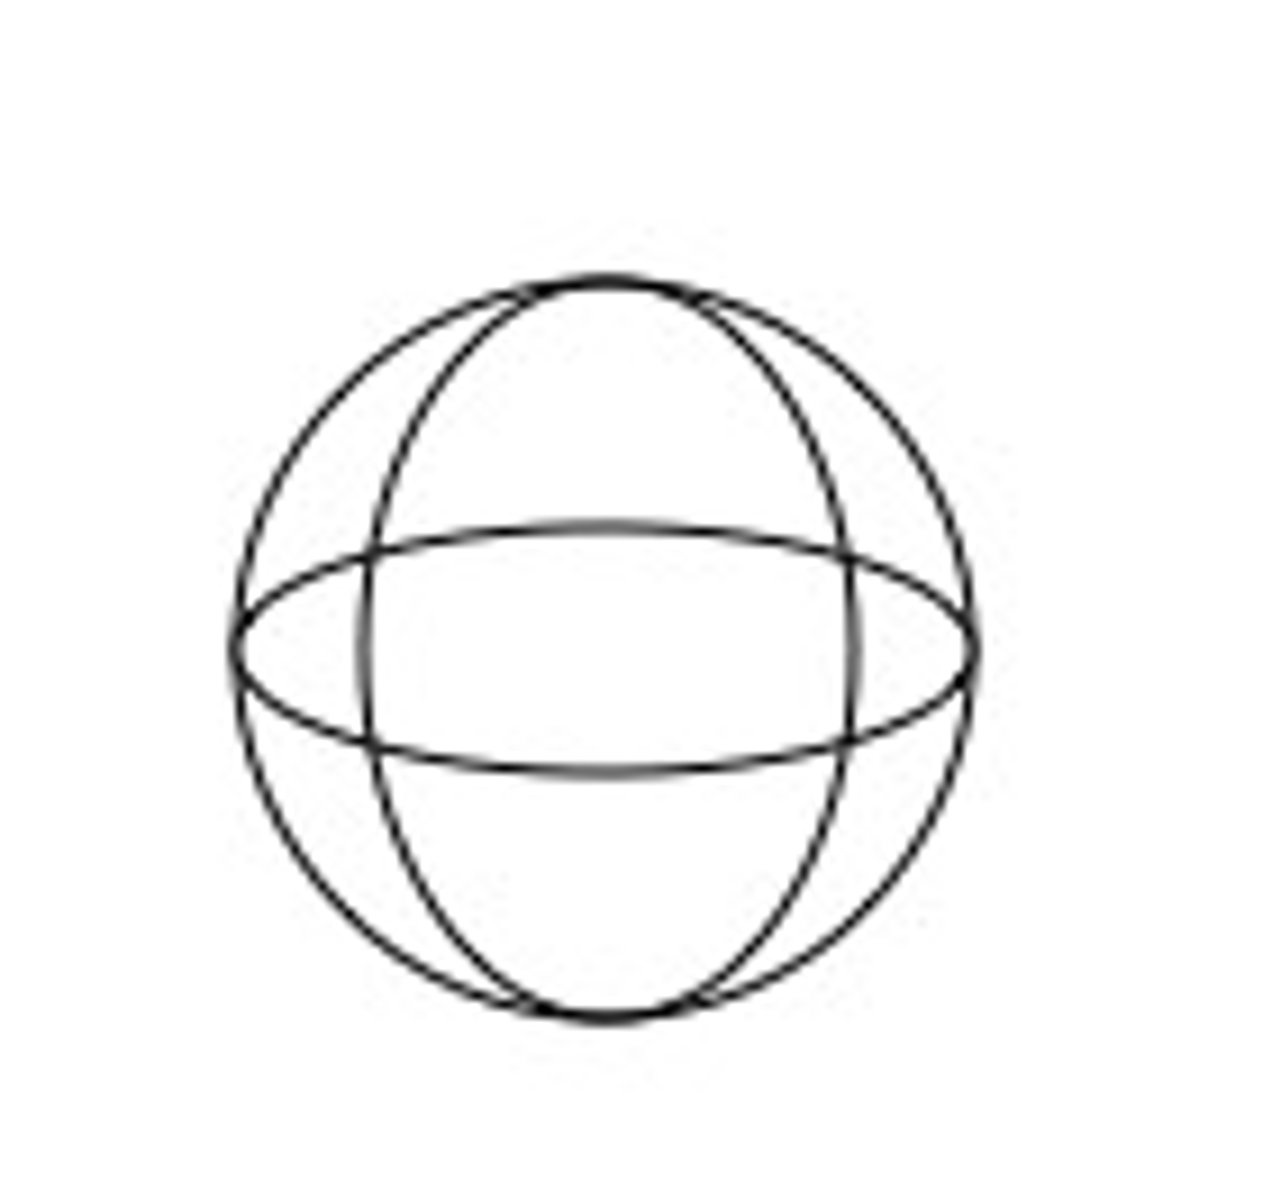
ellipsoid
a model of the rounded shape of earth
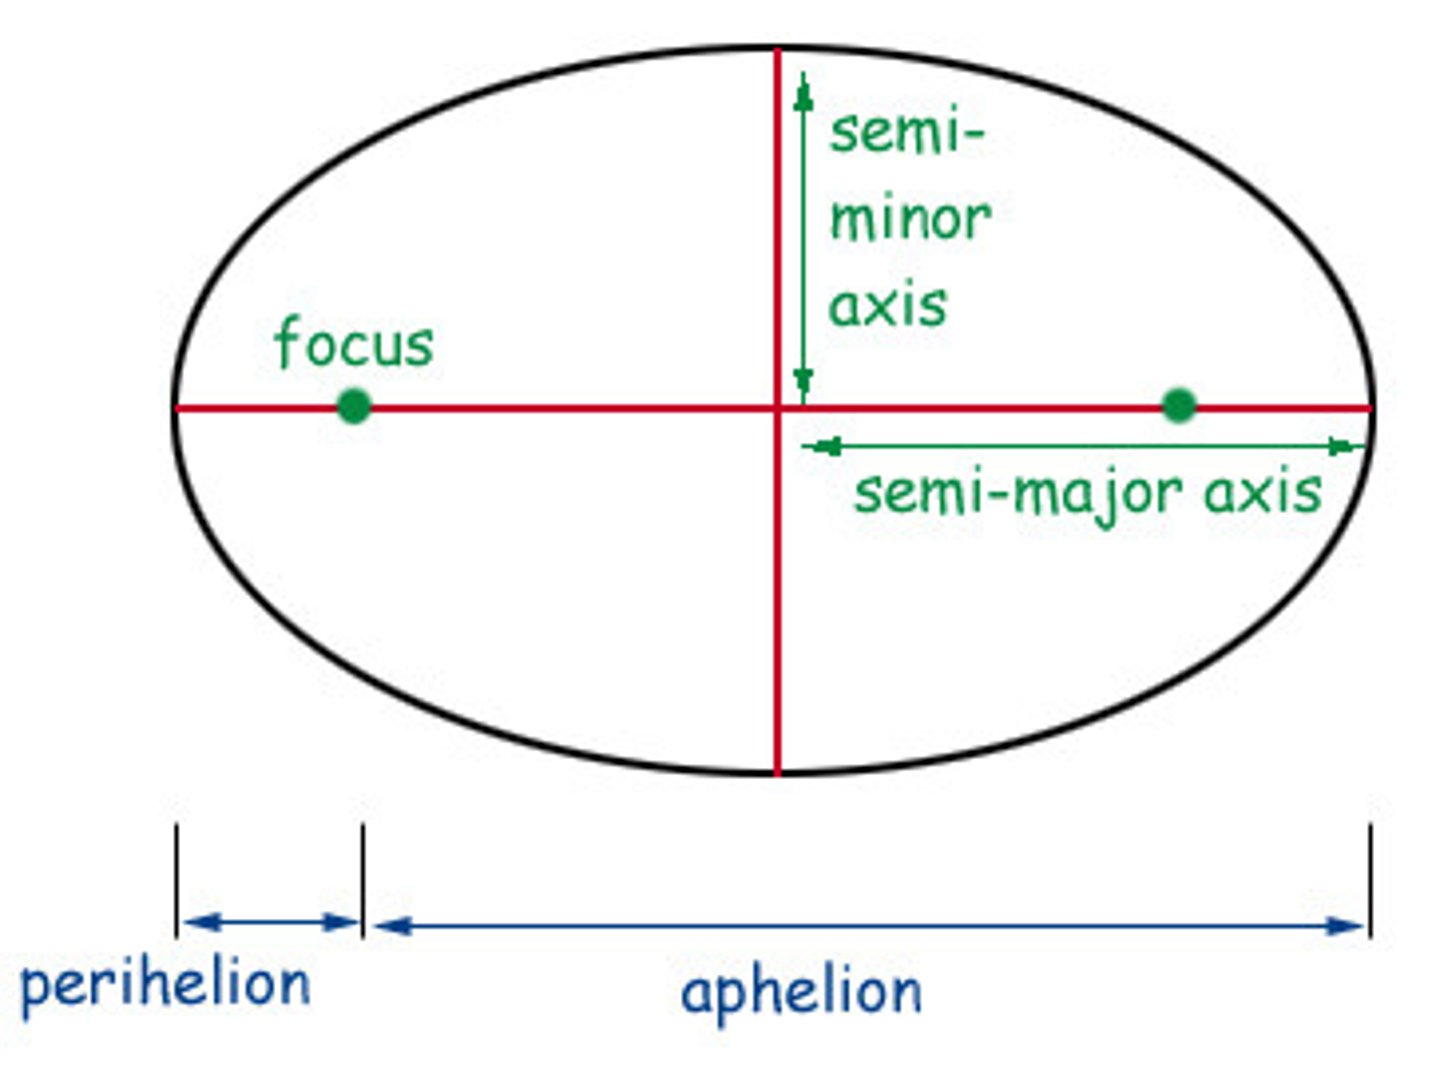
semi-major axis
half of the longest diameter of an ellipse
goes from east to west
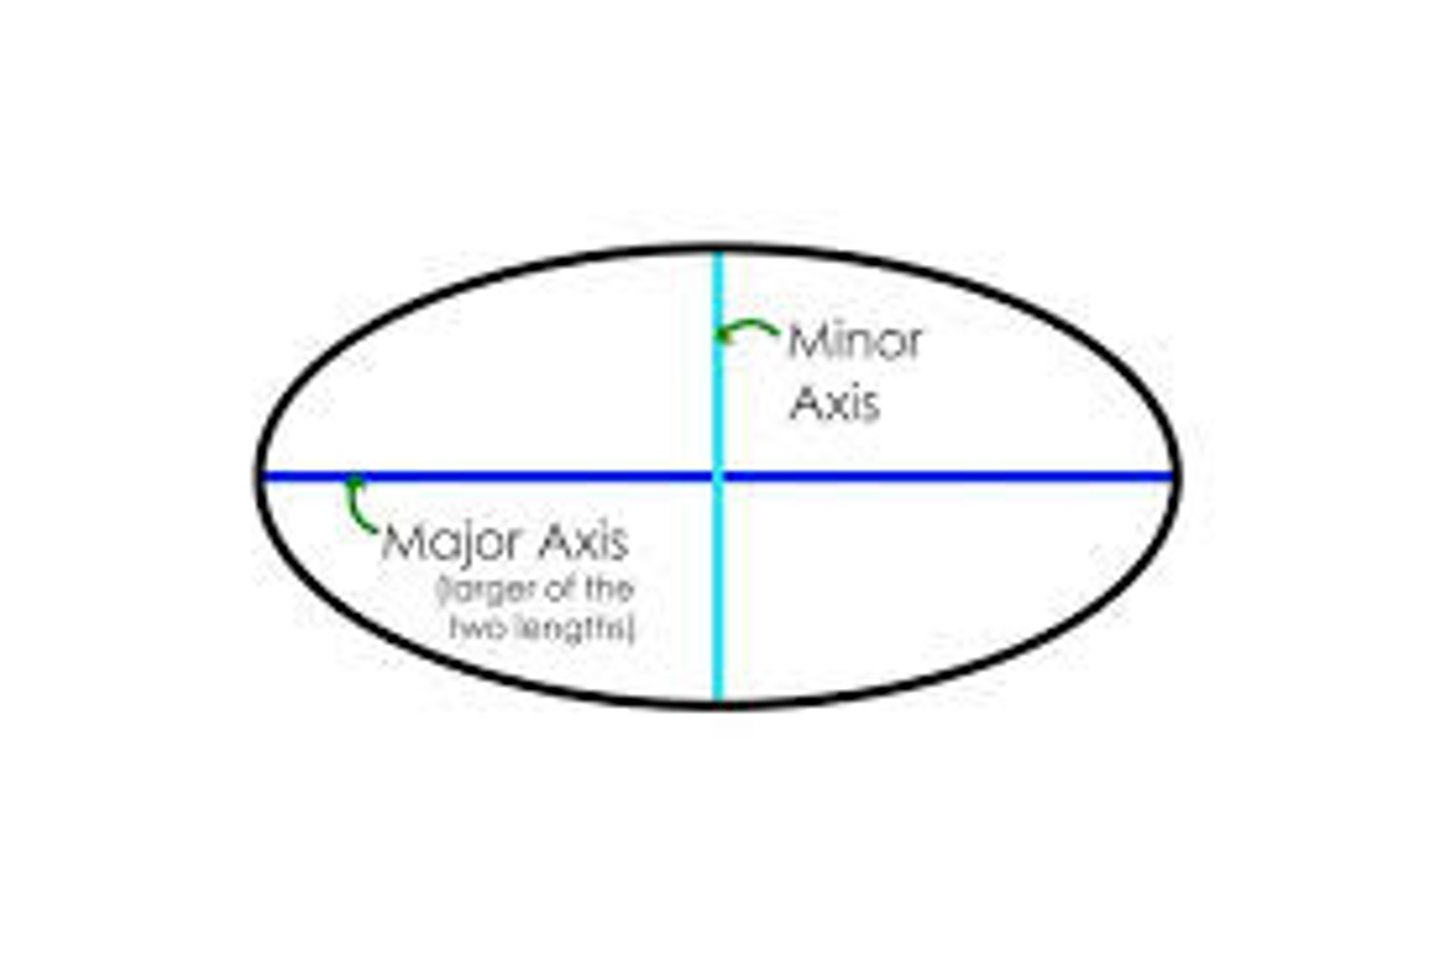
semi-minor axis
half of the short axis of an ellipse
goes from north to south
datum
defined by ellipsoid and set of points to anchor the Earth's surface to the model ellipsoid
defines the radius, inverse flattening, semi-major and semi-minor axes for an ellipsoid
flattening/inverse flattening
represents the top and bottom squishing of the Earth when projections are completed
(major - minor) / major
projection
making something spherical flat
will distort shape, area, direction, or distance
great circle distance
shortest distance between 2 points over the surface of a sphere
why plane flight paths look curved
conformal projections
preserve shape
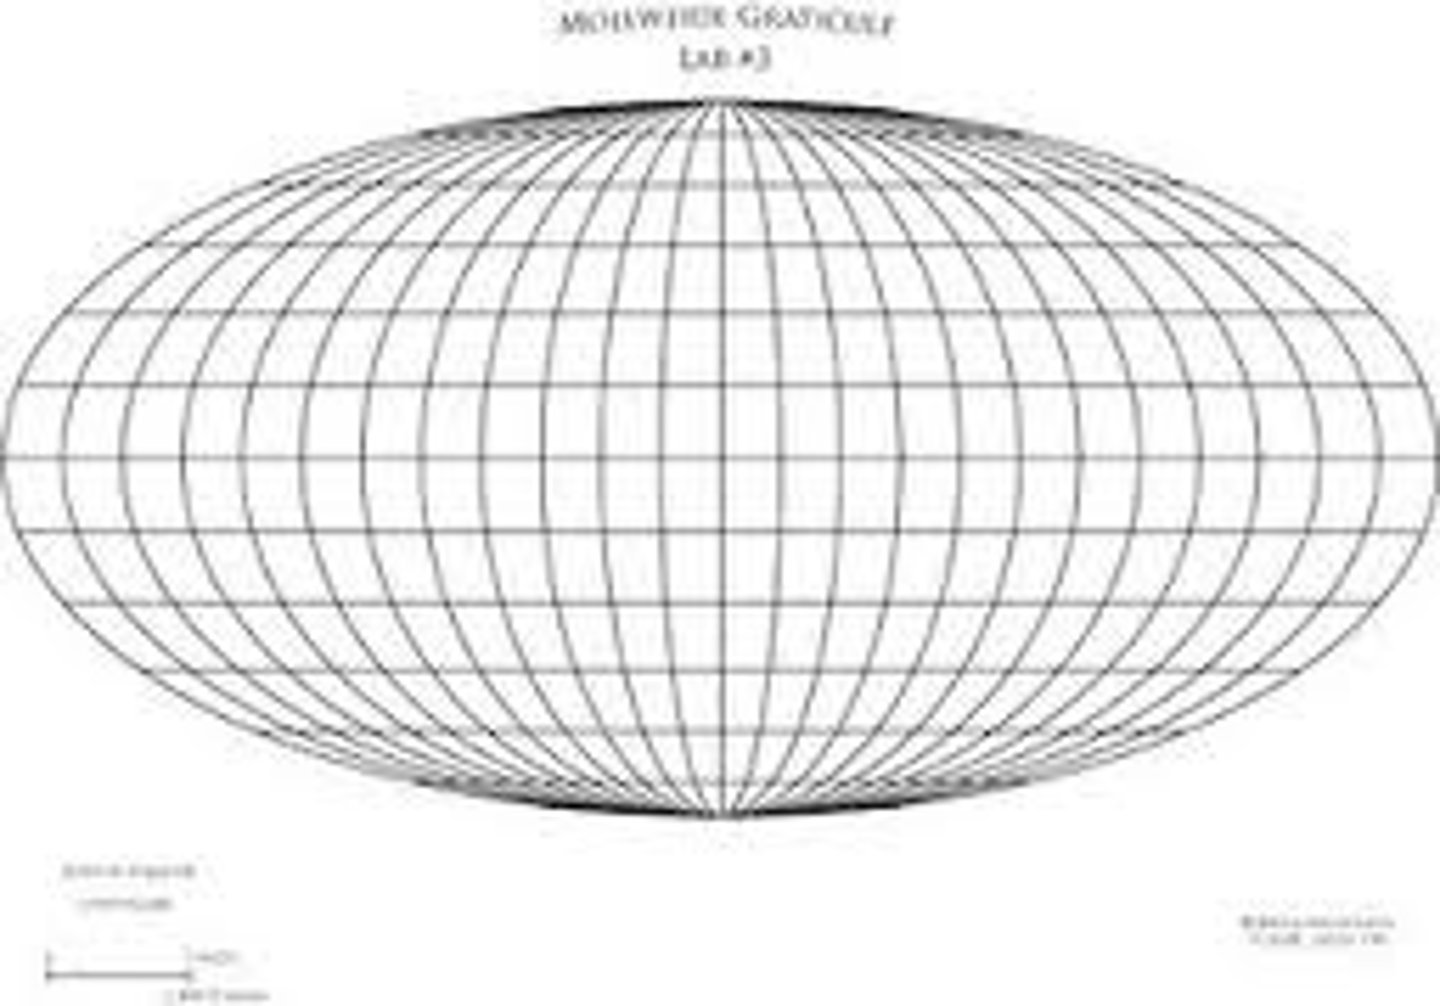
equivalent/equal-area projections
preserve area
equidistant projections
preserve distance
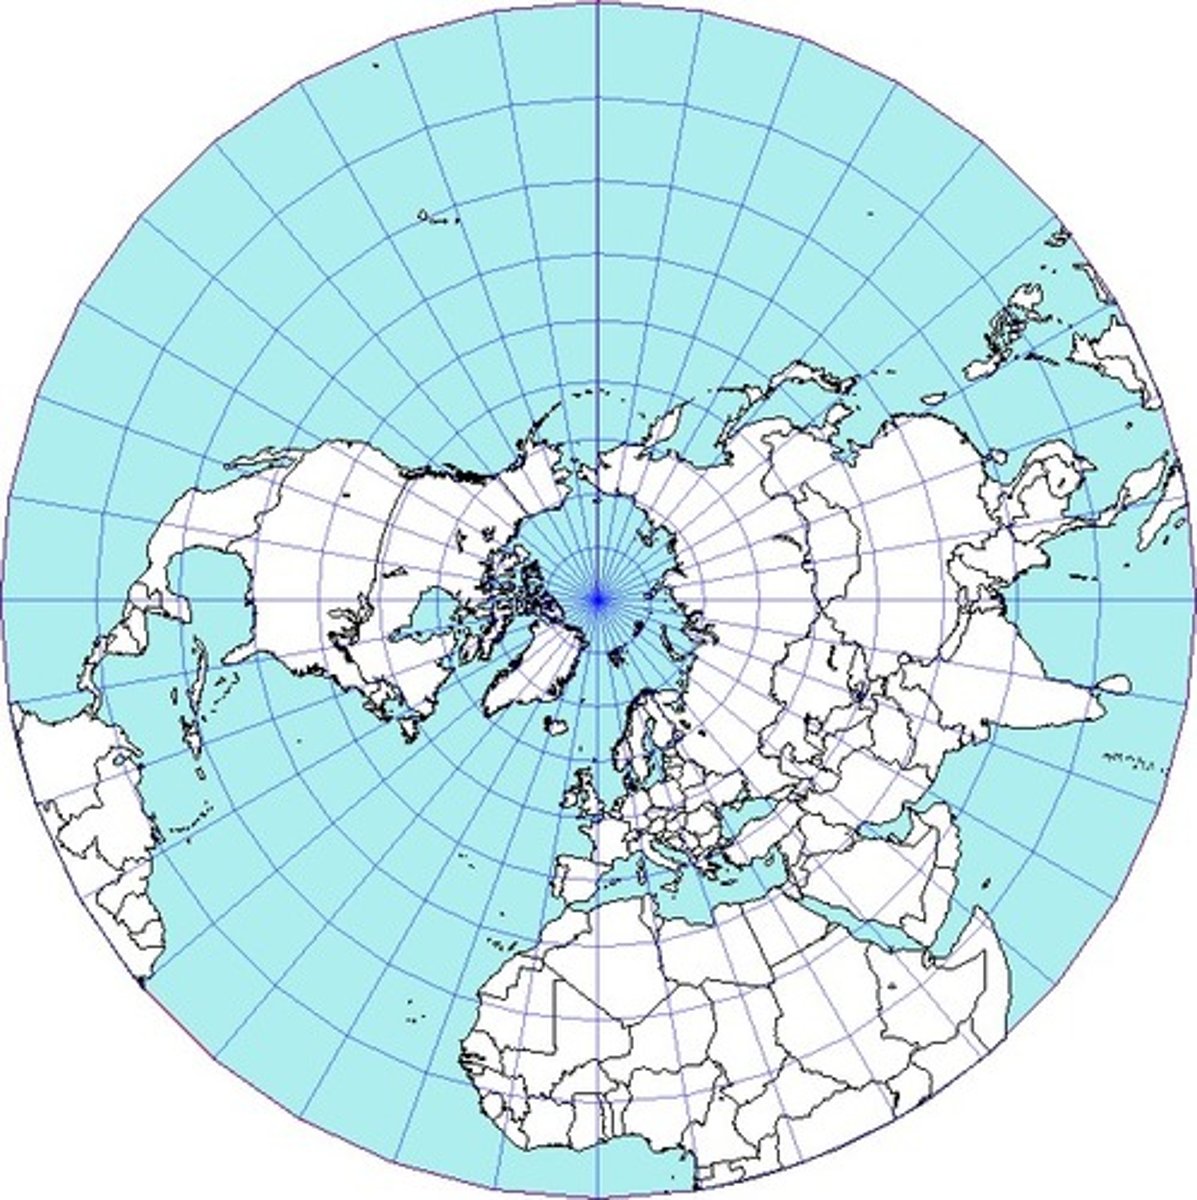
azimuthal projections
preserve direction
azimuths
lines of true direction
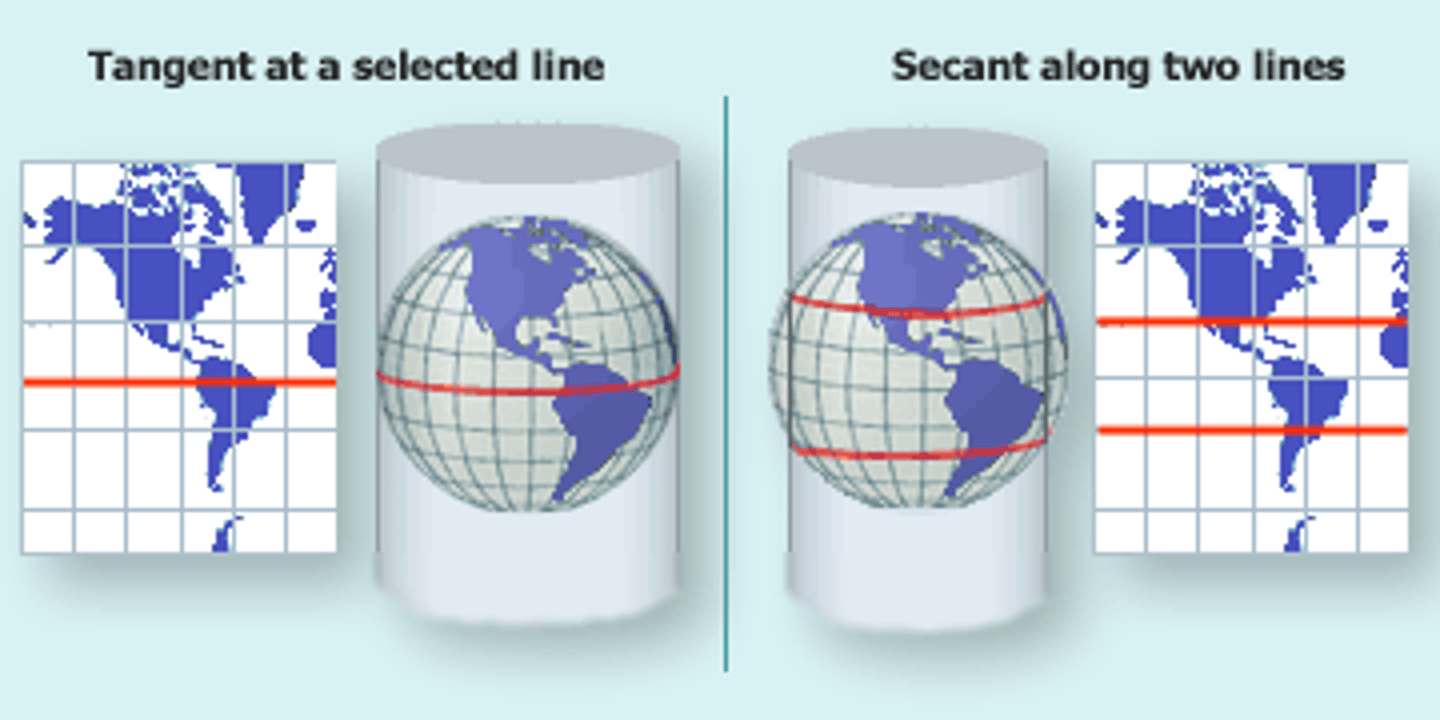
standard points and lines
points or lines of intersection between the developable surface and spheroid
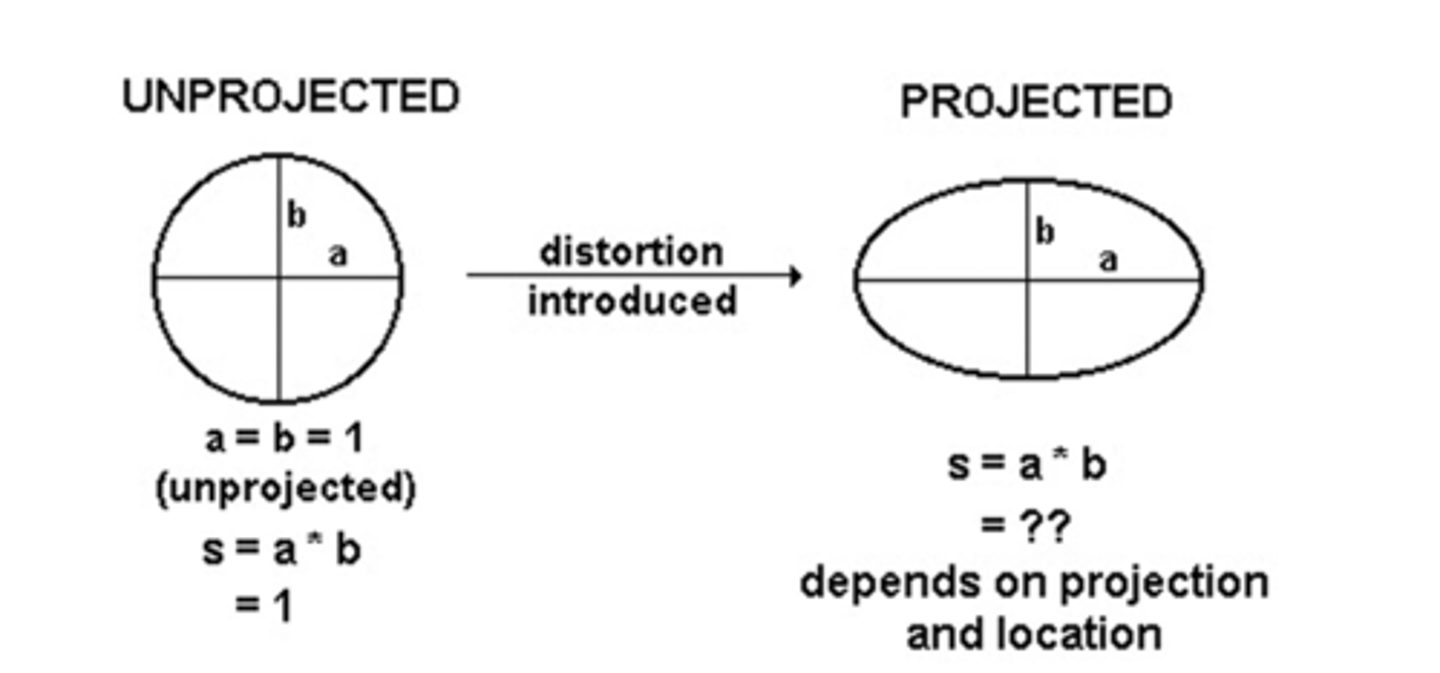
tissot's indicatrix
visualizes distortion in projected map, s = "area scale" = product of semi-axes of circle/ellipse on the projected surface
cartesian system
the system of x and y axes
attempting to keep it positive if at all possible
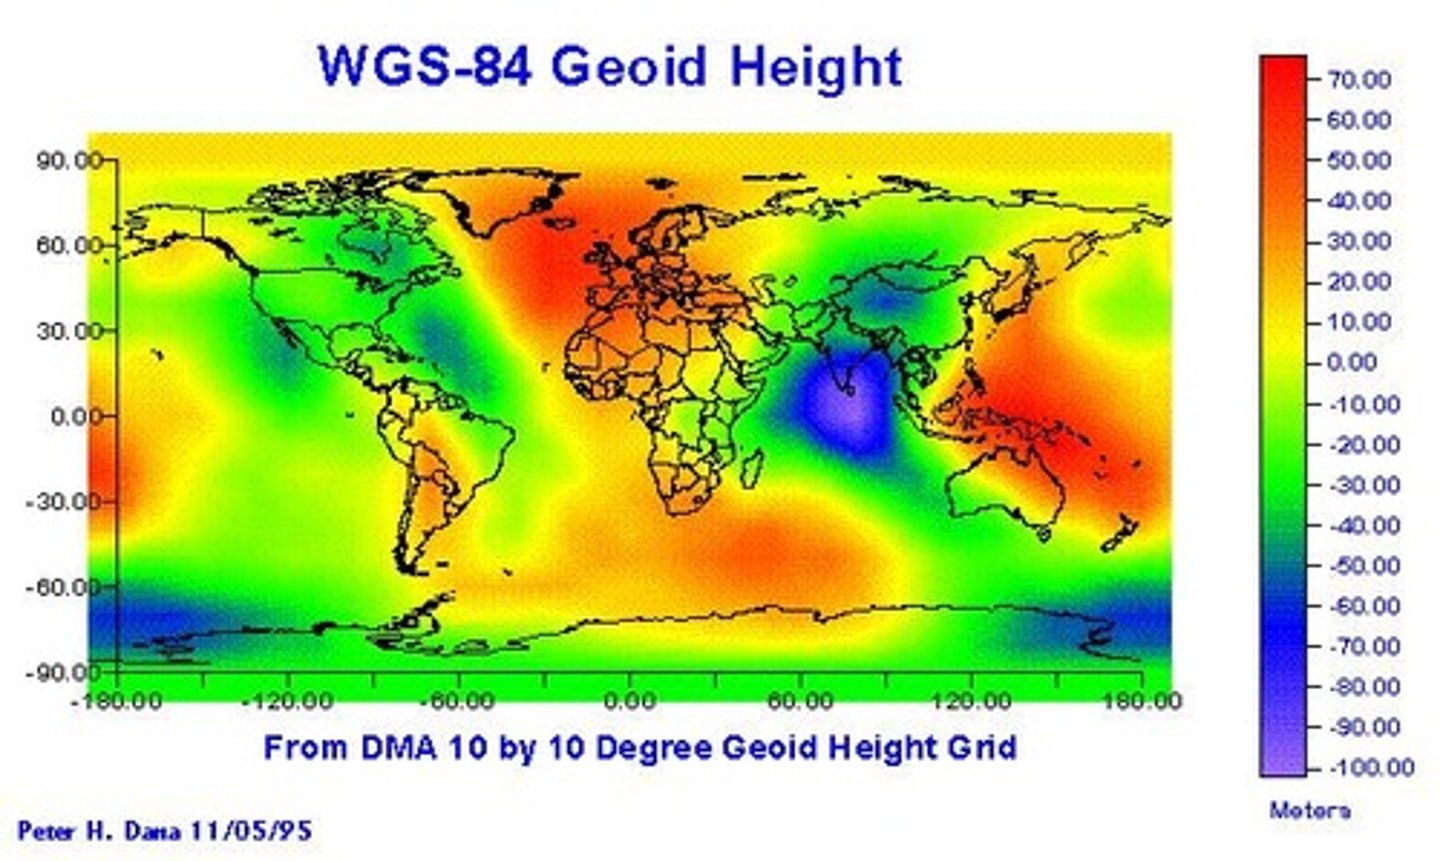
geoid
mean sea level that is used to measure precise surface elevations
coordinate system
system that uses numbers to uniquely determine a position
use cartesian, decimal degrees, or degrees/minutes/seconds
DMS to decimal degrees
add the degree + minutes/60 + seconds/3600
decimal degrees to DMS
name of the game is truncation
degree + remainder
remainder(60) to get the minutes, then remove the remainder there
final remainder times 60 again = add them all up together
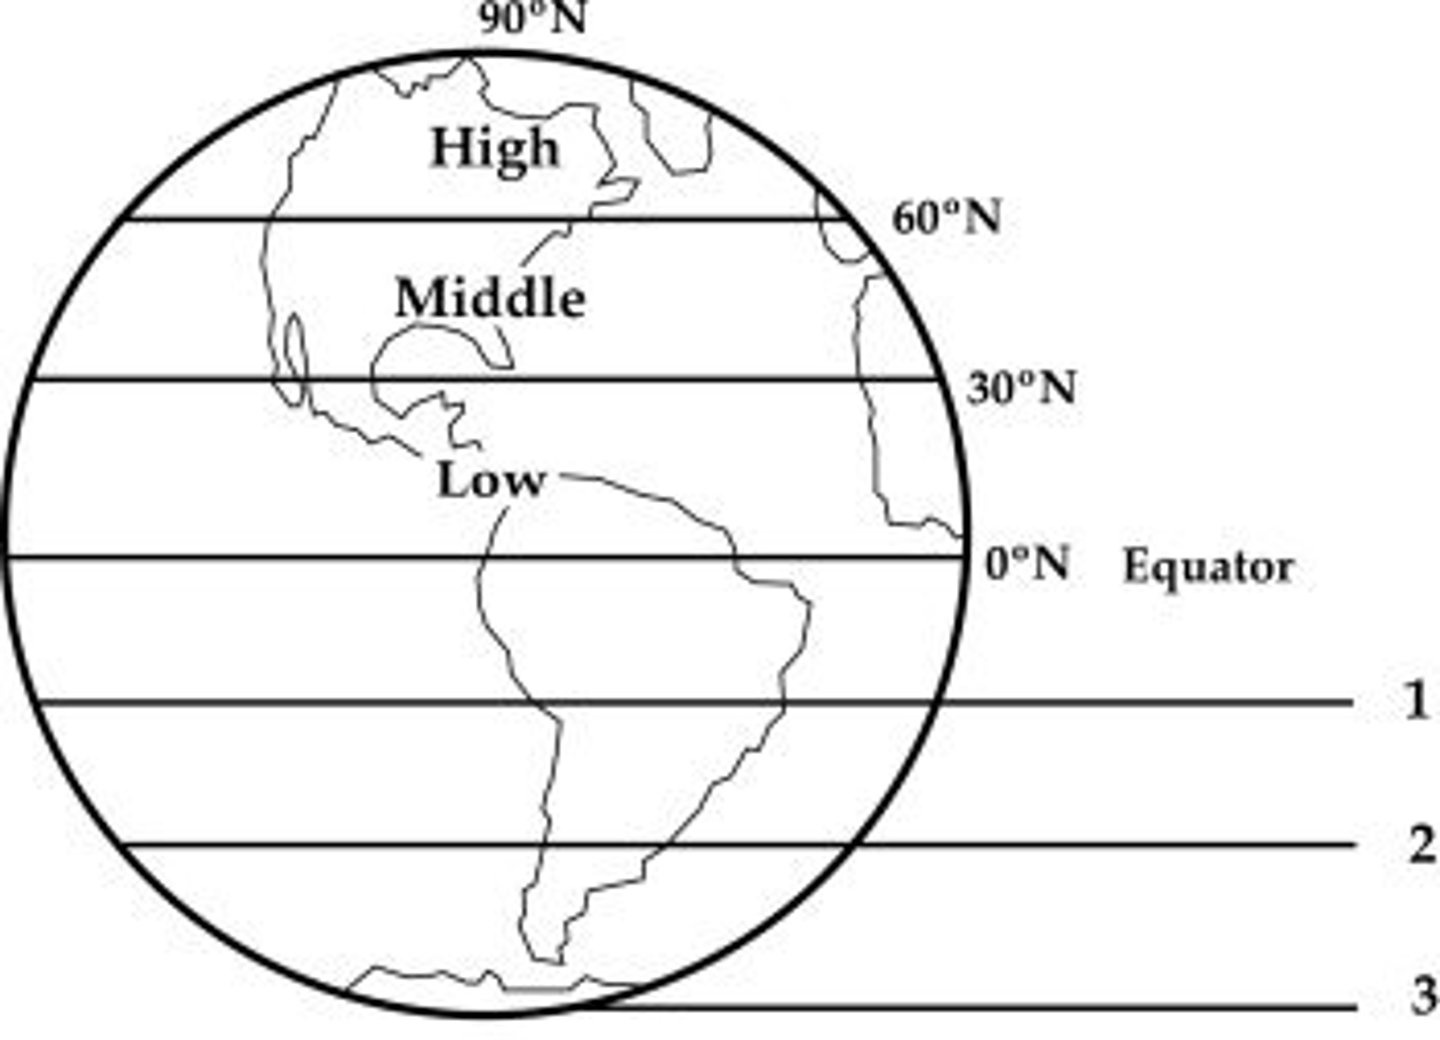
latitude
parallel
runs East to West, -90 to 90 degrees
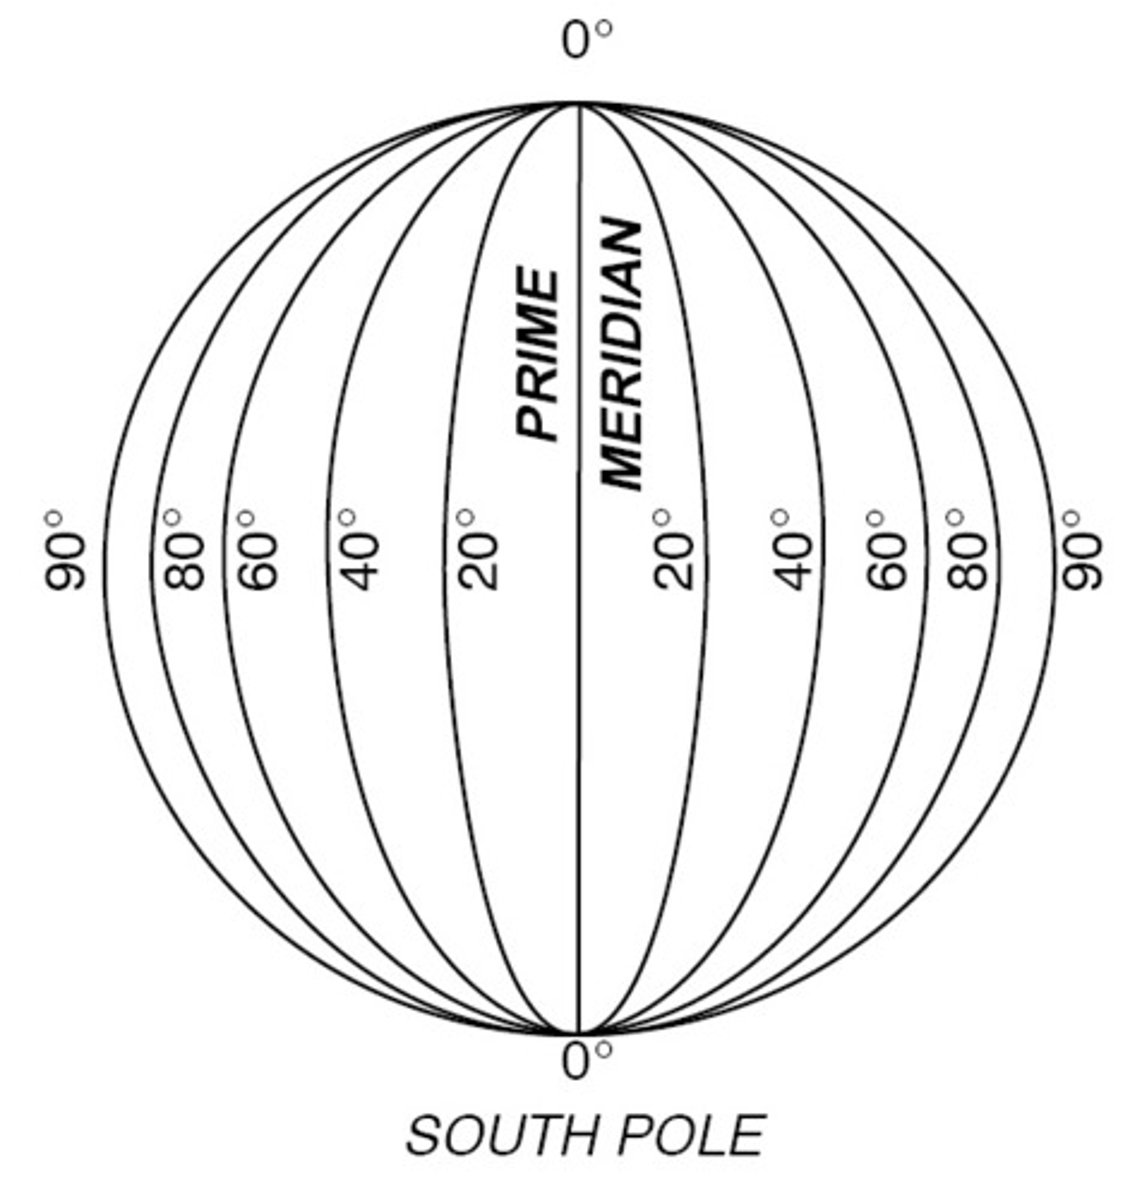
longitude
meridian
runs North to South, -180 to 180 degrees
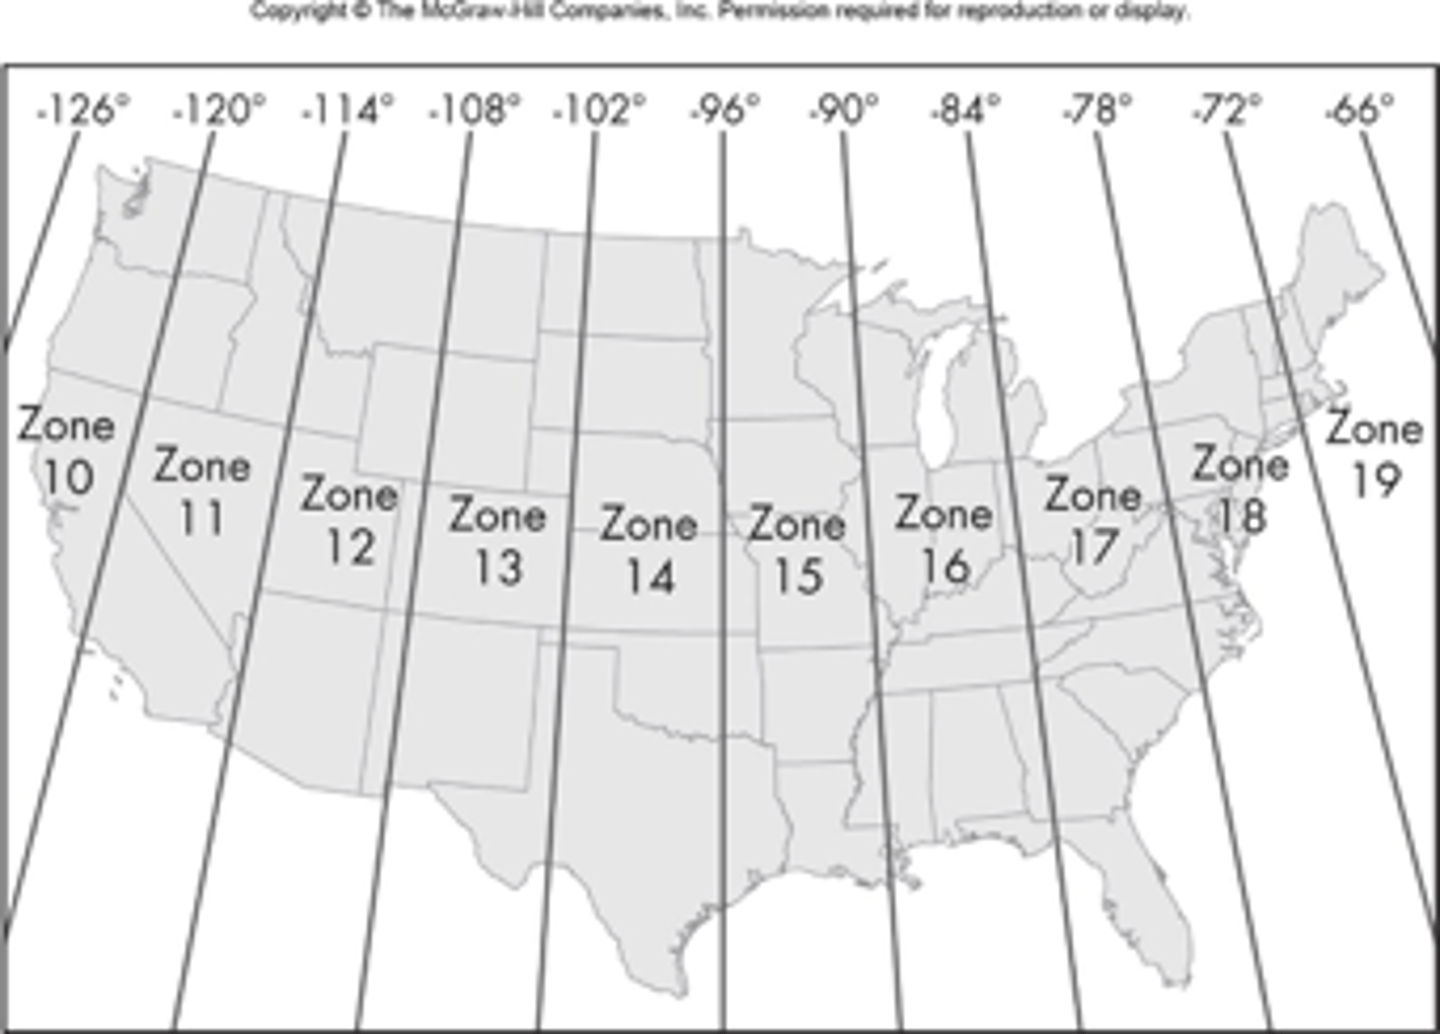
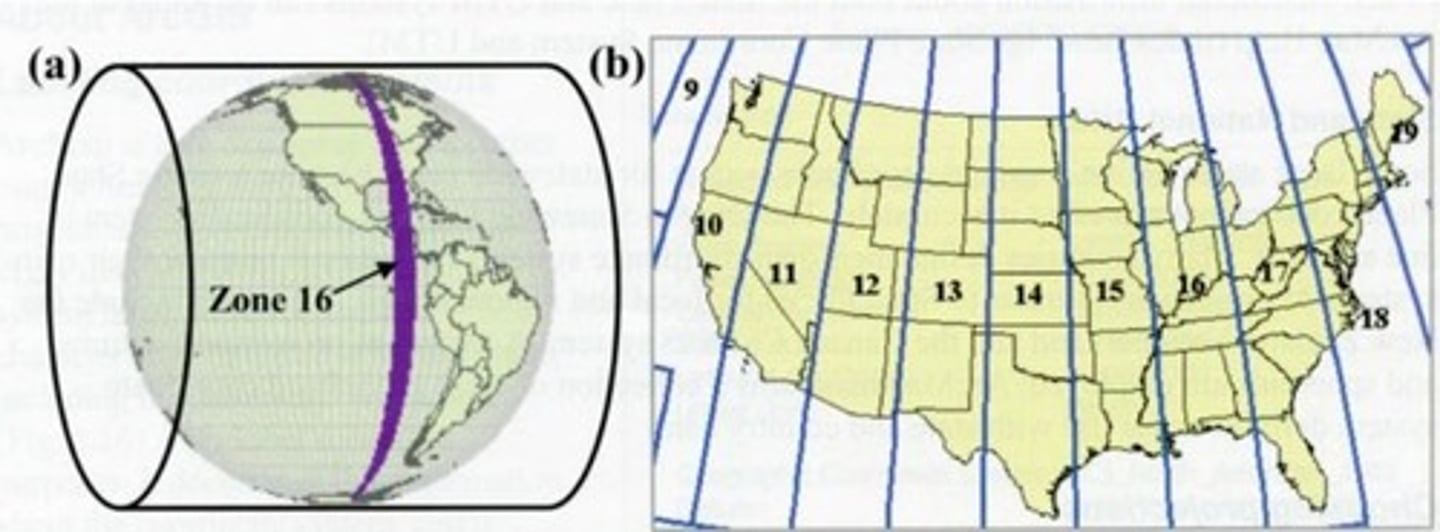
UTM
the Universal Transverse Mercator
cylindrical secant transverse mercator
60 zones, each 6° in length
the central meridian is assigned a value of 500,000 meters and equator has 10,000,000 (in each zone and overall)
KEEP IT POSITIVE
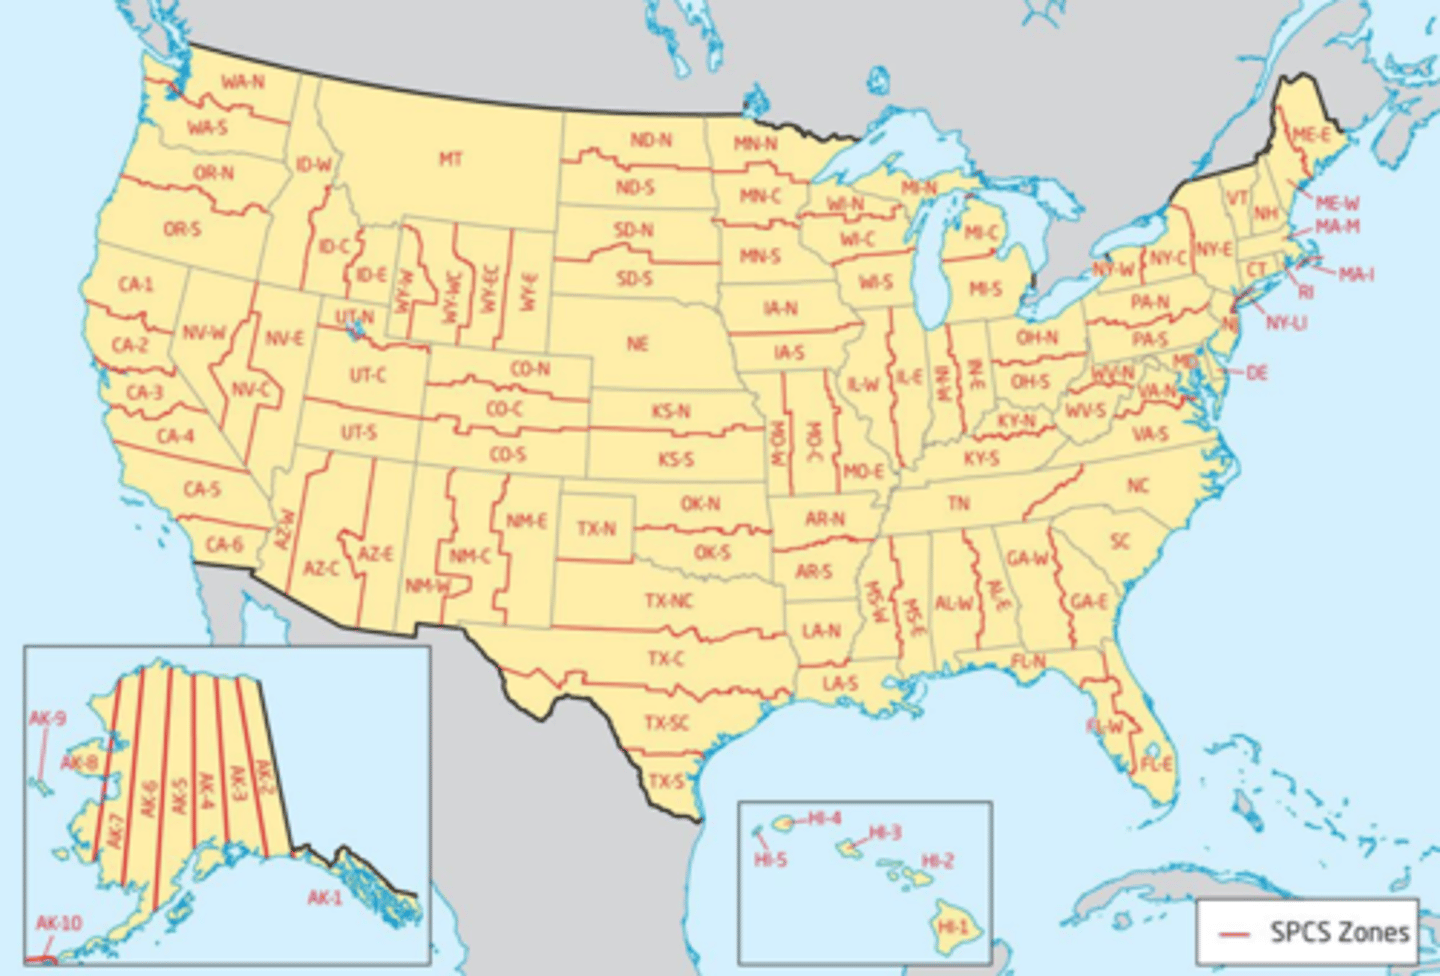
state plane coordinate system
uses state/county boundaries - changes depending on the region
uses transverse mercator in the long zones, lambert conformal conic in the wide zones, and oblique mercator in the panhandle of Alaska
uses SPCS 27 (US survey feet) and 83 (the main datum and is commonly measured in meters)
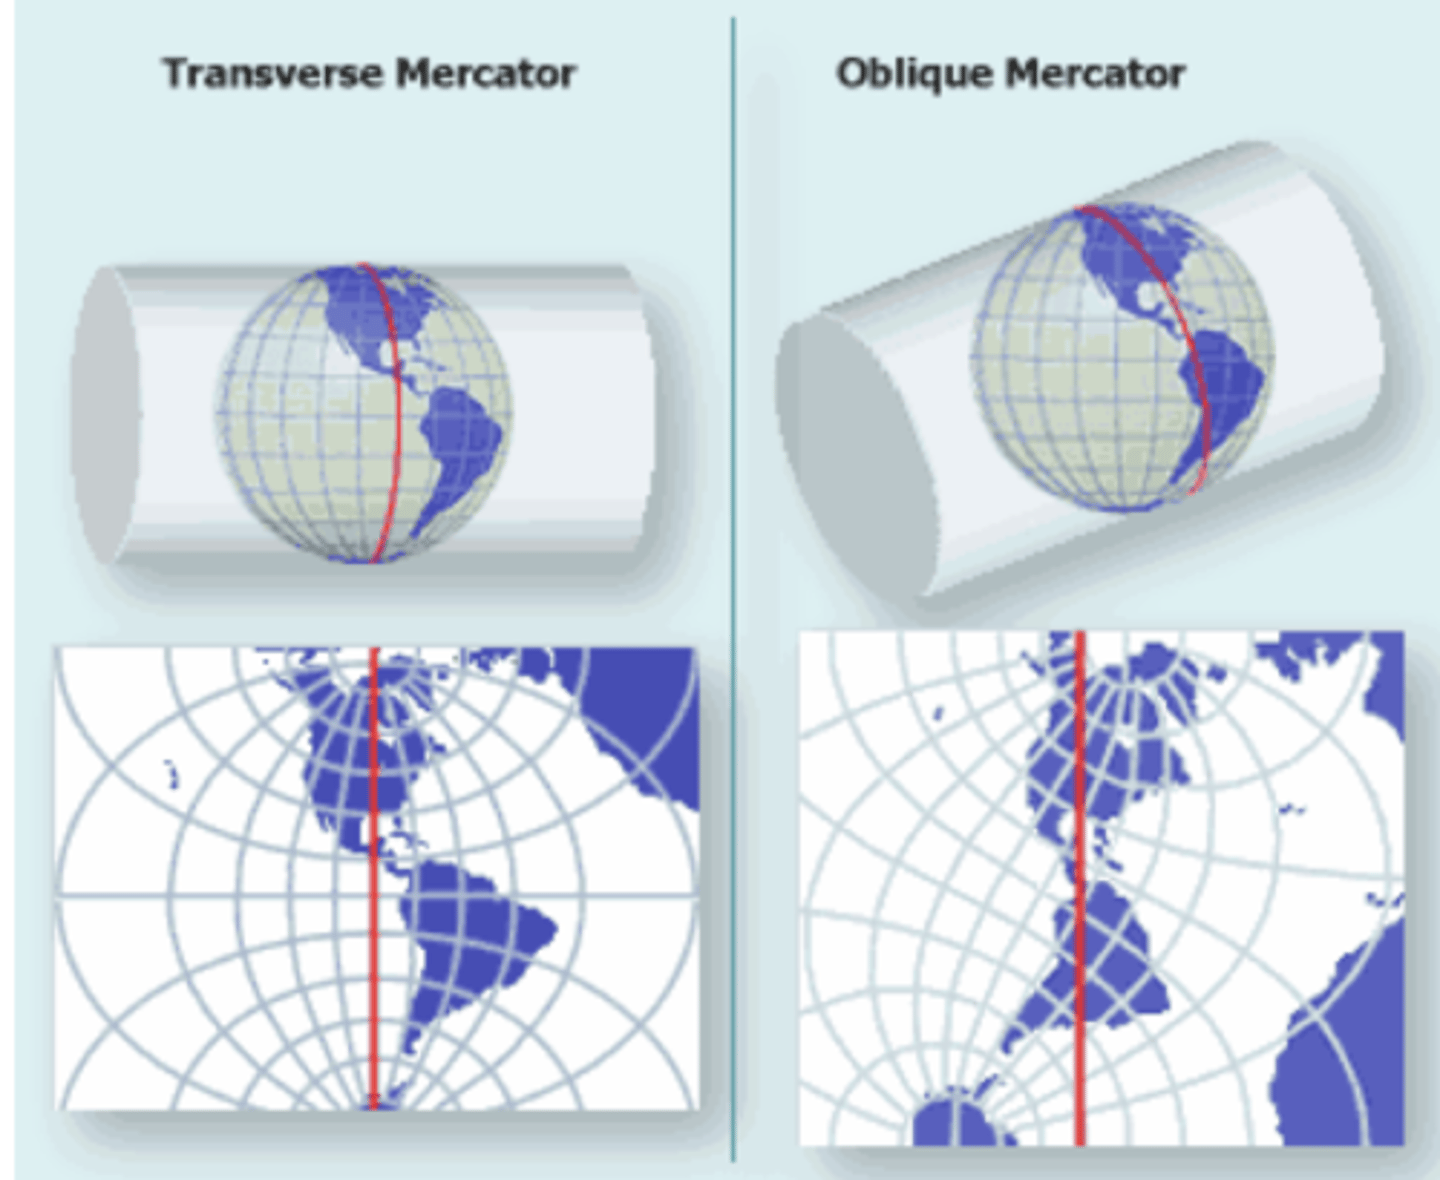
transverse mercator
cylinder is rotated 90° (East-West) and then the reg cylindrical projection is used
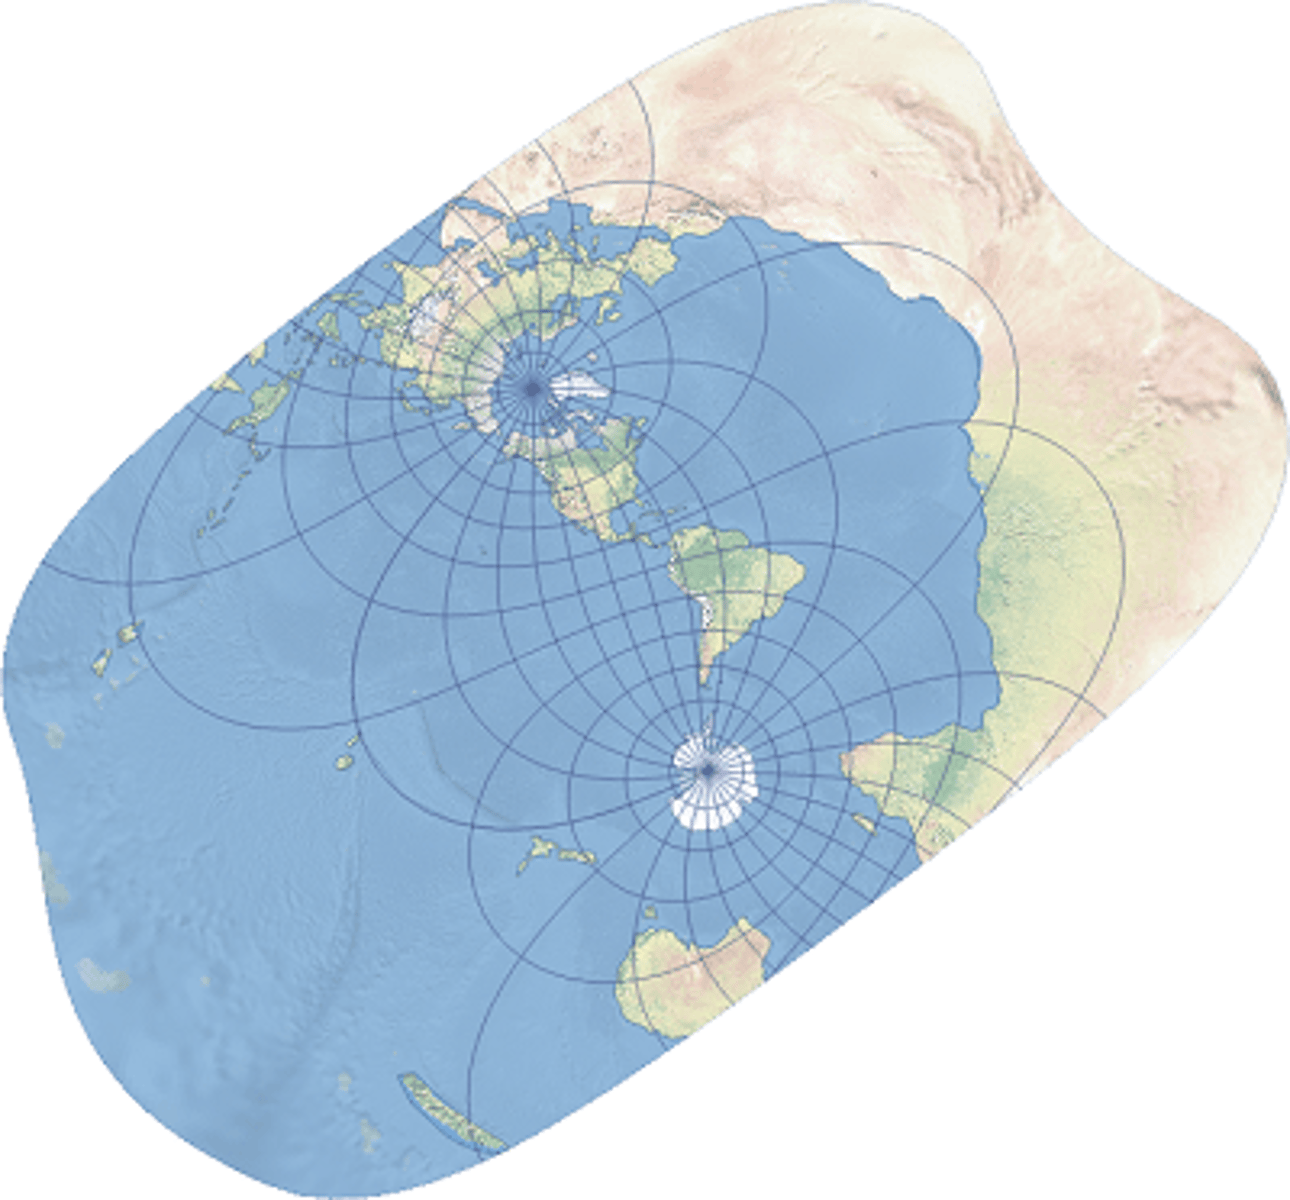
oblique mercator
tangent line at random line (all other orientations)
projection for the panhandle of Alaska because it lays at an angle
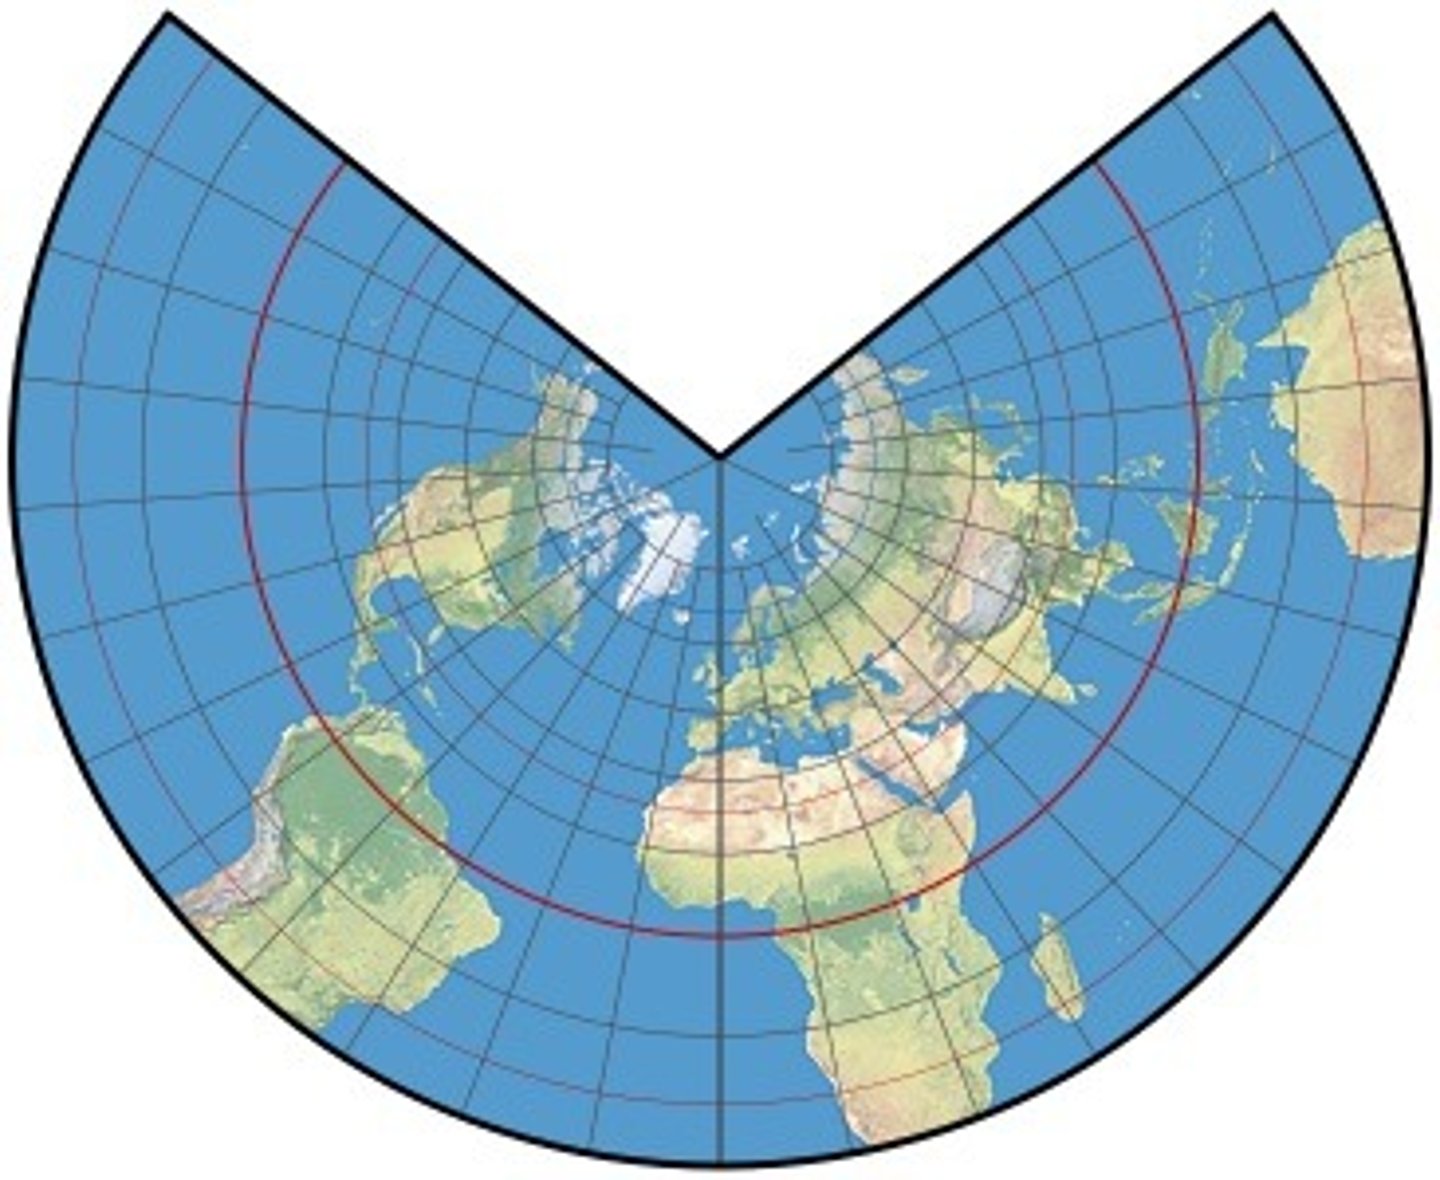
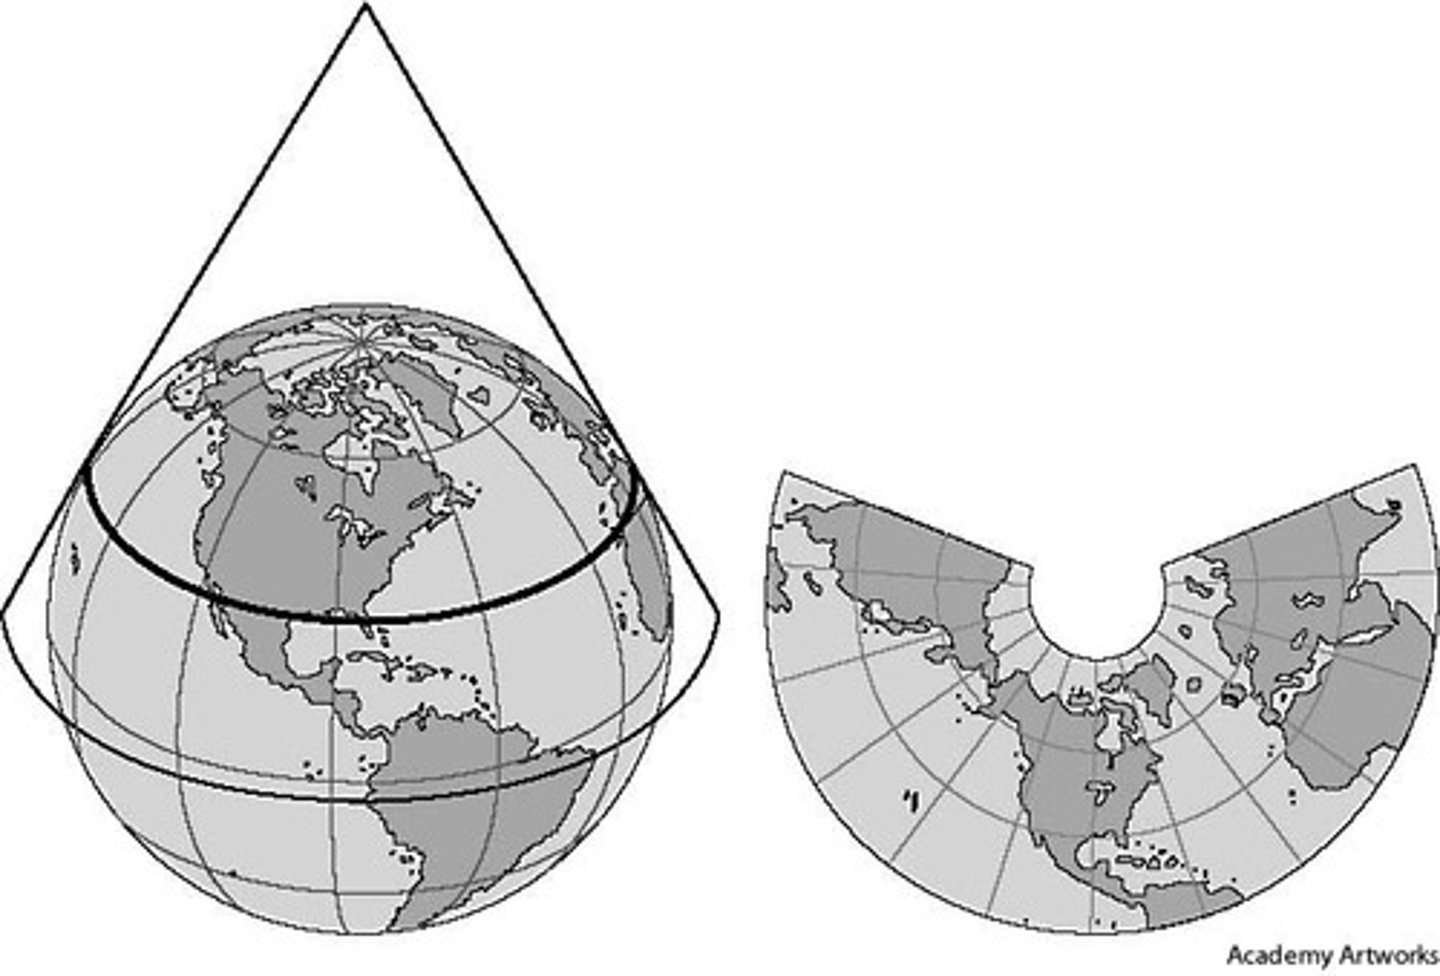
lambert conformal conic
cone intersecting the ellipsoid along 2 standard parallels (most distortion from North to South)
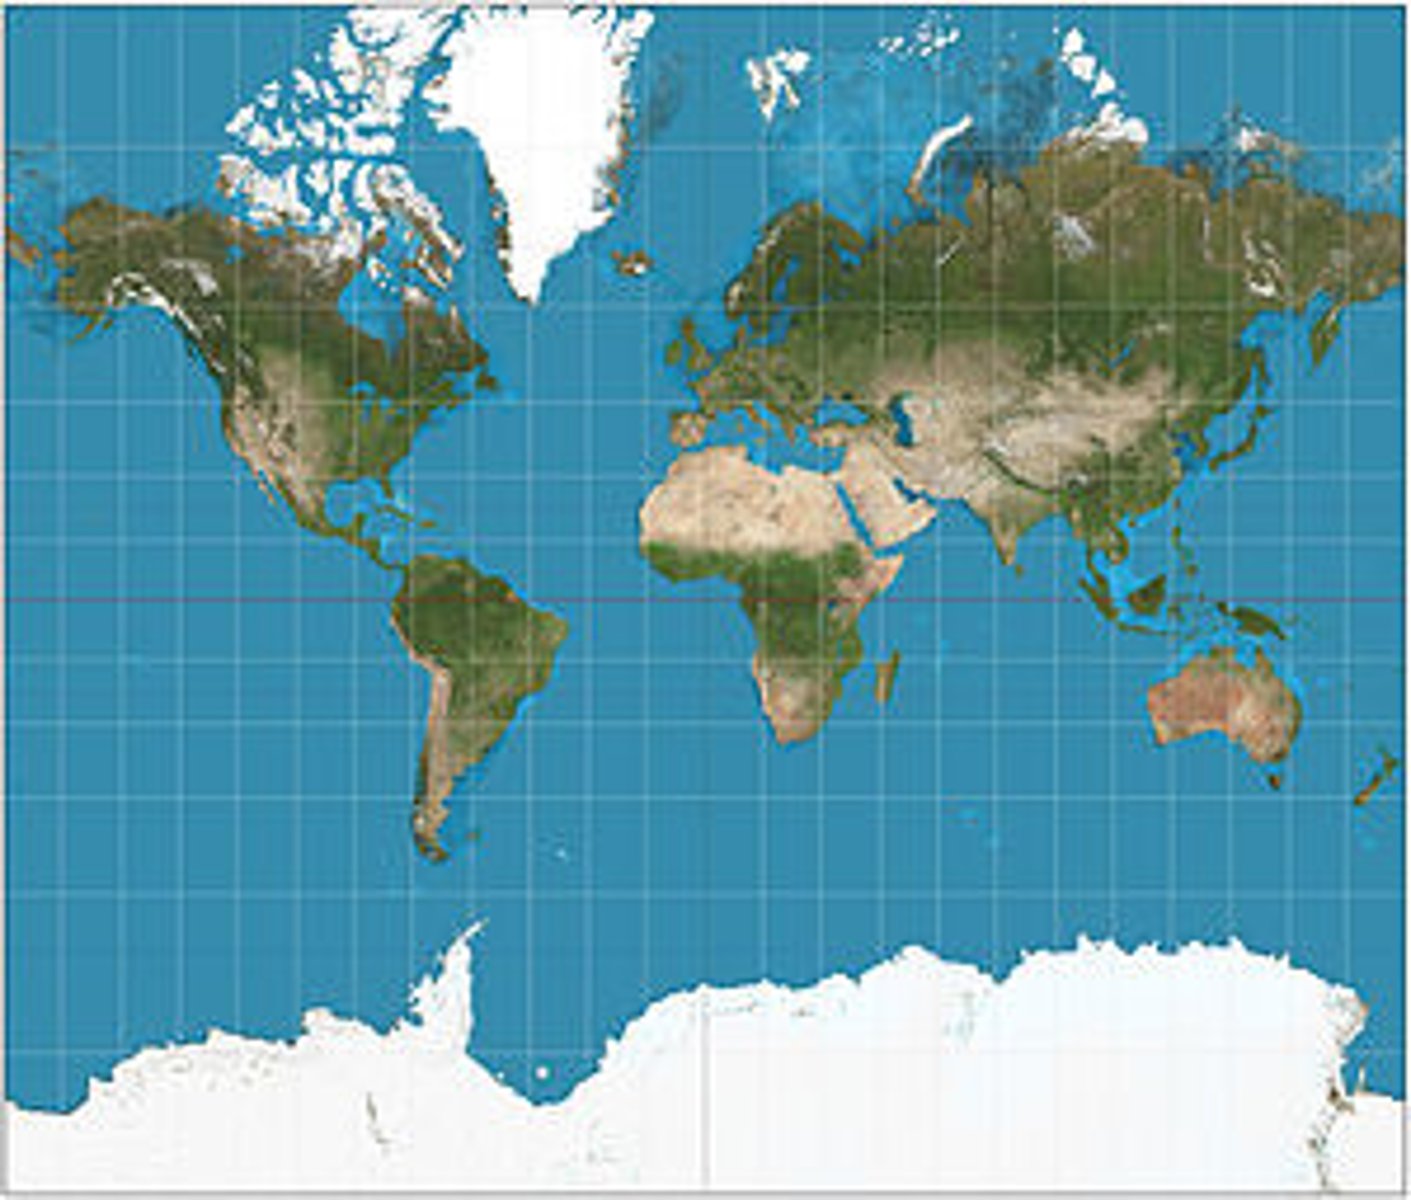
mercator
3857 (based on WGS 84) - represents the world as flat
in this one, greenland is the size of Africa (distorts size)
good for a small area that keeps the shape of the features, not good at scale
coordinates are in meters (HUGE numbers)
WGS 84
4326 - uses decimal degrees and data from a GPS
degrees between -180 and 180, lat/long
world as a rectangle (flat at the top)
best used for large scale / shape representation
not actually a projection
georectification
method used to assign a system of coordinates related to real world positions to an entire image
georeference
to take an image in a known coordinate system and provide the information necessary for software to understand that system
ground control points
physical points with a horizontal coordinate system and/or vertical datum
time-lapse images
valuable for natural resource and climate change research, urbanism and regional planning, local community engagement
SQL
structured query language used for managing databases
comp 110 part 2
attribute tables
columns = fields
rows = features
features can have text, #'s, date/time (if something has a leading zero, it's a string)
NC projection
2264 (for our area); STATEFP = 37
metadata
data that describes other data; iso2/iso3 are standardized country codes
topology
relationship between different features on a map, allows for spatial analysis
contiguity
polygons that share a boundary are adjacent
common file formats
vector: .shp, .geojson, .kml
raster: .tiff, .png, .img
height modernization
upgrading the heights given - recalibration
reference ellipsoid
mathematical model of the shape of the Earth with major axis along equatorial radius
conic projections
place a cone on the Earth and unwrap it
cylindrical projections
place a cylinder around a globe and unravel it
mercator is the best example
azimuthal projection
place a flat plane on top and watch how the light radiates
graticule
outlines of the continents and lines of lat/long
constant true direction
a straight line between 2 points will give the same direction as a compass would in real life
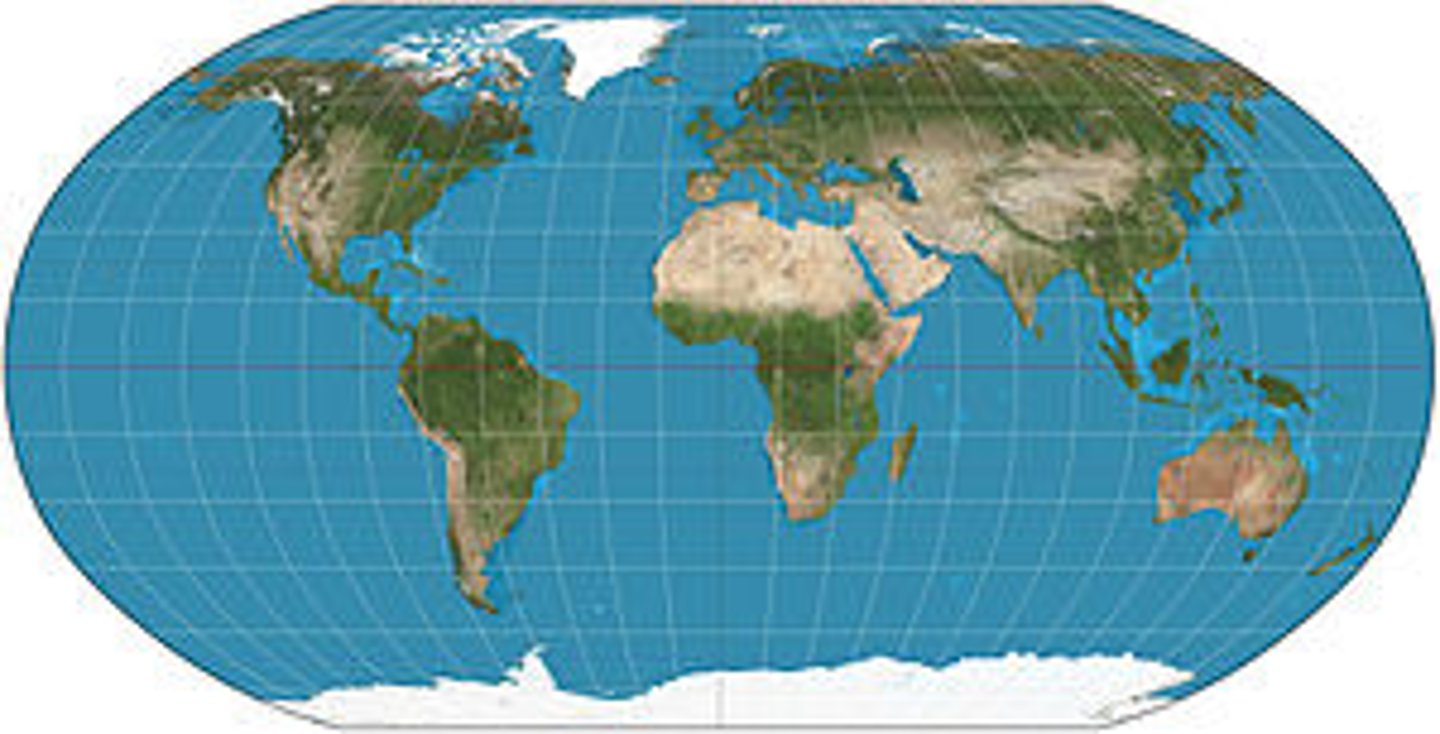
winkel-tripel
a projection that compromises discrepancy in distance, area, direction
hotine oblique mercator
lies at an angle diagonally (the cylinder)
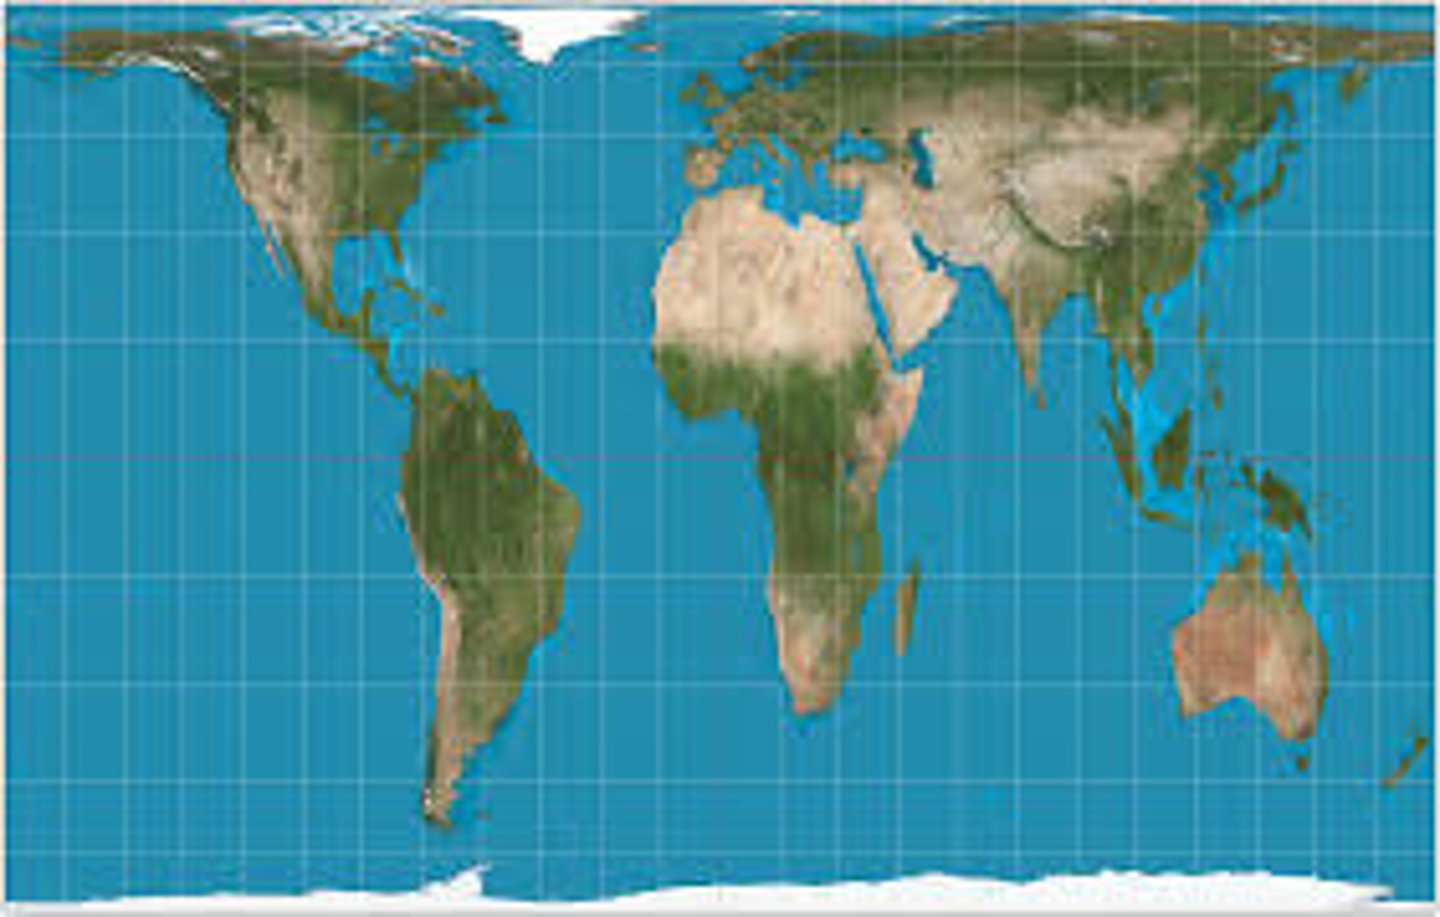
gall-peters
size is preserved, country shape is funny
affline transformation
preserves straight lines in 2D space by scaling, rotating, translating and skewing the image
rubbersheeting
more flexibility by bending/warping images with a 3rd order polynomial
RMSE
root mean square error
lower means a better georeferenced image
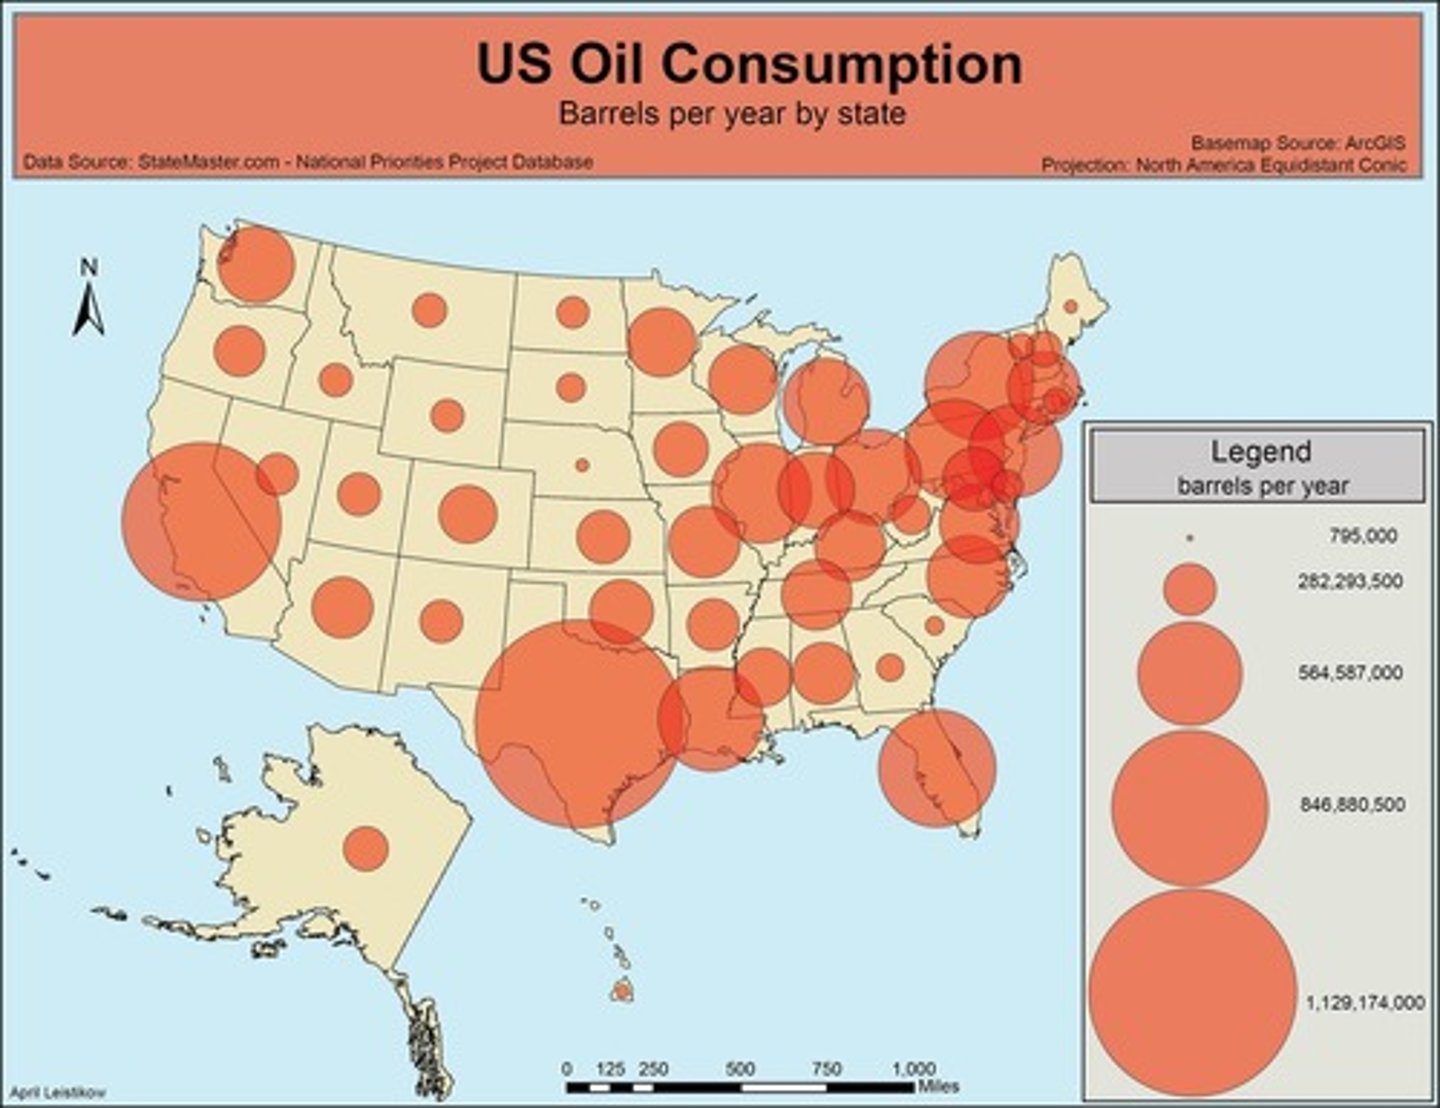
proportional symbol map
map that uses the size of symbols to represent a variable
query
selecting features via characteristics within their attributes
normalize data
a process to make the data values relative to the main data values, aka make them mean something
attribute/total = percentage
attribute/universe = percentage of universe with those attributes
attribute/attribute = relational percentage
universe
value or population that forms the base from which the data item in question is a subset
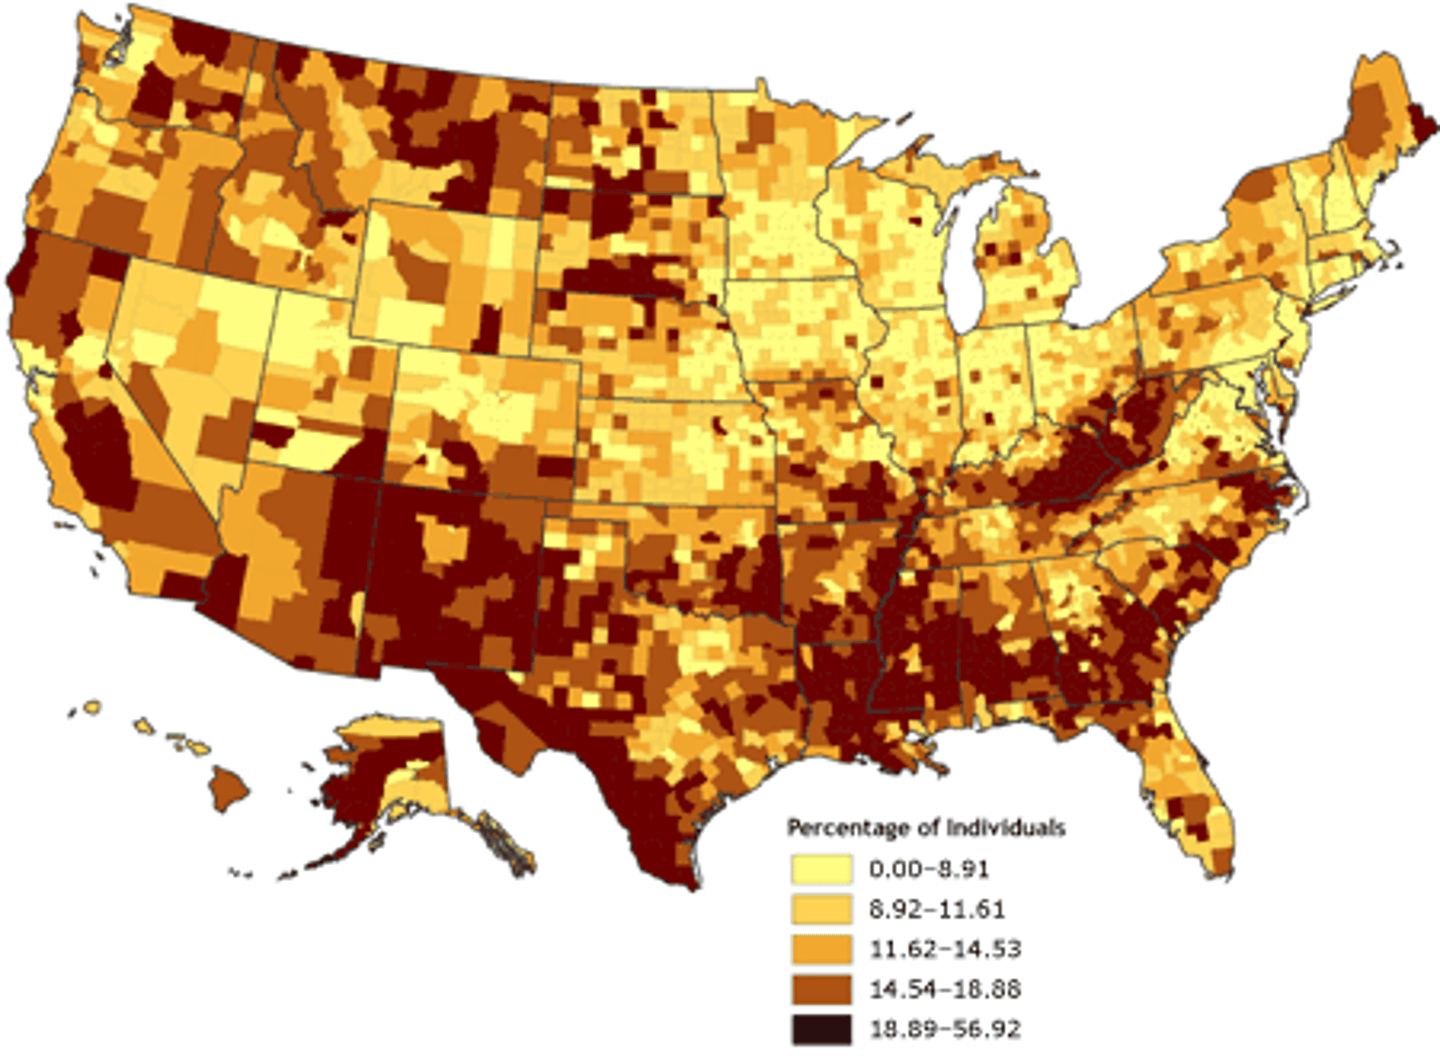
chloropleth map
thematic maps shaded with graduated colors to represent some statistical variable of interest
equal interval
range into equally sized classes
best used for continuous datasets
some datasets might only have data for a small number of categories
quantile
equal # of observations in each class, best for data that is evenly distributed
easily shows relative positions, but doesn't represent well the variety of values in each bin
natural breaks/jenks
uses an algorithm to group values into distinct break points
best used for uneven but not skewed data
bins can be widely different in size, hard to compare maps because breakpoints are so dataset specific
pretty breaks
separating the data where it breaks nicely and assigning the colors from there
modifiable areal unit problem
statistical biasing when samples in a given area are used to represent information
boolean operators
AND, OR, and NOT used in search strings to refine the scope of the search
also XOR (exclusive or)
GPS systems by country
US: Navstar GPS (31 satellites)
Russia: GLONASS (22 satellites)
Chinese: BeiDou-2 (35 satellites)
European: Galileo (21 satellites)
sphere
most simple model for the earth with one parameter (radius)
horizontal datum
unique geographic coordinate system created by examining a model ellipsoid and its related parameters
vertical datum
a baseline used as a starting point in measuring elevation values (which are either above or below this value)
nearest neighbor sampling
this method simply selects the value of the existing pixel that is closest to the desired location
binomial sampling
each cell has a random probability of being assigned 'success' or 'failure' to be included in the raster image
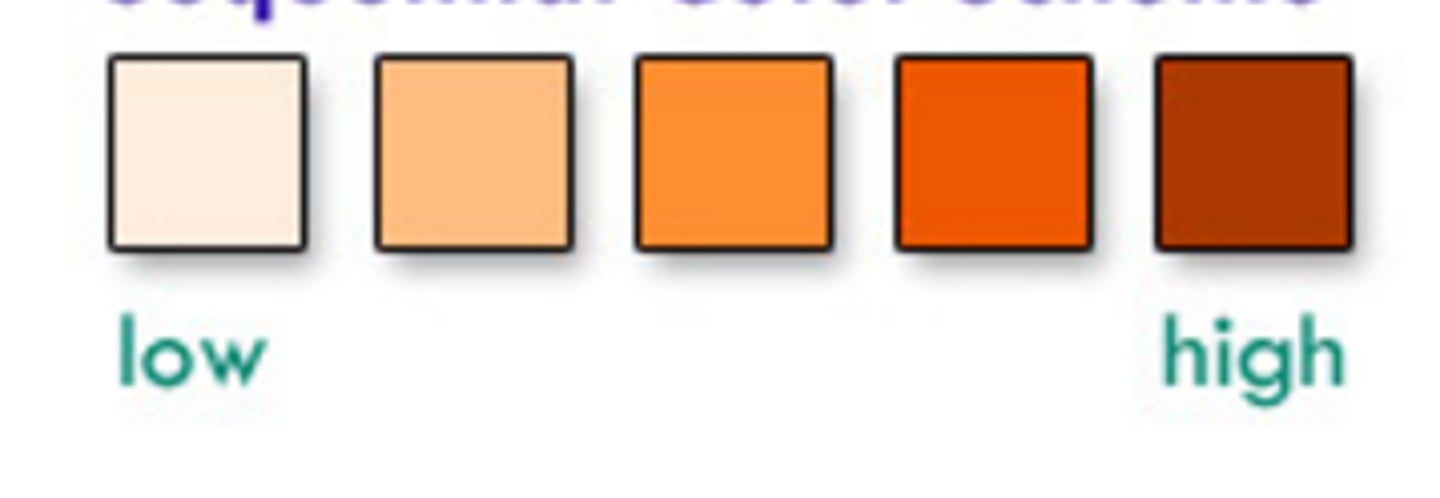
sequential color scheme
the gradient of saturation or luminance of a hue represents the outcomes of an ordered variable
lightest hue is the lowest value, darkest hue is the highest
diverging color scheme
highlights an important midrange or critical value of ordered data

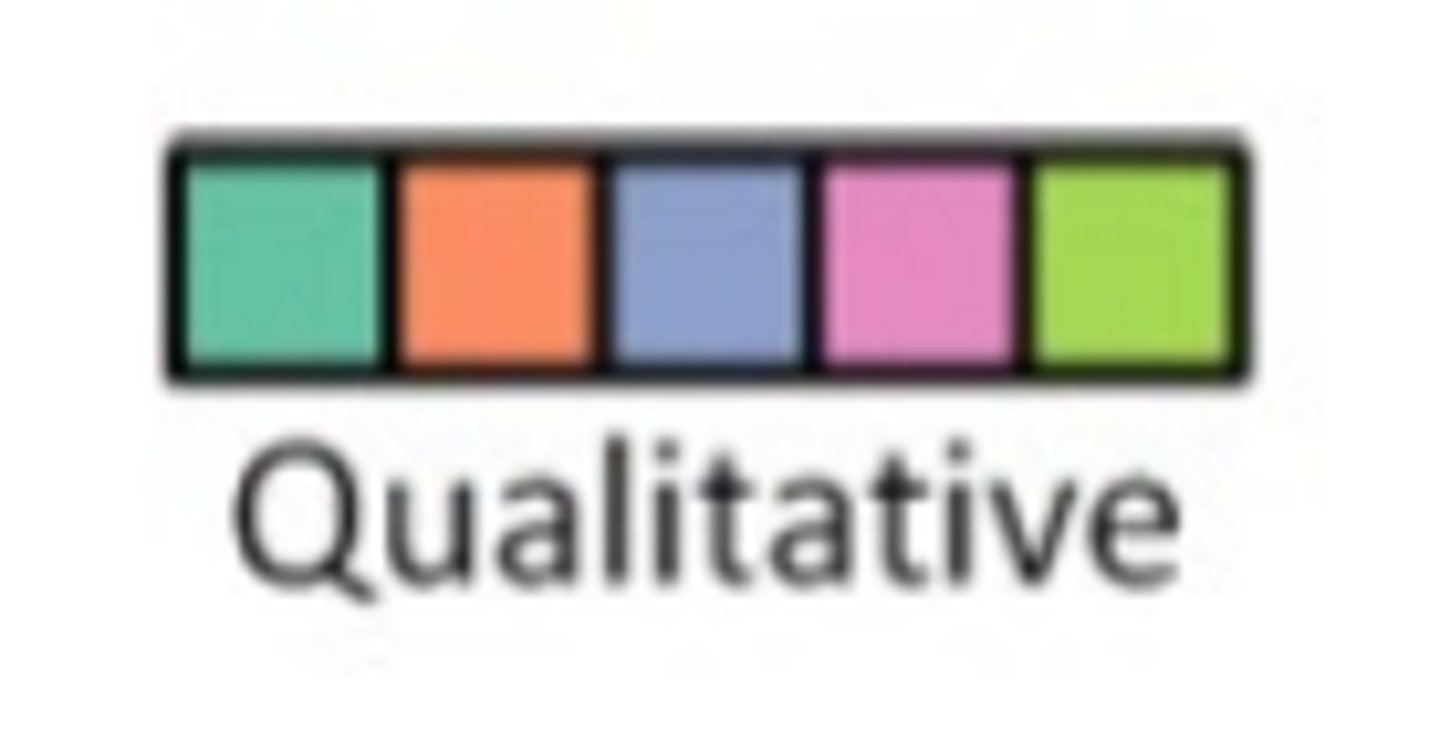
qualitative color scheme
presents categorical data; different hues visually separate each of the classes
intersection
the point where two layers overlap/meet
output layer has characteristics of the overlay and attributes from both input and overlay
clip
same method as intersection visually
all attributes from the kept piece of the input layer are conserved
* clip layer attributes are not conserved
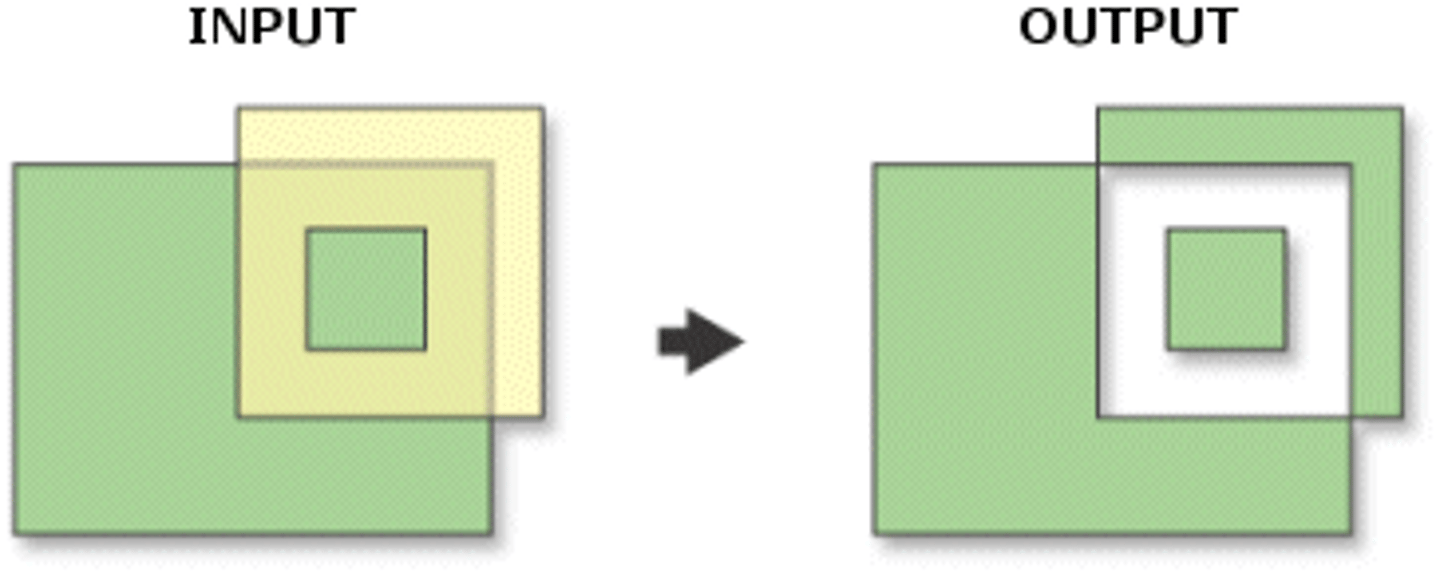
difference
creates a new layer based on where the input and overlay layers do not overlap
symmetrical difference
a type of GIS overlay that retains all features from both layers except for the features that they have in common
union
uses the OR boolean operator
can only be used with 2 polygons
preserves all features from both
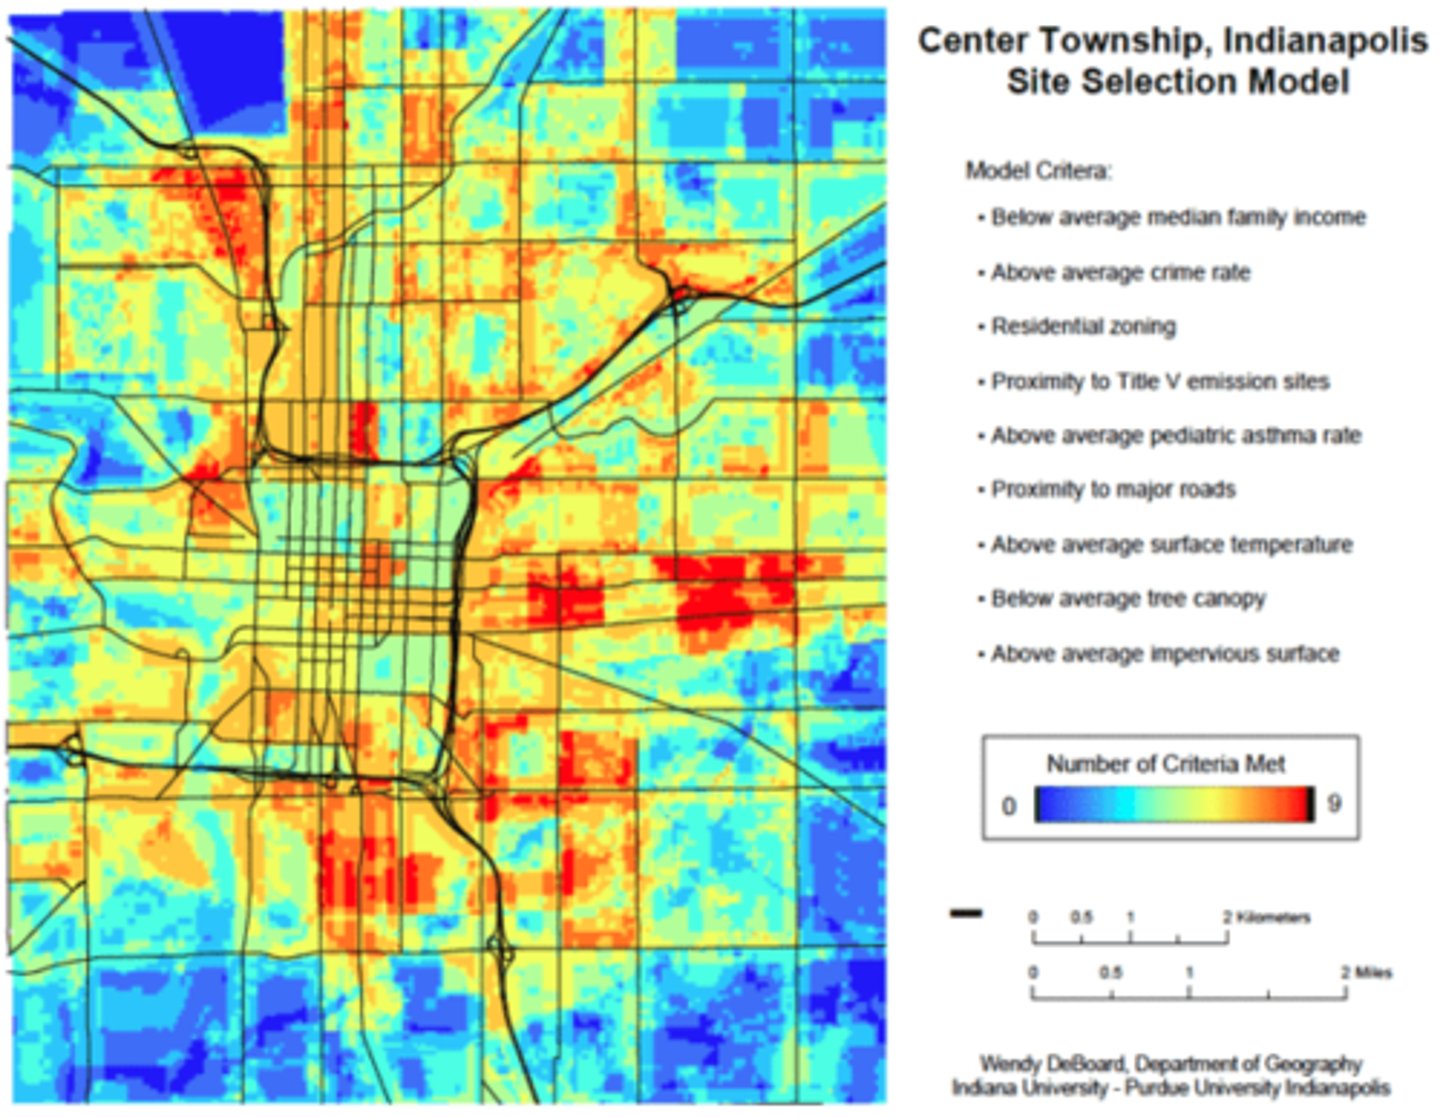
suitability analysis
evaluating a landscape to find which areas best serve a given purpose based on a set of factors
can use as many variables as you want!
best done in GEE (is most helpful for visualizing raster analysis)
aspect
the direction the slope is facing, can dictate the light display
need a digital elevation model and then the aspect tool
aspect map applications
microclimate analysis and identification
specialized agriculture
ski slope selection
remnants of rainforest
building constraints
vegetation erosion
zonal area statistics
statistics calculated based on the cell values of a raster
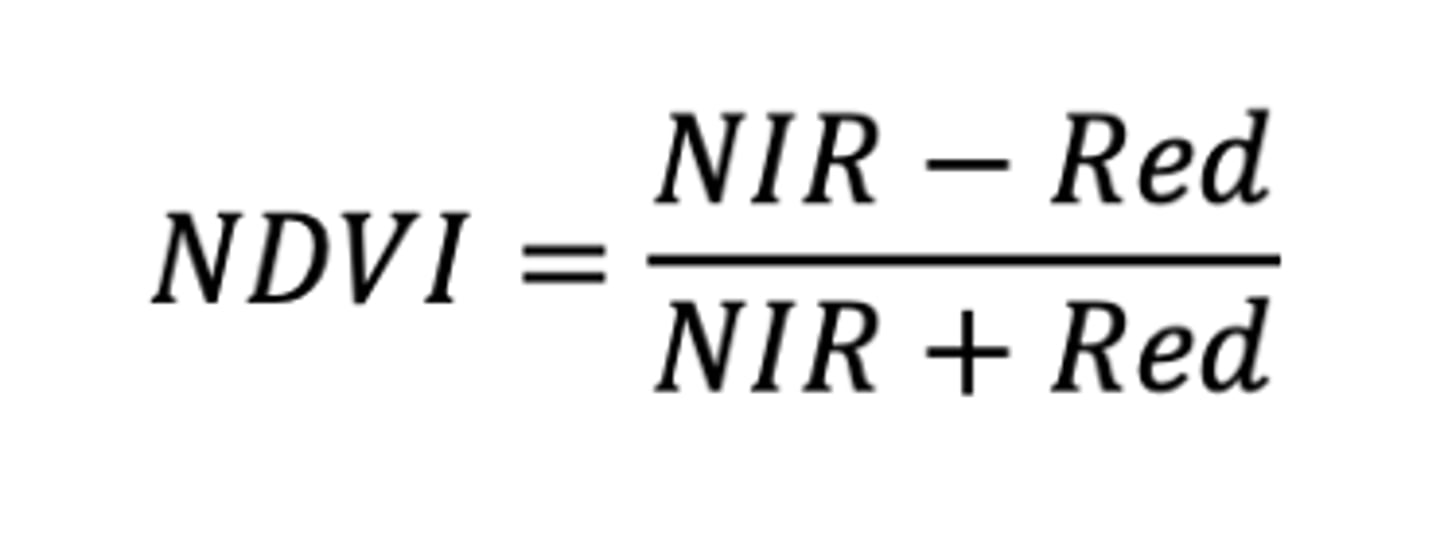
NDVI
normalized difference vegetation index
NIR = near infrared
principal point
the central point of the photo
relief displacement
effect in a photo that results in objects looking as if they were tilted outwards from the principal point
error in aerical photography
fiducial marks
marks at the edge of photographs which are used for locating the principal point in the image