Psychology Statistics Chapter 2
1/20
Earn XP
Description and Tags
Flashcards for reviewing frequency distributions and related concepts from a psychology statistics lecture.
Name | Mastery | Learn | Test | Matching | Spaced | Call with Kai |
|---|
No study sessions yet.
21 Terms
Frequency Distribution Table
An organized tabulation of the number of individualized scores located in each category on the scale of measurement.
It shows the frequency of an item in each separate data value rather than groups of data values
X
Represents individual scores or values in a frequency distribution table.
F
Represents the frequency of each score (how many times each score occurs).
N
Represents the total number of scores in a dataset (Add up all of F together)
∑X
The sum of all X values. Can be computed from a frequency distribution table.
Proportion (p)
p = f/N. Represents the fraction of the total group that is associated with each score, as a decimal.
Percentage
p(100) = f/N(100). Represents the percentage of the total group that is associated with each score.
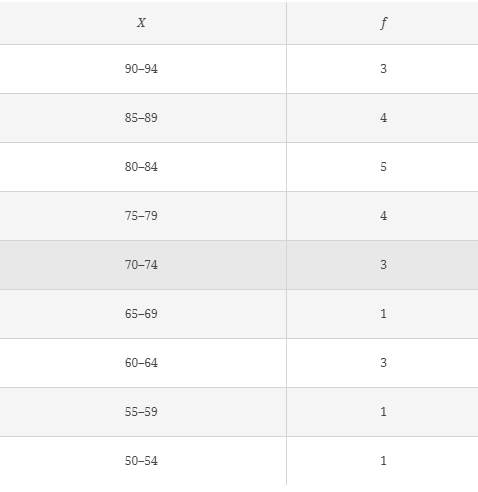
Grouped Frequency Distribution Table (GFDT)
A frequency distribution table where scores is arranged and separated into groups called class intervals.
Rule 1 for GFDT - Number of class intervals
GFDT should have around 10 rows of data
Rule 2 for GFDT - Interval Width
The width (number range) of each row of data should be a relatively simple number (2, 5, 10, or 20).
example: a width of 5 numbers (15-19,20-24,25-29)
Rule 3 for GFDT - Class Interval Start
Each class interval should start with a multiple of the width.
ex: if its 2 numbers wide, it should be a multiple of 2.
Rule 4 for GFDT - Interval Consistency
All intervals should be the same width with no gaps or overlaps.
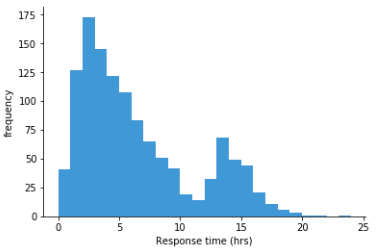
Histograms
Used for data measured on interval or ratio scales. (uses continuous data)
Width of bar extends to the upper and lower real limits
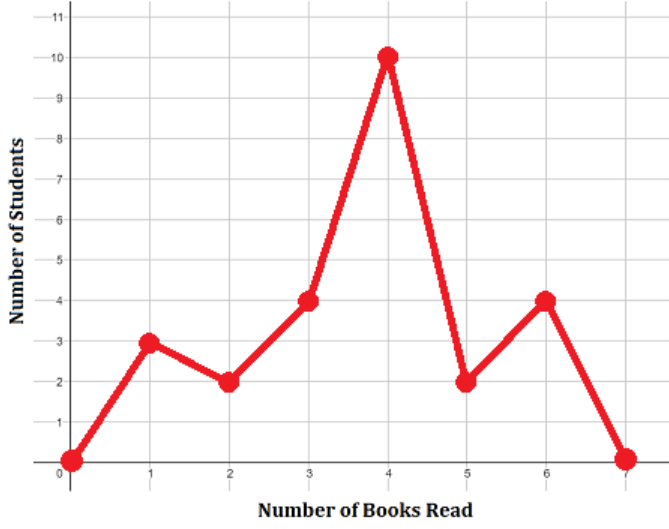
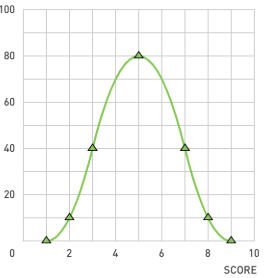
Polygons
for interval or ratio scale data (continious data)
Can be used with grouped FD tables by positioning the dot above the midpoint of the class interval.
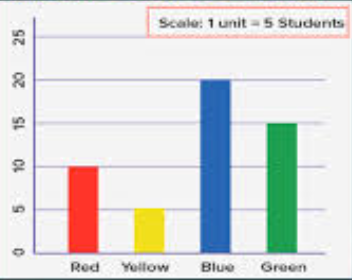
Bar Graphs
For use with scores measured on a nominal or ordinal scale (discrete/categorial data)
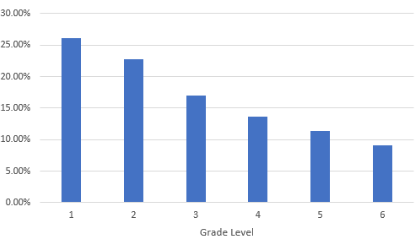
Relative Frequencies
For use with nominal or ordinal scales (categorical/discrete information)
Indicates that you are showing the relative change that occurs from one score to the next.
Smooth Curves
For use with data from an interval or ratio scale (continious data)
It indicates that you are not connecting a series of dots (real frequencies) but are showing the relative change that occurs from one score to the next
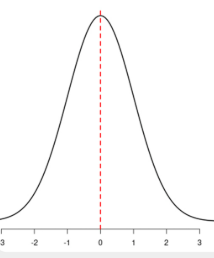
Symmetrical Distribution
One side of the distribution is a mirror image of the other.
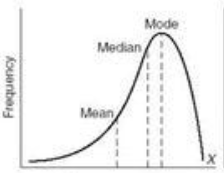
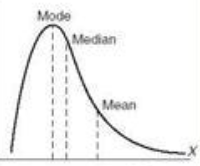
Skewed Distribution
The scores tend to pile up toward one end of the scale and taper off at the other.
Positive Skew
The tail points toward the positive end of the scale (above zero). Towards the right, higher scores
Negative Skew
The tail points toward the negative end of the scale (toward zero). Towards the left, the lower end of scores