Graphs wk 8
1/23
There's no tags or description
Looks like no tags are added yet.
Name | Mastery | Learn | Test | Matching | Spaced | Call with Kai |
|---|
No analytics yet
Send a link to your students to track their progress
24 Terms
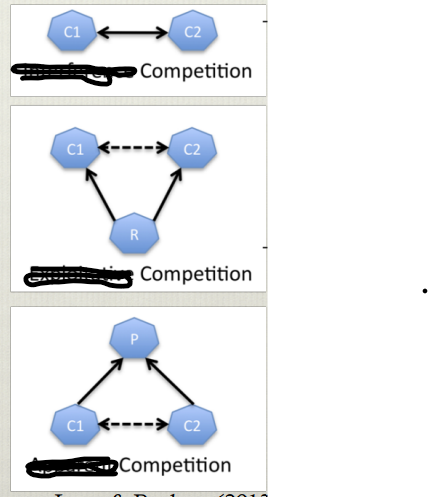
name the types of competition shown
1: interference, 2: exploitation, 3: apparent
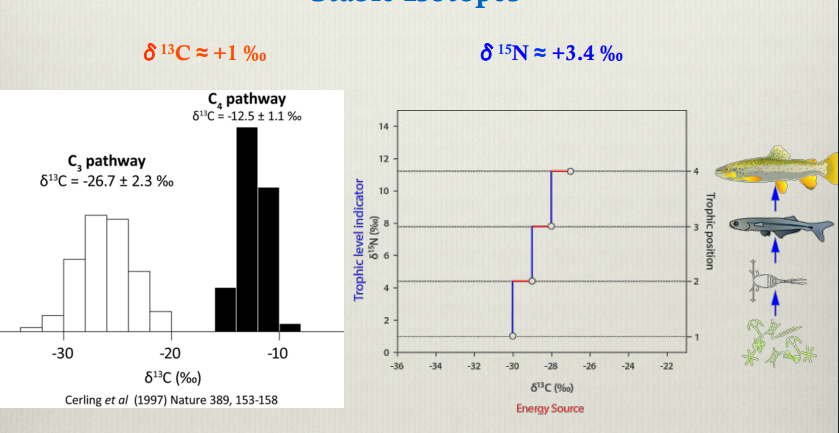
What do these graphs show
Shows that different isotope signatures are common at different trophic levels demonstrating that trophic levels differ biogeochemically and physiologically and allowing the quantification of the mean trophic level being fed on when analysing stomach contents
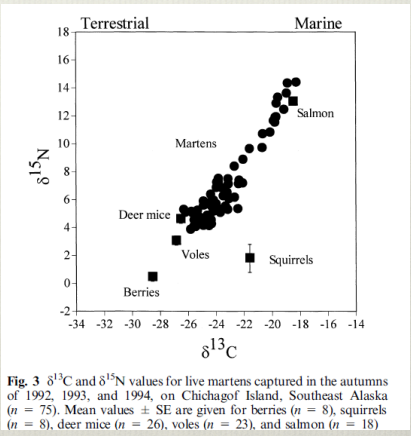
WHat does this show
Demonstrates the common diet of martens based on stable isotope analysis, The ratio of stable isotope signatures for carbon and nitrogen deomonstrates they feed primarily on deer mice but also salmon.
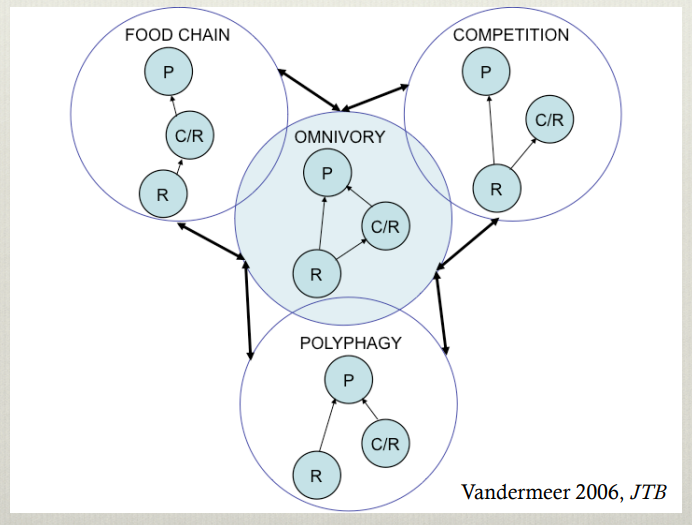
What types of competition are shown here
Tri trophic chain / chain interaction, omnivory, exploitation, apparent
Explain what this shows
Shows that the trophic module seen in a group of interconnected species can change. This is due to diet shifts in the predator and prey altering direct and indirect interaction.
What does this graph show
Shows that food web structure changes in response to changing habitat size. In this example the predator detritovore ratio changes with increasing habitat size. This also shows that the impact of changing habitat size depends on the presence of top predators, with the presence of a top predator resulting in an increase in predator prey ratio with increased habitat size, whereas the absence of a top predator results in a predatior detritovore ratio decrease with increasing habitat size. This is due to the top down control on species interactions in the ecosystem.
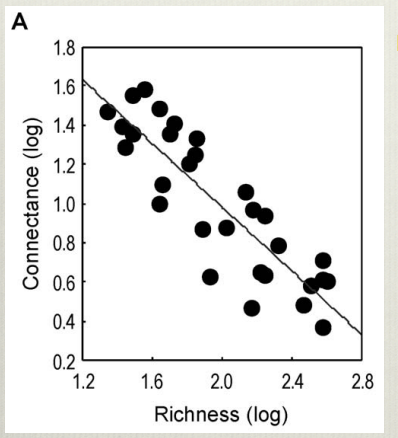
Explain this graph
This graph shows that connectance of a food web decreases with increasing species richness.
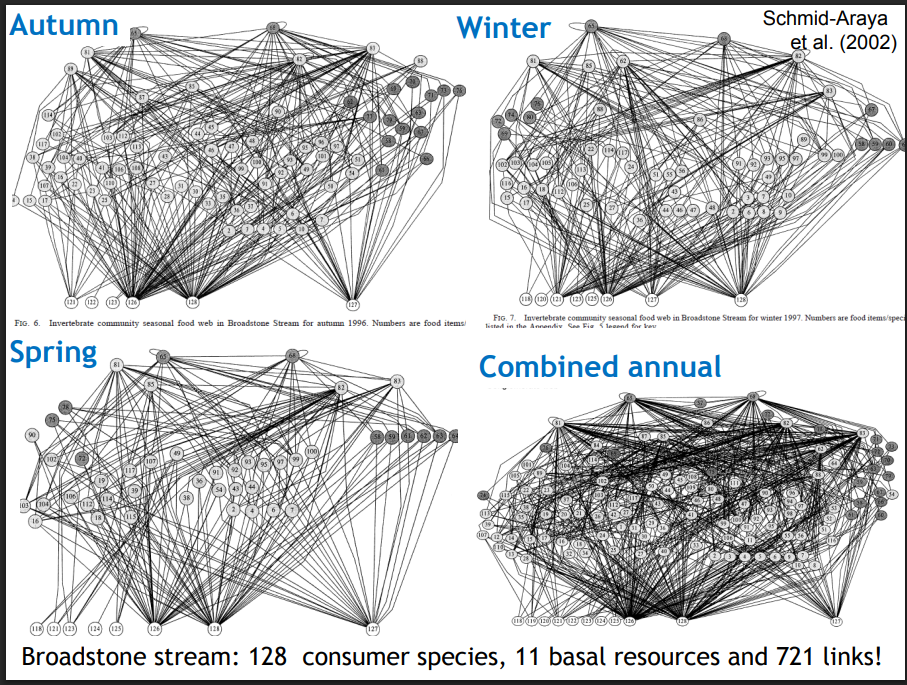
Explain this graph
This graph demonstrates how food web structure varies seasonally, with changes such as linkage density, connectance,, number of species,
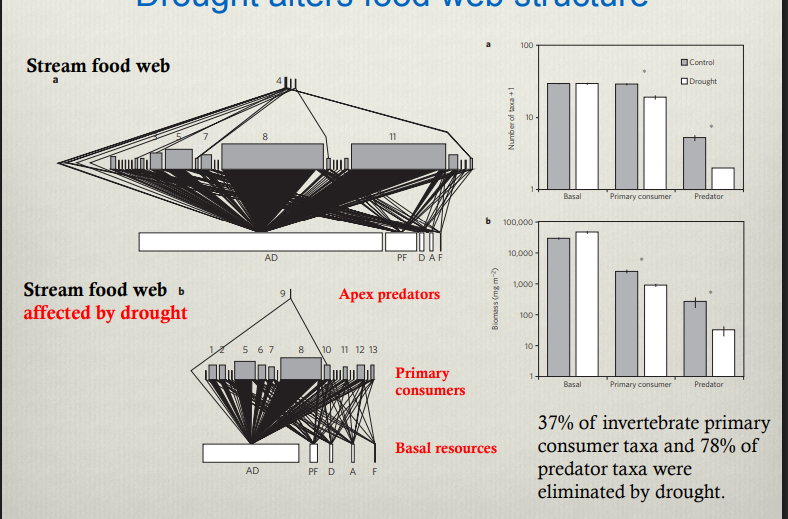
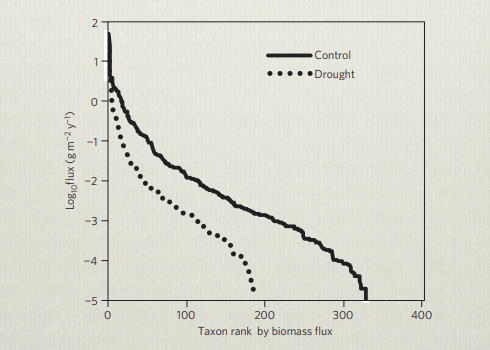
Explain this graph
Graph demonstrates how drought alters food web strucure. Firstly you can see that the number of predatory species decreases greatly, and that the number of primary consumers decreases slightly in the presence of drought. Secondly you can see that producers are unaffected by drought in terms of species richness. THis shows that drought disproportionately affects higher trophic positions resulting in a change in ratio between trophic levels. THis was attributed to greater physiological stress on larger species due to increased metabolic demands.
The food web comparison shows that although there is a decrease in the overal number of links, the network structure stayed fairly constant in regards to metrics such as connectance, linkage density and interaction diversity, suggesting that consumer diets remained consistent despite disturbance and harm to higher trophic levels is due to increased mortality from physiological stress rather than disruption of interactions.
Explain this graph
Graph shows that drought resulted in a reduced biomass flux from resources to consumers. This is occuring despite network restructuring showing that loss of diversity harms ecosystem functioning.
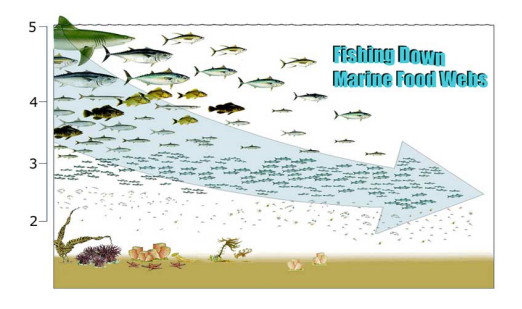
What process does this show
Fishing down the food web
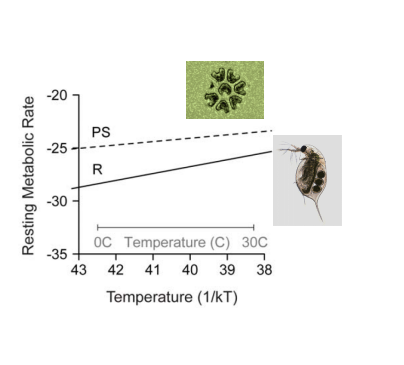
Explain the implications of this graph
Shows that the metabolic rate of autotrophs are less affected by warming than heterotrophs. THis is due to respiration and photosynthesis being variably affected by temperature. The result of this is that the metabolic rate of herbivores will be greater than that of the autotrophs they feed on leading to an increased ratio of herbivores to primary producers, and increased feeding. Therefore autotrophs will be under greater grazing pressure from heterotrophs with warming.
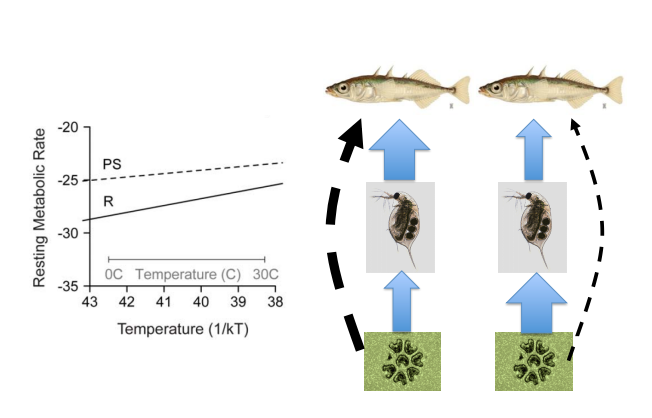
Explain the implications of this image
depending on whether the metabolic rate of predators or primary consumers are more increased by the effects of warming, primary producers will be differently affected by trophic cascades. If predators are more strongly influenced, herbivores may be regulated more, giving a net positive effect to primary producers. If the herbivores are more strongly affected, they could increase in number, resulting in greater grazing pressure on primary producers and reducing the positive effect of predators on primary producers.
Explain the implications of this graph
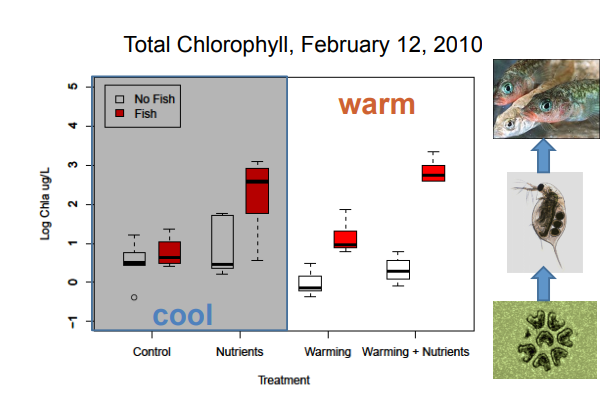
This graph shows how strong trophic cascades are in aquatic mesocosms in the presence or absence of fish depending on environmental factors. It can be concluded that both warming and nutrients increase the strength of top down control by predatory fish, causing a positive effect on primary producers which is evidenced by chlorophyll levels increasing. Strongest with both at once demonstrating interactions between the two effects.
Explain the implications of this graph
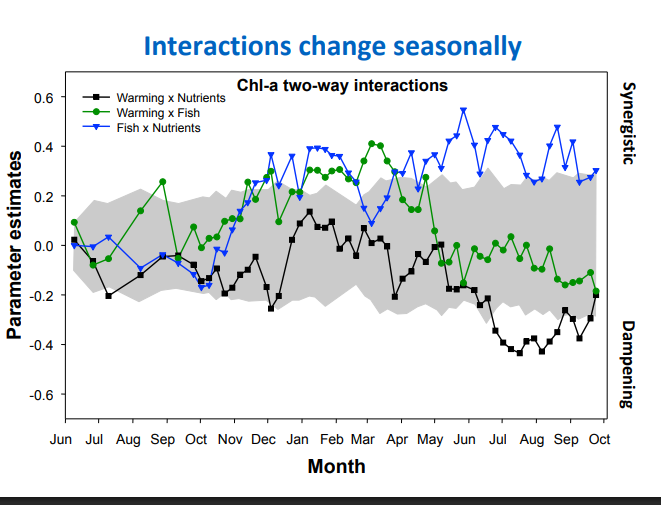
This graph shows that the impact of different environmental interactions vary seasonally.
Explain this graph
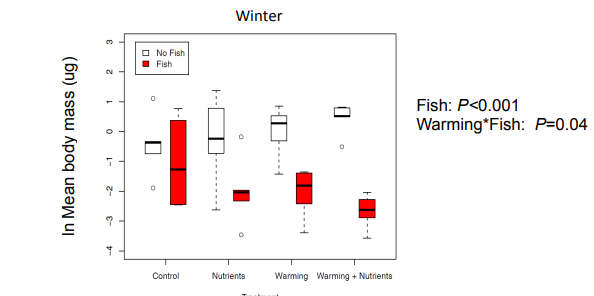
Shows that fish selectively feed on larger prey despite their ability to outcompete species in the absence of predators. an effect which, in winter, is amplified by warming and the addition of nutrients.
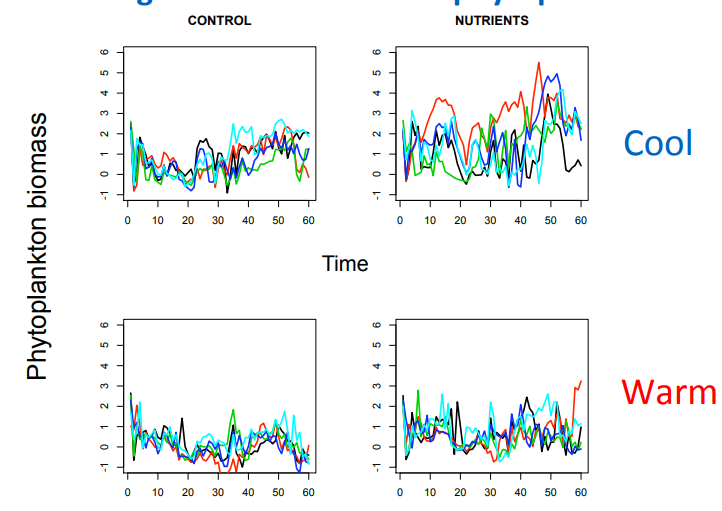
The fish feed selectively on daphnia increasing phytoplankton. Warming increases the proportion of daphnia meaning the trophic cascade is greater.
Explain this graph
Graph shows the effects of warming and nutrients on community stability. Addition of nutrients causes a destabilisation with incrreased fluctuation in species abundances. However the combination of warming and nutrients causes a stabilisation in these fluctuation.
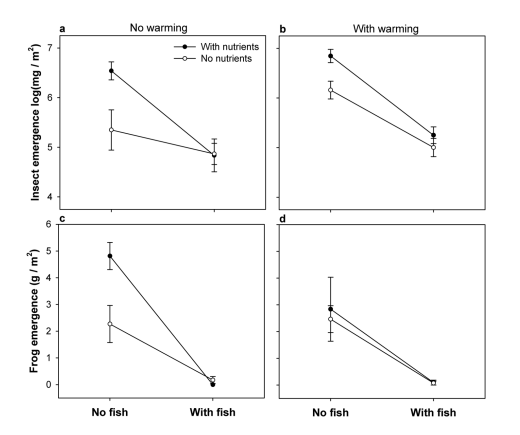
Explain this graph
Shows that trophic interactions in one ecosystem can impact another ecosyste, due to predation changing the biomass of subsidies, with the presence of fish causing the biggest impact - decrease in the amount of frog and insect emergence from aquatic systems. THe graph also shows that nutrients and warming impact the emergence of aquatic organisms and therefore cross species trophic transfer.
The reason for this is fish predate on aquatic organisms, while nutrients and warming exert bottom up control on primary consumers, especially in the absence of fish
Explain this graph
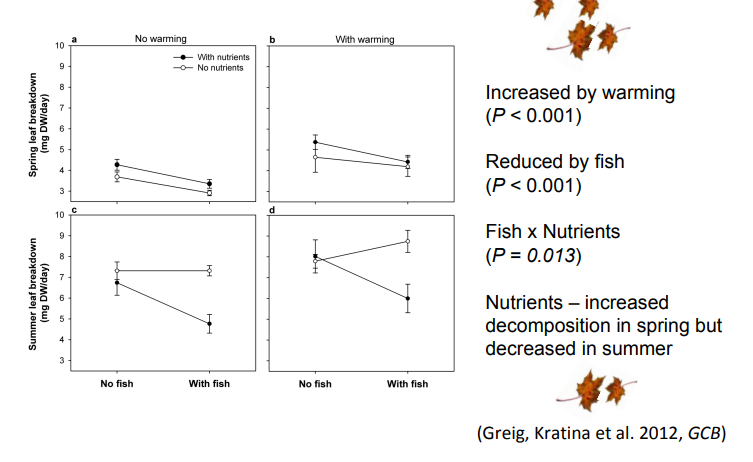
Shows that decomposition rate (and therefore subsidy of nutrients + energy across ecosystems) depends on top down control and environmental influences. Fish decrease decomposition rate by removing decomposer species via predation. Nutrients increase decomposition in spring and decrease in summer, demonstrating complex interactions. Warming increased decomposition.
Explain this graph
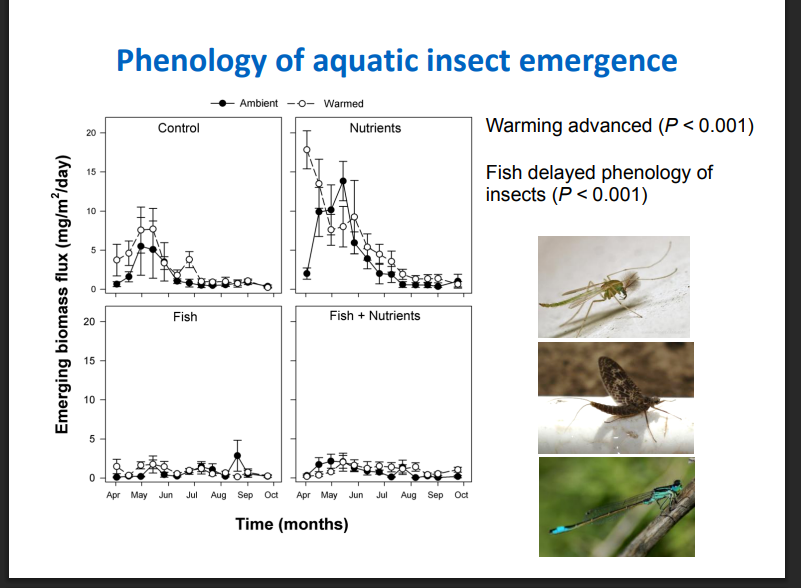
Explains how phenology of aquatic insect emergence changes depending on top down control and warming - warming advance fish delay - metabolism. This will impact the timing and availability of food resources in terrestrial ecosystems, affecting predator-prey dynamics and community structure.
Explain
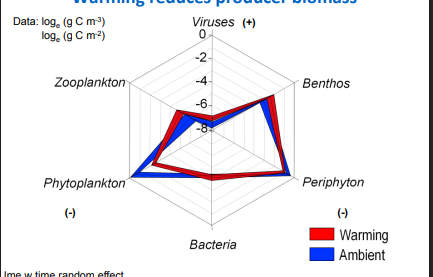
WArming reduces producer biomass (because it makes systems top heavy) Despite incrreased turnover, top down control means incrase from bottom up control it is only increasing fish.
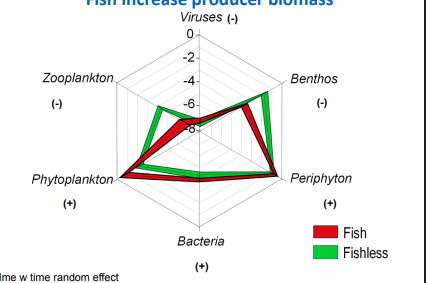
Explain
Fish increase producer biomass (because they control herbivore populations, enhancing plant growth and nutrient availability. )
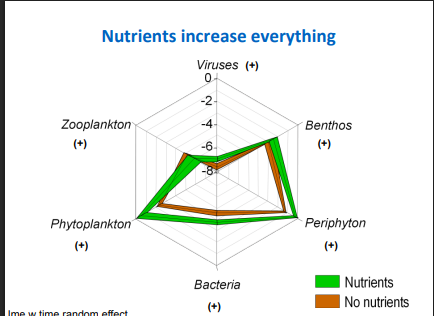
Explain
Nutrients increase all