Measuring the Transcriptome
1/17
There's no tags or description
Looks like no tags are added yet.
Name | Mastery | Learn | Test | Matching | Spaced | Call with Kai |
|---|
No analytics yet
Send a link to your students to track their progress
18 Terms
Genome
the entire compliment of DNA sequence within the cells of an organism
Transcriptome
groups of genes that are expressed within a cell or tissue
same in all neurones
isolating RNA
classic trizol method
1. cells/tissue are lysed/homogenized with trizol and physical methods (so DNA is spread)
2. chloroform added and sample vortexed
3. centrifuge for phase separation
RNA phase (top phase) transferred to another tube and precipitated with ethanol (or other solvent → as long as there are no enzymes that could damage the RNA)
PCR
polymerase chain reaction
used to measure gene/RNA expression (QPCR, in situ hybridisation) or manipulate genome/transcriptome (cloning and CRISPR)
uses Taq polymerase which has been modified to improve yield and efficiency
three step process:
denaturation
annealing
elongation
can use hot start to activate enzyme in some cases
Denaturation in PCR
temperature at 92-94C
double stranded DNA separates into two single strands
Annealing in PCR
temperature at 50-70C (primer dependent)
primer ( 20-24bp) binds to its complimentary sequence in DNA to be amplified
forward primer binds to 5’ and reverse primer binds to 3’
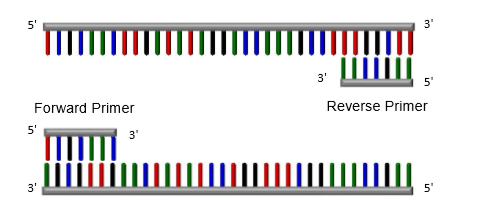
Elongation in PCR
temperature is around 72C
DNA polymerase binds to the 3’ end of the primers and copies the complementary sequence
General lab protocol for PCR
add things to eppendorf:
template DNA/RNA
primers
Taq polymerase
Buffer
dNTPs
amplify in thermocycler
run on agarose gel
visualise with UV light
Gel electrophoresis
visualise PCR products by running on agarose gel and imaging under UV light
can see if their is a product and estimate its size
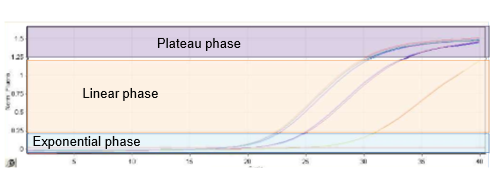
Quantitative PCR (QPCR)
DNA detected with fluorescent probe
PCR reaction is exponential → a detection threshold (Cycle threshold = CT) is set (higher starting amount = sooner reaches detection threshold)
can calculate the amount of DNA in samples compared to a control
calculate relative expression and normalise it
CT increase of 1 = increase by 50% as sample is doubled each cycle
two types: SYBRGreen and Taqman
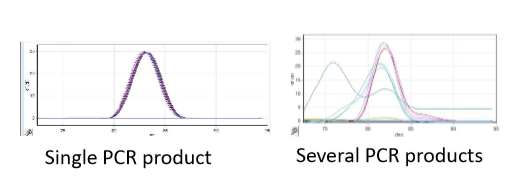
SYBRGreen QPCR
SYBRGreen molecule becomes fluorescent when intercalated with double stranded DNA, so more fluorescence means more double stranded DNA is present
analysed using melt analysis (measures fluorescence after increasing temp by 1C at a time)
advantage → uses regular PCR primers
disadvantage → cannot differentiate between gene of interest and other products
TAQMan QPCR
has forward, reverse and probe primers
probe primers have a fluorescent molecule which fluoresces when digested by Taq
more fluorescence = more double stranded DNA has been digested
advantage → highly specific
disadvantage → needs special and expensive primers
DNA microarrays
glass or silicone slide with thousands of microscopic DNA sports]
allows for relative quantification of many genes at once
each DNA spot has a known location and different sequence
samples are fluorescently labelled and incubated with the microarray. These bind to their complimentary DNA spots
fluorescence is measured → more target gene = more fluorescence
relative expression is calculated (there is a control for comparison)
Different types: Spotted DNA arrays and Affimetix gene chips
![<ul><li><p>glass or silicone slide with thousands of microscopic DNA sports]</p></li><li><p>allows for relative quantification of many genes at once </p></li><li><p>each DNA spot has a known location and different sequence </p></li><li><p>samples are fluorescently labelled and incubated with the microarray. These bind to their complimentary DNA spots </p></li><li><p>fluorescence is measured → more target gene = more fluorescence </p><ul><li><p>relative expression is calculated (there is a control for comparison) </p></li></ul></li><li><p>Different types: Spotted DNA arrays and Affimetix gene chips </p></li></ul><p></p>](https://knowt-user-attachments.s3.amazonaws.com/c3488270-ffc6-4d65-ae7d-0be8b6e96a5d.png)
Spotted DNA arrays
type of DNA microarray
PCR products of known genes spotted on support (glass, plastic or nylon)
control and treatment samples labelled with fluorescent colours and hybridized to same microarray
relative changes in gene expression calculated by comparing signals from control and treated
must be in the same microarray, so one per each treatment
Affy Gene Chips
developed by Affymetrix
short probes on glass slides
each sample labelled into different gene chip
relative changes in gene expression calculated by comparing readings of the chip with control and treated samples
normalised between chips using affymetrix oligos so only needs one control
expensive as company design is required
Sanger sequencing
first generation of sequencing
makes many products ending with specific base pairs
electrophoresis in microcapillary tube with smallest moving fastest and furthest
can read the sequence and spot mutations
is a slow process as genes are read one at at time
the normal sequence must be known to spot mutations
Next generation (2nd generation) sequencing
Library preparation → random fragmentation of DNA and ligation via custom linkers to solid phases (microbit support) within a bubble → these are called libraries
Amplification → each DNA fragment is amplified (clones stay close to original DNA fragment)
Sequencing → pyrosequencing or reverse terminator sequencing
Pyrosequencing → pyrophosphate released with every base pair
this is converted to ATP by ATP sulfurylase and adenosine
ATP is used to convert luciferin to oxyluciferin
oxyluciferin produces light detectable with a camera, with each flash telling the next base pair
Reverse terminator sequencing (Illumia)
the same as sanger sequencing but uses reversible termination