Functional MRI
1/15
There's no tags or description
Looks like no tags are added yet.
Name | Mastery | Learn | Test | Matching | Spaced | Call with Kai |
|---|
No analytics yet
Send a link to your students to track their progress
16 Terms
What type of scan protocol is used for fMRI? What does it detect?
T2*
Detects BOLD signal by measuring distortions in magnetic field which are caused by lower proportion of deoxyhaemoglobin to oxyhaemoglobin when circulation temporarily ‘overcompensates’ oxygen (and hence oxyhaemoglobin) for increased neural activity in an area
Assumption that T2* relies on (3)
When brain area is active → neurons use more oxygen → more oxygen is consumed → oxyhaemoglobin converted to deoxyhaemoglobin
Brain overcompensates by temporarily circulating more oxyhaemoglobin to area
Therefore, more active a brain region is → lower deoxyhaemoglobin:oxyhaemoglobin
What is blood oxygen level dependent (BOLD) signal?
Signal created by distortions to magnetic field created by deoxyhaemoglobin in the blood
Indirect measure of neural activity (indicates amount of O2 being used/circulated to region)
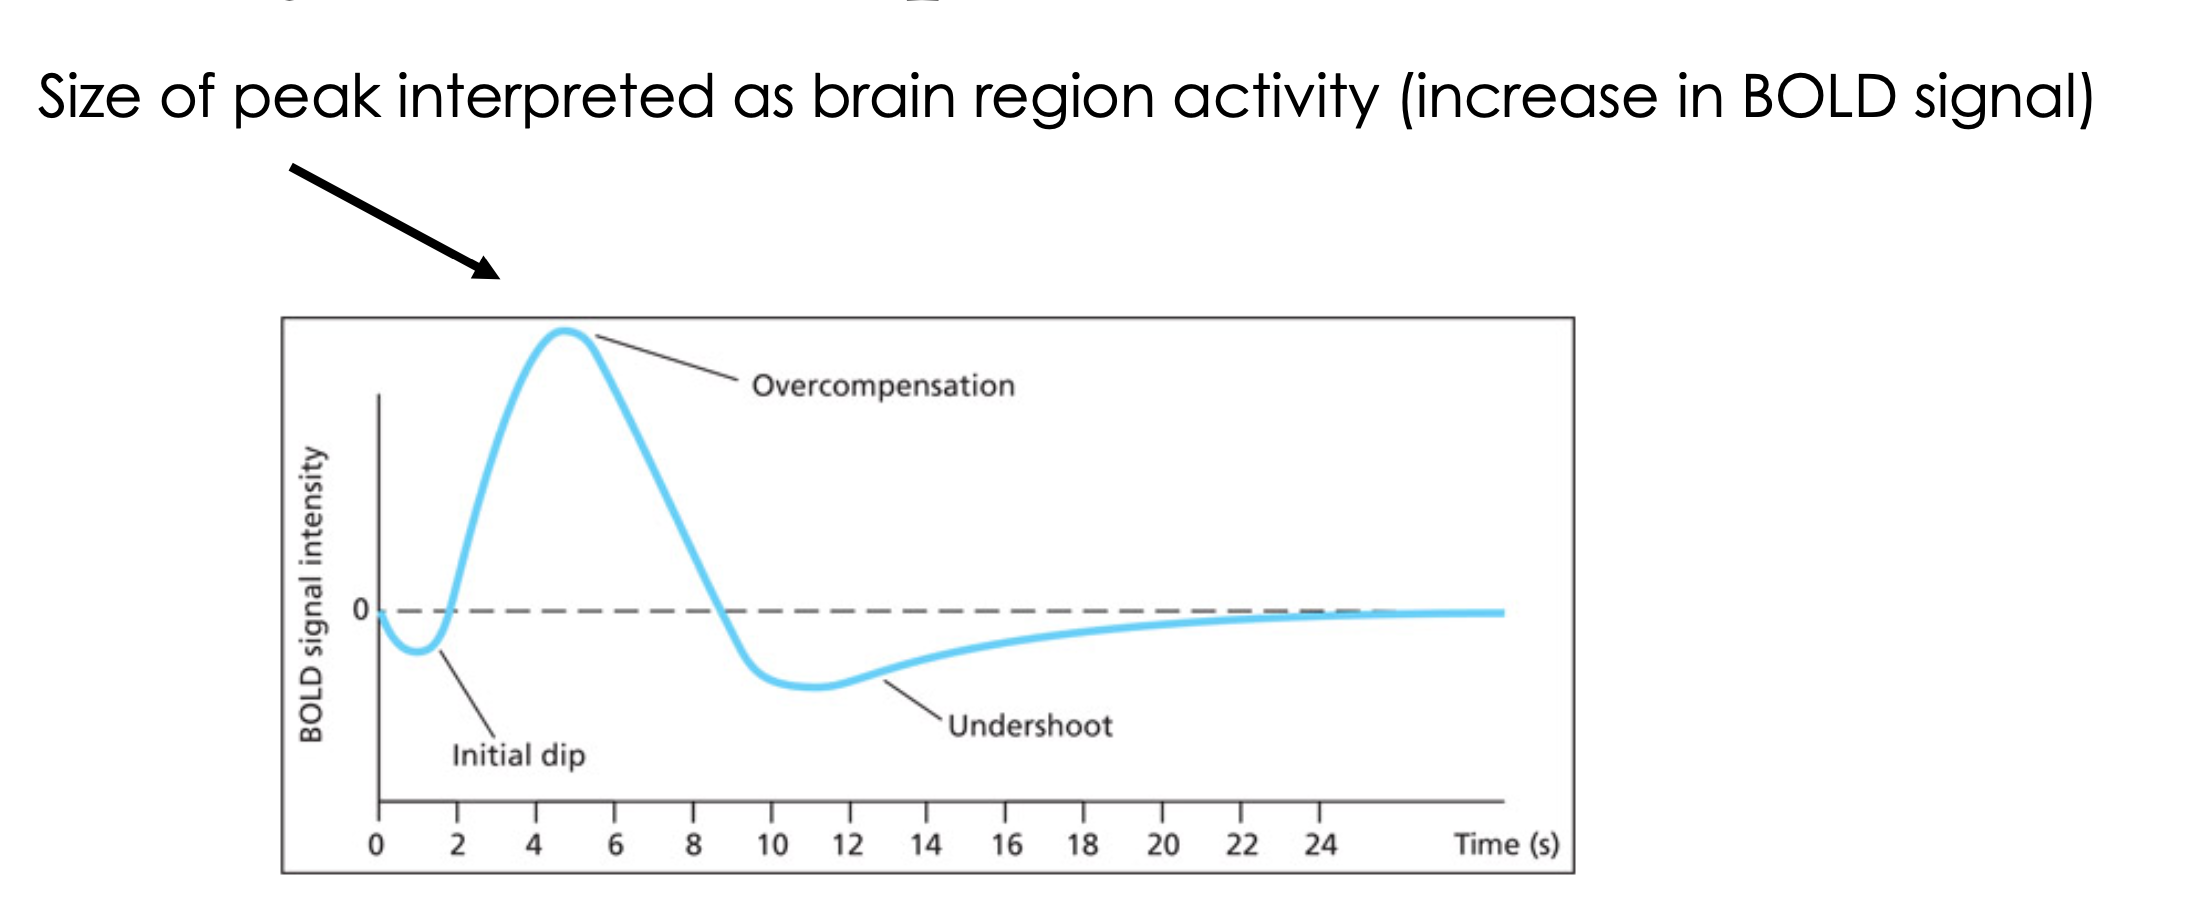
What is the hemodynamic response function (HRF)? (1)
Changes in BOLD signal over time following neural activity in the brain
3 phases of HRF
Initial dip . As neurons consume oxygen there is a small rise in the amount of deoxyhemoglobin, which results in a reduction of the BOLD signal.
Overcompensation . In response to the increased consumption of oxygen, the blood flow to the region increases. The increase in blood flow is greater than the increased consumption, which means that the BOLD signal increases significantly. This is the component that is normally measured in fMRI, and the size of this peak is taken as indicative of the extent to which this region is active in the task.
Undershoot . Finally, the blood flow and oxygen consumption dip before returning to their original levels. This may reflect a relaxation of the venous system, causing a temporary increase in deoxyhemoglobin again.
What is cognitive subtraction in relation to fMRI and BOLD signal?
Must compare brain activity during experimental and baseline conditions, since brain is always active and consuming oxygen (would be meaningless to only measure experimental condition)
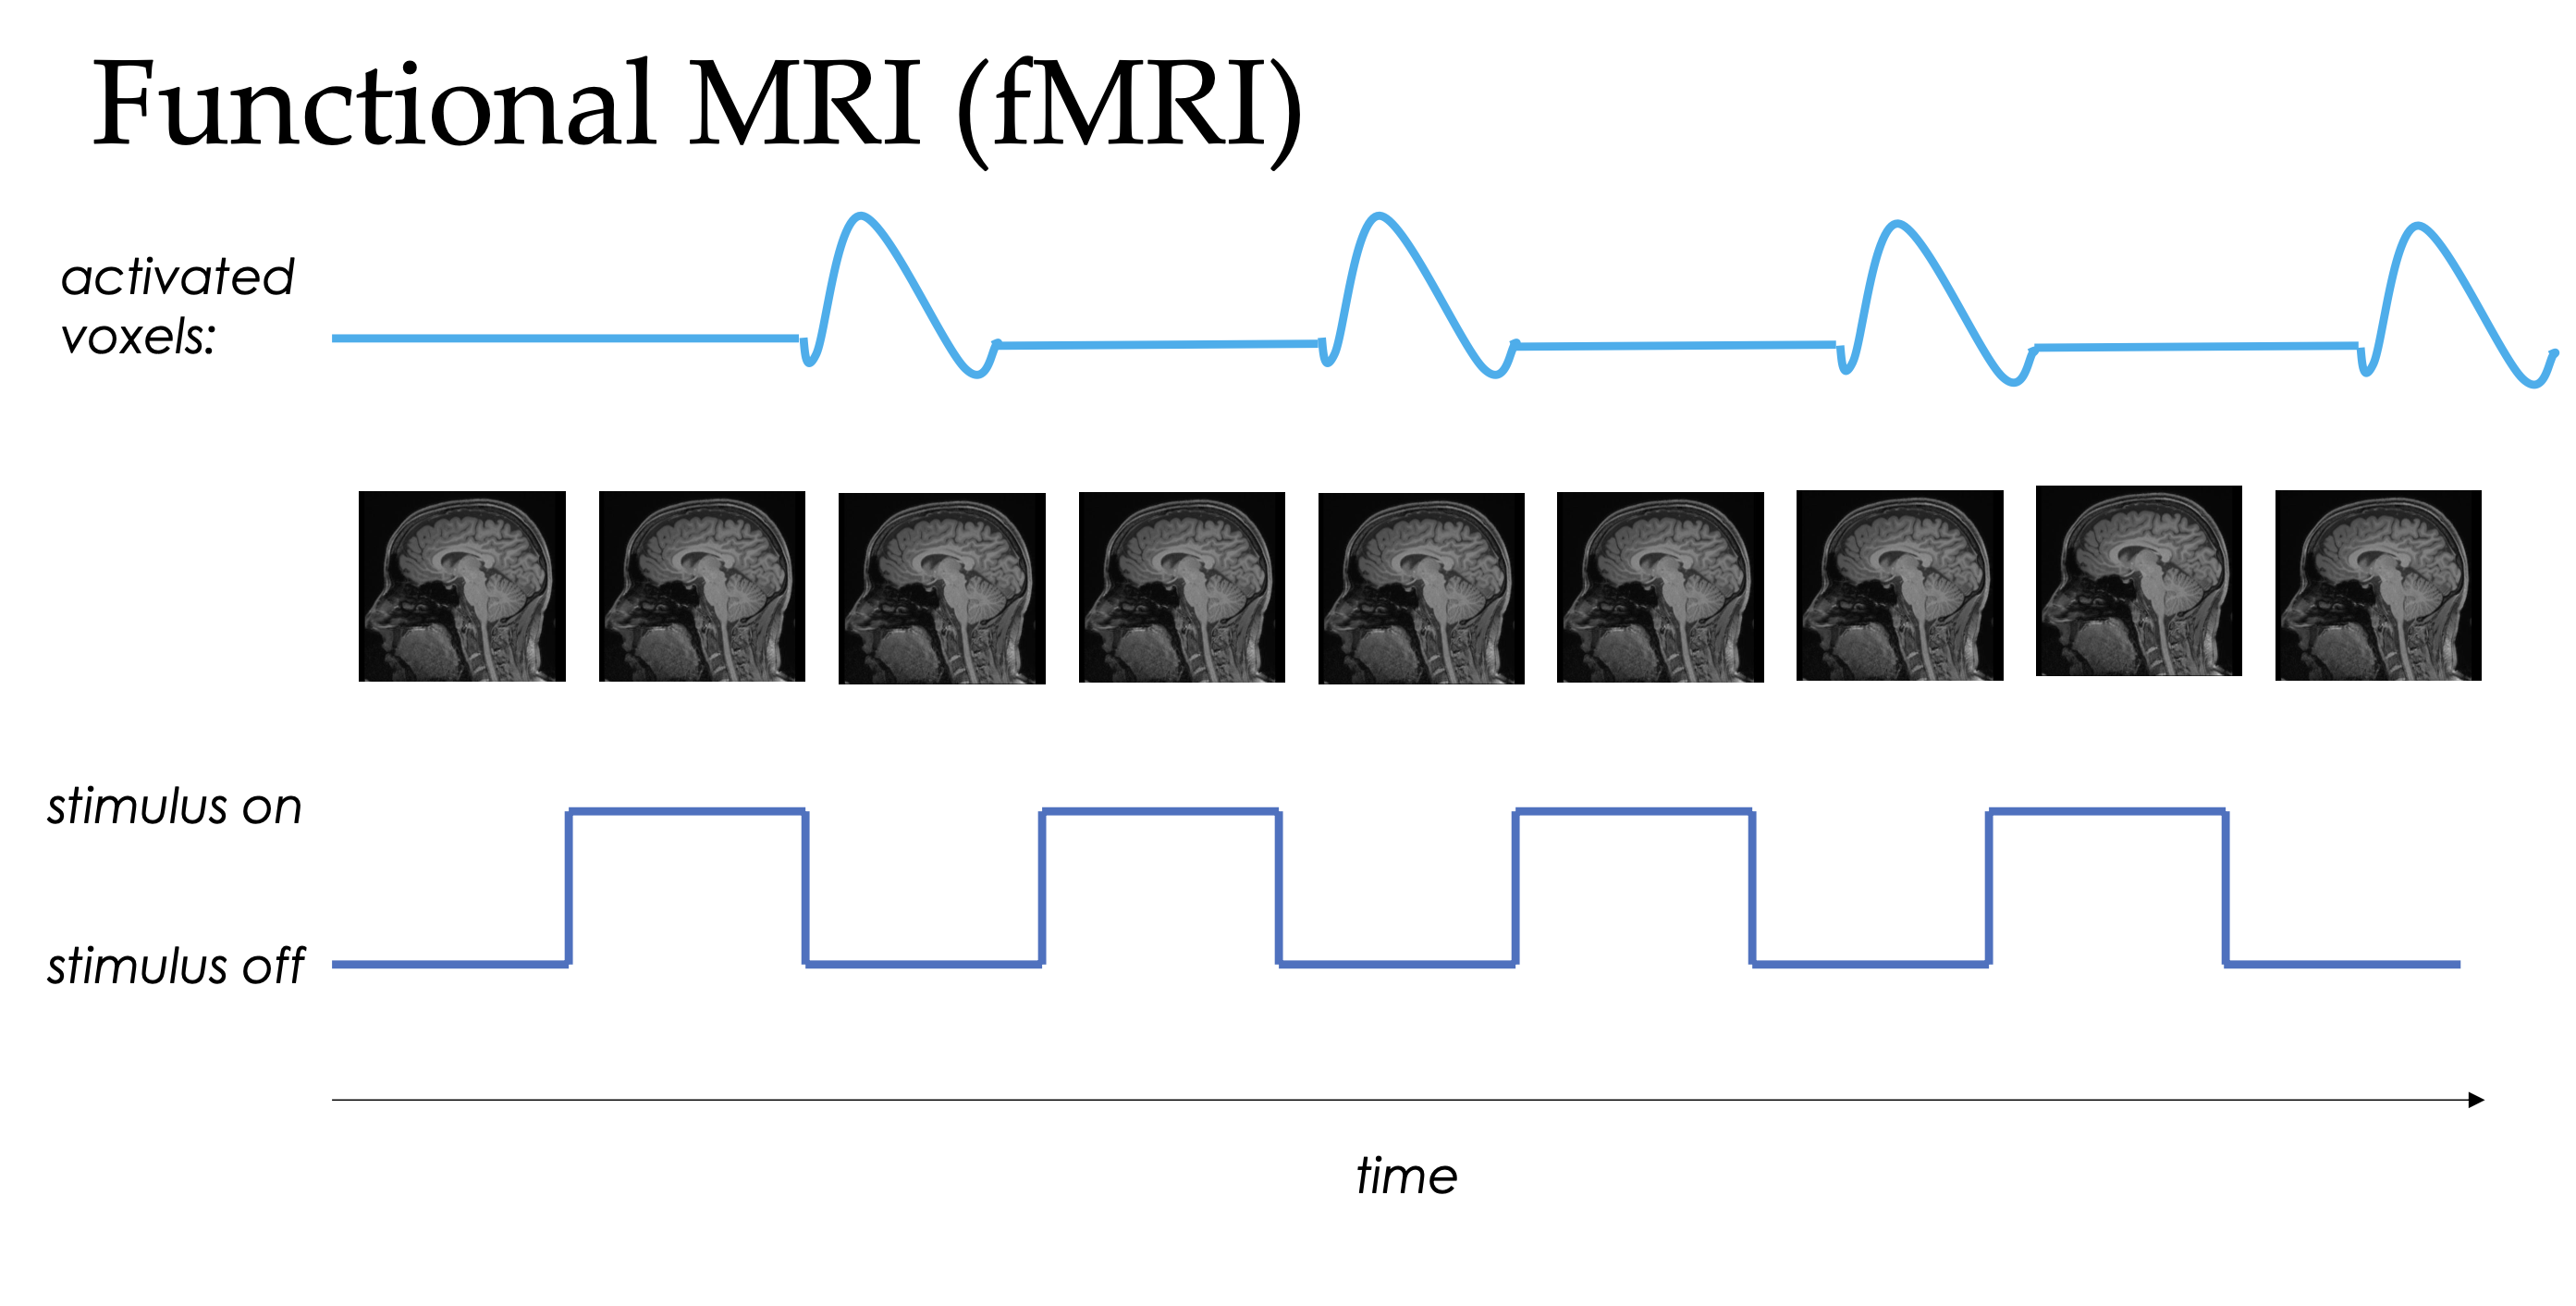
How fMRI is used + note
Model what you think signal would look like based on stimuli + expected hemodynamic responses → use model as predictor when looking at actual signals
Note change to signal is slightly delayed
Steps for preparing data for statistical analysis (3)
Correction for head movement
Normalisation
Smoothing
Purpose of correction for head movement (1)
Ensure each voxel represents same part of brain in each image
(Stereotactic) normalisation description (1) + purpose
Individual brain scans are mapped (layered + stretched) over standard reference brain (which was created by ‘melding’ many brains together)
Corrects for unique shape and size of brains so comparisons can be made between individuals
Purpose of smoothing
Increases signal to noise ratio using mathematical ‘kernels’
What type of statistical analyses are typically conducted on fMRI data?
T-tests to compare brain activity between different experimental conditions
Modern fMRI approaches (2)
Brain Networks: Moving beyond specific regions to identify networks like the Default Mode Network (DMN), which is active during mind-wandering or rest
Decoding (MVPA): Using machine learning (Multi-Voxel Pattern Analysis) to train classifiers that can identify categories (e.g., cat vs. dog) based on whole-brain patterns (kind of like mind-reading based on brain activity, i.e. classifier looks at voxel patterns to identify what type of stimulus is being observed)
Strengths of MRI/fMRI (3)
• Non-invasive
• Good spatial resolution
• Lots of data!
Weaknesses of MRI/fMRI (3)
Poor temporal resolution (because BOLD signal is delayed measure of neural activity, 4-6 seconds after stimulus for signal to peak)
Loud scanner
Expensive + resource heavy
Physical constraints (difficult for claustrophobia + small children who move a lot)
Limitations in who it can be used for (no metal transplants)
fMRI caveat (1→1)
Shows which brain regions are involved but can’t prove that they’re responsible/crucial, necessary
More activation =/= more processing