Economics HL - Macroeconomic Policies
1/63
Earn XP
Description and Tags
Name | Mastery | Learn | Test | Matching | Spaced | Call with Kai |
|---|
No analytics yet
Send a link to your students to track their progress
64 Terms
Macroeconomic Objectives
Economic Growth: Increase real GDP over time.
Low Stable Rate of Inflation: Maintain manageable and predictable price levels.
Low Unemployment: Minimize joblessness to utilize productive capacity.
Sustainable Level of Debt: Ensure public debt remains manageable long-term.
International Stability and Competitiveness: Balance trade, currency stability, and global competitiveness.
Equitable Society: Reduce inequality through policies like progressive taxation and welfare.
Fiscal Policies: Definition
Government use of taxation and spending to influence the economy (economic activity, employment, inflation)
Government Spending (G): Infrastructure, education, healthcare.
Taxation (T): Income tax, corporate tax, VAT.
Evaluation
Automatic stabilizers: Unemployment benefits (↑ in recession), progressive taxes.
Keynesian multiplier: initial injection of government spending into the economy leads to a larger increase in Aggregate Demand (AD) and Real GDP due to repeated rounds of spending
Government spending → GDP growth (if spare capacity).
Fiscal Policy: Pros
✅ Pros:
Quick impact (especially spending).
Direct job creation (e.g., infrastructure projects).
Can target inequality (progressive taxes, welfare).
Fiscal Policy: Cons
❌ Cons:
Crowding out effect (govt borrowing ↑ → private investment ↓).
Time lags (delays in implementation).
Risk of budget deficits if overused.
Fiscal Policies: Contractionary ←
typically implemented to:
reduce inflationary pressures
stabilize the economy
prevent excess economic growth from causing overheating (limit of capacity)
to get to:
full employment
low sustainable rate of inflation
Fiscal Policies: Expansionary →
government expenditure increases
reduction in taxes to stimulate economic growth
boost aggregate demand
encourage investment
reduce unemployment
used during periods of economic slowdown or recession
Fiscal Policy: Tax Types
Income Tax: Levied on personal income (wages, rent, dividends). Primary revenue source for governments.
Corporation Tax: Direct tax on business profits.
Capital Gains Tax: Applied to profits from investments (e.g., stocks, property).
Inheritance Tax: Tax on wealth transferred between individuals (e.g., bequests).
Windfall Tax: One-time levy on unexpected gains (e.g., lottery wins, corporate takeovers).
Fiscal Policy: Goals
Maintain low, stable inflation.
Achieve low unemployment (full employment).
Stabilize economic fluctuations (reduce business cycle volatility).
Promote equitable income distribution.
Ensure external balance (manage trade deficits/surpluses).
Balance the budget and manage public debt.
BUDGIE:
Business cycle fluctuations (stabilize)
Unemployment (full unemployment)
Distribution of Income (equitable distribution)
Growth
Inflation (low and stable)
External Balance (ensure, manage trade deficits/surpluses)
Monetary Policy: Definition
Central bank actions to control money supply & interest rates
Interest Rates:
↓ Rates → Cheaper loans → ↑ C + I → AD ↑.
↑ Rates → Costlier loans → ↓ C + I → AD ↓.
Quantitative Easing (QE): Buying bonds to inject money into the economy.
Reserve Requirements: Adjusting bank reserve ratios.
Monetary Policy: Pros
✅ Pros:
Quick implementation (no legislative delays).
Independent central banks reduce political bias.
Monetary Policy: Cons
❌ Cons:
Liquidity trap (interest rates near 0% → ineffective).
Time lags (takes ~18 months to fully affect economy).
Can worsen inequality (asset prices ↑ benefit the wealthy).
Monetary Policy: Goals
Primary Goal: Maintain price stability (control inflation).
Secondary Goals: Promote sustainable growth, reduce unemployment (dual mandate in some countries).
Key Proponents: Keynesian economists advocate using monetary policy to stimulate demand during recessions.
Monetary Policy: Tools
Interest Rates:
Base Rate/Discount Rate: Central bank sets benchmark rates; influences borrowing costs.
Lower rates → Cheaper loans → ↑ Consumption (C) & Investment (I) → ↑ AD.
Higher rates → Discourage spending → ↓ AD.
Open Market Operations (OMOs):
Buying/selling government bonds to adjust money supply.
Buy bonds → Inject liquidity → ↑ Money supply → ↓ Interest rates.
Sell bonds → Reduce liquidity → ↓ Money supply → ↑ Interest rates.
Reserve Requirements:
Mandate the % of deposits banks must hold (not lend).
Lower reserves → Banks lend more → ↑ Money supply.
Quantitative Easing (QE):
Central bank purchases long-term securities to inject liquidity during crises
Monetary Policy: Expansionary →
Goal: Stimulate AD during recessions (close deflationary gap).
Actions: ↓ Interest rates, ↑ Money supply via OMOs/QE.
Impact: AD shifts right → ↑ Real GDP, ↑ Employment.
AD1 → AD2 → Real GDP rises (Y1 → Y2), price level ↑ (P1 → P2).
Monetary Policy: Contractionary ←
Goal: Reduce AD during high inflation (close inflationary gap).
Actions: ↑ Interest rates, ↓ Money supply via bond sales.
Impact: AD shifts left → ↓ Inflation, ↓ Overheating.
AD1 → AD2 → Real GDP falls (Y3 → Y2), price level ↓ (P2 → P1)
Market-Based Supply-Side Policies: Definition
Policies to increase efficiency & LRAS by reducing government intervention.
Deregulation: Reducing business restrictions (e.g., Uber vs. taxis).
Privatization: Selling state-owned firms (e.g., British Rail).
Labor Market Reforms:
↓ Minimum wage → More hiring.
↓ Unemployment benefits → Incentivize work.
Tax Cuts: Corporate tax cuts to boost investment.
Market-Based Supply-Side Policies: Pros
✅ Pros:
↑ Competition → Lower prices, better quality.
Encourages innovation & entrepreneurship.
Market-Based Supply-Side Policies: Cons
❌ Cons:
↑ Inequality (e.g., lower wages, reduced worker rights).
Short-term unemployment (e.g., firms cut costs).
Interventionist Supply-Side Policies: Definition
Government-led policies to boost productivity & LRAS.
Education & Training: Upskilling workforce (e.g., Germany’s apprenticeships).
Infrastructure Investment: Roads, broadband (e.g., China’s Belt & Road).
Industrial Policy: Subsidies for R&D (e.g., US CHIPS Act for semiconductors).
Interventionist Supply-Side Policies: Pros
✅ Pros:
Corrects market failures (e.g., underinvestment in education).
Long-term growth ↑ (human capital & infrastructure).
Interventionist Supply-Side Policies: Cons
❌ Cons:
Expensive (higher taxes or borrowing).
Risk of government failure (misallocation of funds).
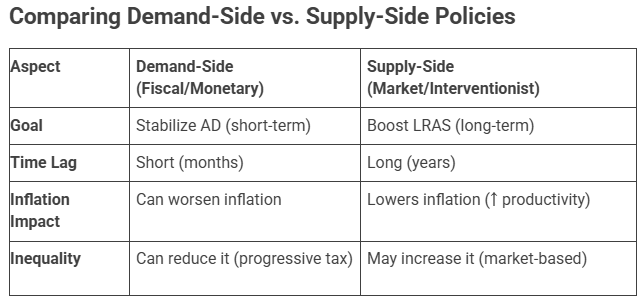
Demand-Side vs Supply-Side
Crowding Out: Definition
Government crowds out the private sector (loanable funds and interest rates)
when government borrowing reduces the level of private investment in the economy
Occurs when the government attempts to stimulate the economy by increasing government expenditure on infrastructure
G↑ → GDP↑ but private investment↓
Crowding Out: Gov-Funded Expressway Example
Must run a budget deficit and finance its increased spending in some way
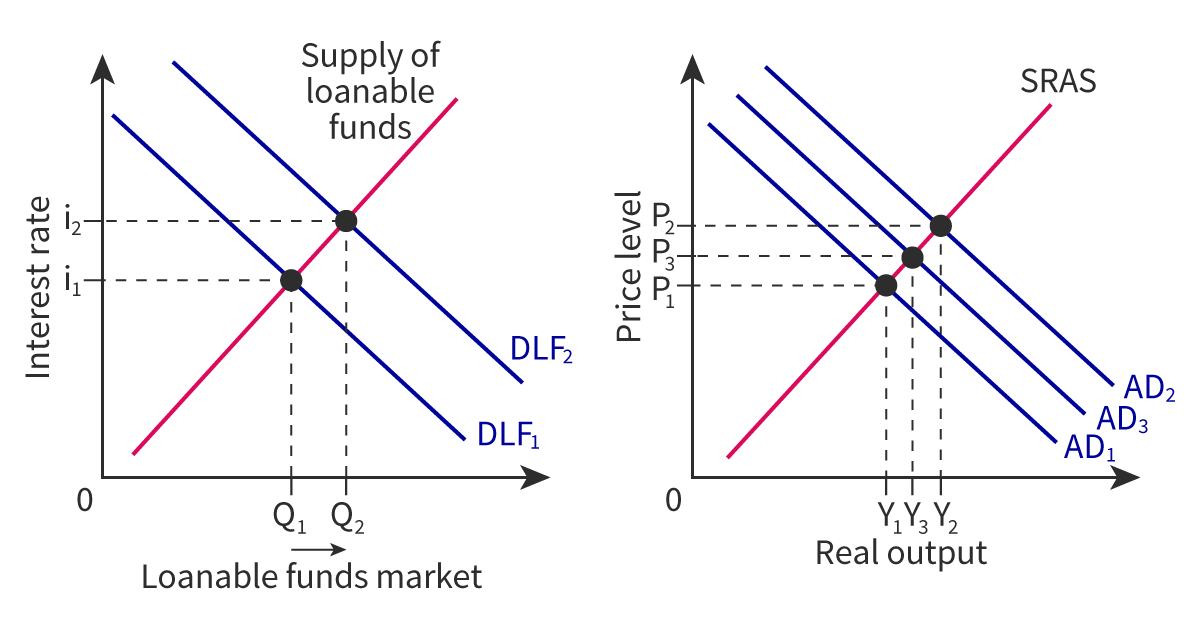
increase in government expenditure (G) on road building will shift out the aggregate demand curve from AD1 to AD2, increasing the price level from P1 to P2 and increasing real output from Y1 to Y2
Crowding Out: Domestically-Borrowed Expressway Example
Sell bonds and compete directly with the private sector in the loanable funds market
Loanable funds market = where potential investors are able to obtain money or funds for investment projects. Investors weigh up the cost of borrowing money (the interest rate) against the expected return on their investment. If the interest rate is low, and the expected return from the investment is high, then the potential investor is likely to borrow the funds.
Competition will drive the interest rate from i2 to i2
As interest rates rise, firms may find it too expensive to invest in projects → overall investment in the economy will fall
Decrease in investment (I) will shift AD2 to AD3, which is crowding out
Price level will fall from P2 to P3 and output will fall back from Y2 to Y3
Crowding out depends heavily on the interest rate change
Real Interest Rate = Nominal Rate - Inflation Rate
Real Interest Rate = Nominal Rate - Inflation Rate
Keynesian Multiplier Effect: Definition
how an initial injection of government spending into the economy leads to a larger increase in Aggregate Demand (AD) and Real GDP due to repeated rounds of spending
Marginal Propensity to Consume (MPC)
MPC = Δ Income / Δ Consumption
proportion of income spent on consumption
for ever dollar earned, percentage of dollar you spend
100% of Income
MPC + MPS + MPI + MPT = 1 (100% of income)
Marginal Propensity to (Consume + Save + Imports + Tax) = 1
Spending Multiplier
Spending Multiplier = 1 / (1 - MPC)
Example:
Initial injection = $100 million.
Leakages: 10% saved (MPS), 10% imports (MPI), 20% taxes (MPT) → Total leakages = 40%.
MPC = (1 - 0.4) = 60%
Multiplier = 1 / (1-0.6) = 2.5
Total AD Increase: 100 million × 2.5 = 250 million
Tax Multiplier
Tax Multiplier = MPC / MPS = MPC / (1 - MPC)
Q2CELL
Quantity and Quality of Capital, Enterprise, Land, Labor
Quality and Quantity of Labor
Higher population growth or immigration increases the workforce
Incentives: benefits, cutting income tax
Better education, training, and skill development improve labor productivity
Investment (spending money on capital goods: tech, R&D, new factories, machine upgrades
Increasing the quality and quantity of capital and improving the productive efficiency
Technological Advancements
Innovations in production methods boost efficiency and output.
Automation and AI reduce costs and increase productivity.
Long-Run Aggregate Supply (LRAS)
Vertical curve at full employment output.
Reflects the economy’s productive capacity, unaffected by price levels.
LRAS: Rightward Shift
Q2CELL = Quantity and Quality of Capital, Enterprise, Land, and Labor
Improved technology, education, infrastructure, resource discoveries, immigration, competition (deregulation)
LRAS: Leftward Shift
Huge decrease in labor productivity
Mass capital depreciation
War, conflict, natural disaster → destroys infrastructure → reduces quantity of capital
Death → reduces quantity of labor
Health crisis → affects productivity and quantity of labor
Hysteresis = long-term unemployment where workers become discouraged
When workers leave the economy → reduce the quantity of labor
Natural disasters, wars, capital depreciation, health crises, reduced labor productivity
Neo-Classical Model: Flexible Wages
Markets self-correct through flexible wages and prices. Temporary rigidities exist, but long-run equilibrium restores full employment without government intervention.
Keynesian Model: Sticky Wages
Wages do not adjust quickly, leading to prolonged unemployment.
fire > cut wages (demotivated, less productive)
Deflationary Gap ◀
AD < full employment output (LRAS), causing unemployment
Deflationary gaps result in unemployment and potential deflation (if prices are flexible)
Inflationary Gap ▶
AD > full employment output, causing rising prices
Inflationary gaps drive price increases (demand exceeds capacity)
Full Employment
Maximum sustainable output using all factors of production efficiently
Includes natural unemployment (e.g., workers transitioning jobs)
Indirect Taxes
Indirect tax is the tax levied on the consumption of goods and services (not directly levied on the income of a person)
Sales Tax (VAT): charge the manufacturing, sale, and consumption
Carbon Tax: imposed on firms producing excessive carbon emissions to discourage pollution
Nominal GDP: Calculation
value of final goods and services evaluated at current-year prices
Ex: NGDP2010 = Q2010 x P2010
Limitations:
Prices distorts data, only shows cases where the prices goes up
Unsure if the market is PRODUCING more
Real GDP: Calculation
use base year prices and current quantities to calculate
Ex: RGDP2011 = Q2011 x P2010
GDP Growth Rate: Calculation
Percent Change = %Δ
[(New Value - Old Value) / (Old Value)] x 100%
GDP Deflator: Calculation
[Nominal GDP / Real GDP] x 100%
Unitless, just a number
GDP Deflator = [(NGDP) / (RGDP)] x 100%
Inflation Rate: Calculation
Inflation Rate = [(GDPcurrent - GDPpast) / (GDPpast)] x 100%
Ex: [(GDP2011 - GDP2010) / (GDP2010)] x 100%
Aggregate Demand (AD): Rightward Expansion
Good:
↑ employment
GDP ↑
Incomes ↑
Standard of living ↑
Not-so-Good:
Inflationary gap ↑
Average price level ↑
Deficit spending → debt ↑ → interest ↑
Unsustainable, beyond potential
Fixed amount of FoPs, producing beyond full employment → more demand but for same amount of FoPs
Demand > Supply
Can temporarily increasing GDP
Prices going up
Equality vs Equity
Equality = same treatment/support for all.
Equity = fairness; ensuring everyone has opportunities to succeed.
Equality
Treated equally, assumed that everyone will benefit from the same supports
same treatment/support for all
Equity
Fairness, everyone should be given the same opportunities to succeed, empowerment
fairness; ensuring everyone has opportunities to succeed
Equity: Importance
Social stability: less turmoil, protests, polarization
Human potential: prevents wasted talent (poverty cycle)
Economic benefits: higher motivation, expanding markets, more competition
Social cohesion: less crime, violence, mistrust, and power imbalance
Well-being: better health indicators, improved quality of life
Inequality: Causes
Low-income households
Limited education/health access
Malnutrition, child labor
Entrapment in the poverty cycle
Lorenz Curve
Graph showing income distribution
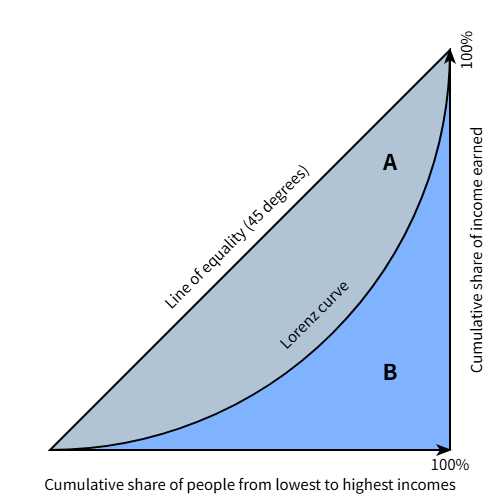
Gini Index
Gini Index: ratio of area between Lorenz curve & line of equality to total area under equality line
Area above Lorenz curve and below equality over the total area below line of equality
Multidimensional Poverty Index (MDPI)
MDPI: indicator that considers health, education, and living standards
Distribution of Income Solution: Direct Support
Subsidized education (esp. lower quartiles)
Food assistance (stamps)
Unemployment benefits (automatic stabilizer)
Direct provision of services (healthcare, housing)
Progressive Tax
Higher-income → higher % taxed.
✅ Promotes equity, raises government revenue, more equal economy
❌ Tax evasion risk, work disincentive, politically unpopular
Limitations: only for income and wages, seperate from assets and stocks (capital gains: profits gained from the sale of capital assets)
Proportional (Flat) Tax
Same tax % for all income levels
One rate for every income level, will help redistribute wealth but it’s more equal than equitable
Fair tax, always a fixed percent
✅ Simple, predictable, “fair” rate
❌ Limited redistribution effect
Regressive Tax
uniform tax rate → heavier burden on low incomes (e.g., VAT value-added tax, cigarette tax)
Takes a larger percentage of income from lower-income earners than from high-income earners; makes inequality worse, higher income → lower average tax
✅ provide governments with a steady and reliable source of revenue, which is critical for maintaining public infrastructure, social programs, and economic stability
❌ Increases inequality, widens the wealth gap, making necessities more expensive for lower-income earners
Transfer Payments
Assistance given to different groups in the economy to improve standard of living and create a more equitable society
Child support, disability pay, government pensions, unemployment benefits, subsidies, tuition aid, food stamps, childcare.
Tax Deductions
donations, education/childcare, green energy savings, used with government subsidies; amounts that can be subtracted from tax payment
If the person puts sums of money towards work expenses, education and child care or products the government deems “positive” to society
Automatic Stabilizers (Fiscal Policy)
Fiscal mechanisms that adjust without new government action
Designed to offset fluctuations in a nation’s economic activity without any additional intervention by the government
Progressive income taxes
Corporate taxes
Unemployment benefits
Function: dampen booms & recessions (deficits in recessions, surpluses in booms).