STAT 250 Exam 1 Study Guide
1/35
There's no tags or description
Looks like no tags are added yet.
Name | Mastery | Learn | Test | Matching | Spaced | Call with Kai |
|---|
No analytics yet
Send a link to your students to track their progress
36 Terms
What variable from this dataset is displayed? Is it categorical or quantitative?
Variable: Percent of state residents with a college degree. This is quantitative.

42.7% of Connecticut residents had a college degree. What are the cases to arrive at this figure?
Residents of Connecticut
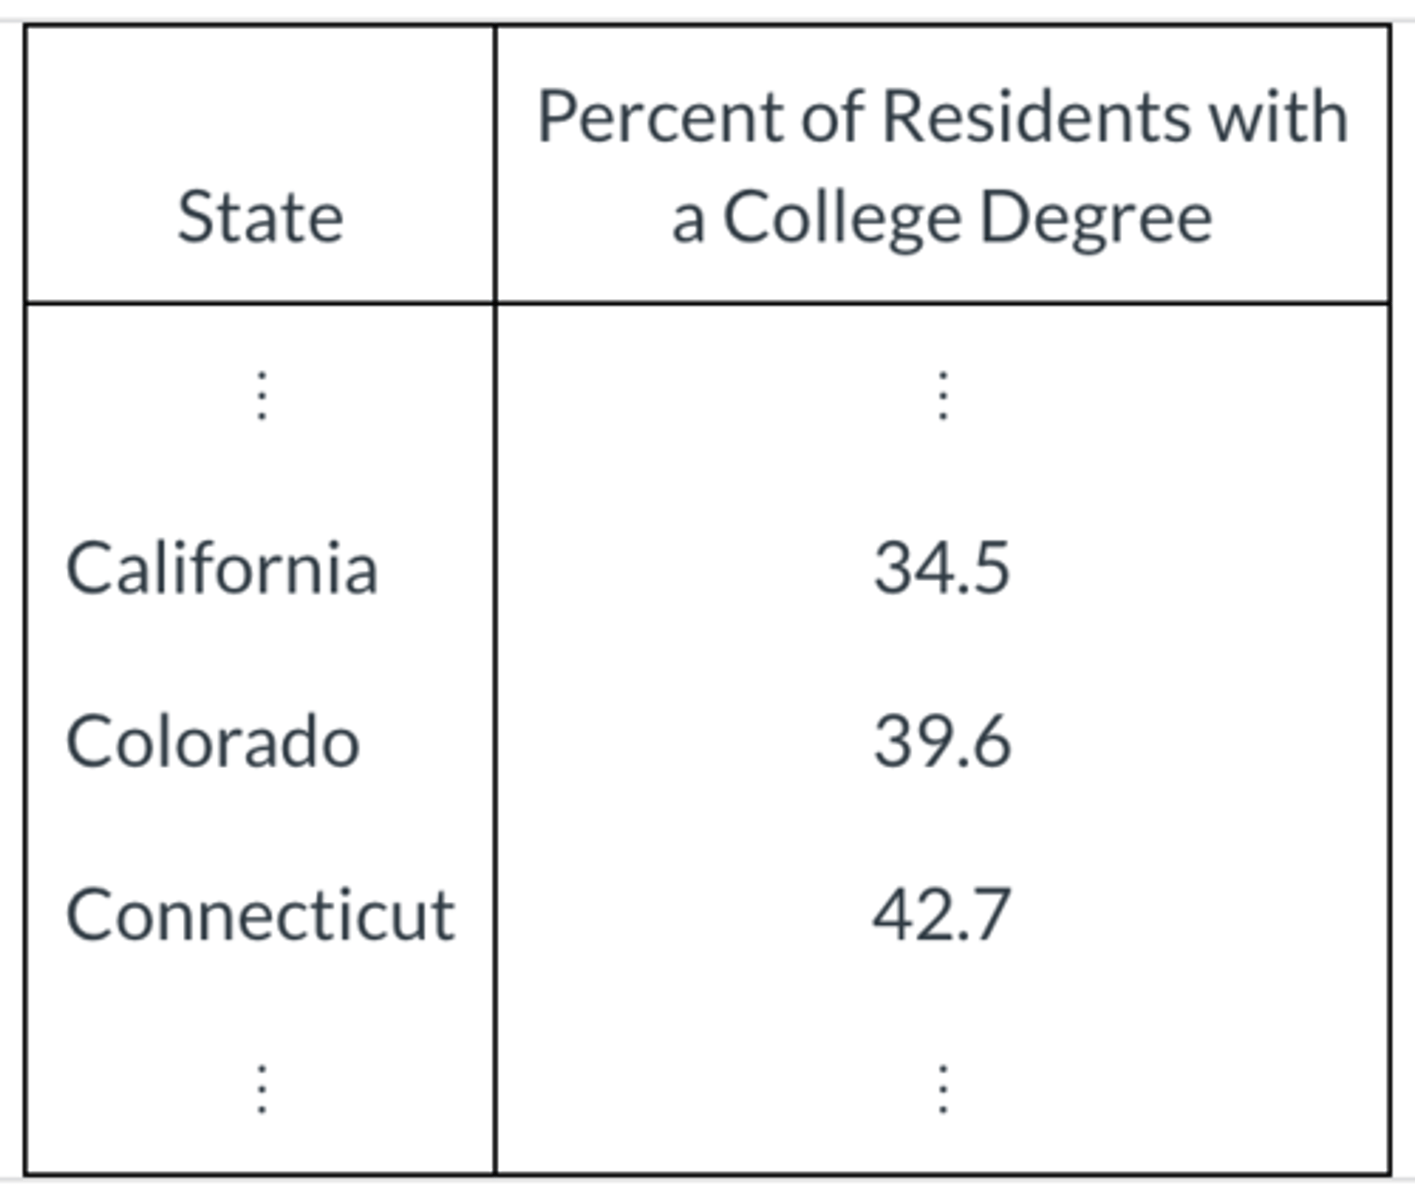
What variable what used to determine 42.7% of Connecticut state residents have a college degree? Is it categorical or quantitative?
Variable: Whether or not they have a college degree. This is categorical.
In the given situation, indicate whether the method of data collection is biased.
A campus bookstore is holding a drawing to give away five free textbooks (one per student).
Students enter the contest by writing their name and contact information on an index card. The index cards were placed in a bowl, thoroughly mixed around, and five cards were selected. Those five students were contacted and received their free textbook.
Not Biased
A realtor's website provides information on area homes that are for sale. Identify the given variable as either categorical or quantitative.
List Price: amount, in thousands of dollars, for which the house is being sold
Quantitative
A realtor's website provides information on area homes that are for sale. Identify the given variable as either categorical or quantitative.
School District: the school district in which the home is located
Categorical
A realtor's website provides information on area homes that are for sale, including the following variables: List Price, School District, Size, Style.
What are the cases in the realtor's dataset?
Individual Houses
What are the cases in this dataset?
States

A tree enthusiast is interested in estimating the typical length of oak tree leaves. He chooses 30 leaves from the oak tree in his backyard.
What is the sample in this situation?
30 leaves selected from this oak tree
A tree enthusiast is interested in estimating the typical length of oak tree leaves. He chooses 30 leaves from the oak tree in his backyard.
What is the population in which the tree enthusiast is interested?
All oak tree leaves
In the given situation, indicate whether the method of data collection is biased.
A professor is considering a new textbook for her introductory statistics class. She wants to choose a book that emphasizes graphing data. A book that she is considering has 530 pages. To estimate the proportion of pages in the book that have displays of data, she randomly generates 20 numbers between 1 and 530. She then records whether or not each selected page contains displays of data.
Not Biased
Sampling Some Starbucks Restaurants
The Starbucks chain has about 24,000 retail stores in 70 countries. * Suppose that a member of the Starbucks administration wishes to visit six of these stores, randomly selected, to gather some firsthand data. Suppose the stores are numbered 1 to 24,000. Use a random number generator or table to select the numbers for 6 of the stores to be in the sample.
Which of the following may be an actual outcome of this process?
362, 17630, 1891, 3570, 1269, 12590
Identify whether the following scenario describes a randomized comparative experiment or a matched pairs experiment.
To study the impact of texting while driving, researchers have students drive around an obstacle course twice, once while texting and once without texting (the order of which was randomized).
Their score for each turn is the number of obstacles they successfully maneuvered around.
Matched Pairs Experiment
Identify whether the following scenario describes a randomized comparative experiment or a matched pairs experiment.
Studies have shown that multi-tasking typically results in lower productivity. However, some people believe that individuals who play video games are better at multi-tasking. To investigate this, 28 video game players were randomly assigned to one of two groups. One group was assigned to play a video game that involved driving a car around a track. The other group was assigned to play the same video game while simultaneously answering unrelated trivia questions over the phone.
Randomized Comparative Experiment
A group of students were asked to count the number of scars on both of their hands. The number of scars on their dominant hand was compared to the number of scars on their "off" hand. Is this an observational study or a randomized experiment?
Observational Study
A university's Admissions staff sends one of four different representatives to work at college fairs. A study was conducted to evaluate the relative effectiveness of the four representatives.
For each college fair over the course of the year, the number of inquiries from students, the type of fair (large or small), the representative who worked at that fair, and the percent of inquiries that resulted in applications were recorded. It was found that one of the representatives was far more effective at getting lots of inquiries.
What are the cases in this study?
College Fairs
A university's Admissions staff sends one of four different representatives to work at college fairs. A study was conducted to evaluate the relative effectiveness of the four representatives.
For each college fair over the course of the year, the number of inquiries from students, the type of fair (large or small), the representative who worked at that fair, and the percent of inquiries that resulted in applications were recorded. It was found that one of the representatives was far more effective at getting lots of inquiries.
Is this an observational study or an experiment?
Observational Study
A university's Admissions staff sends one of four different representatives to work at college fairs. A study was conducted to evaluate the relative effectiveness of the four representatives.
For each college fair over the course of the year, the number of inquiries from students, the type of fair (large or small), the representative who worked at that fair, and the percent of inquiries that resulted in applications were recorded. It was found that one of the representatives was far more effective at getting lots of inquiries.
Can we conclude that sending the most effective representative to more college fairs will increase the number of inquiries from those college fairs?
No
A group of researchers investigated the effect of media usage (whether or not subjects watch television or use the Internet) in the bedroom on "Tiredness" during the day (measured on a 50
point scale).
Identify the variables described and whether they are categorical or quantitative.
Categorical = Media Usage In The Bedroom Quantitative = Tiredness
A group of researchers investigated the effect of media usage (whether or not subjects watch television or use the Internet) in the bedroom on "Tiredness" during the day (measured on a 50
point scale).
Identify the variables as either explanatory or response variables?
Explanatory = Media Usage In The Bedroom Response Variable = Tiredness
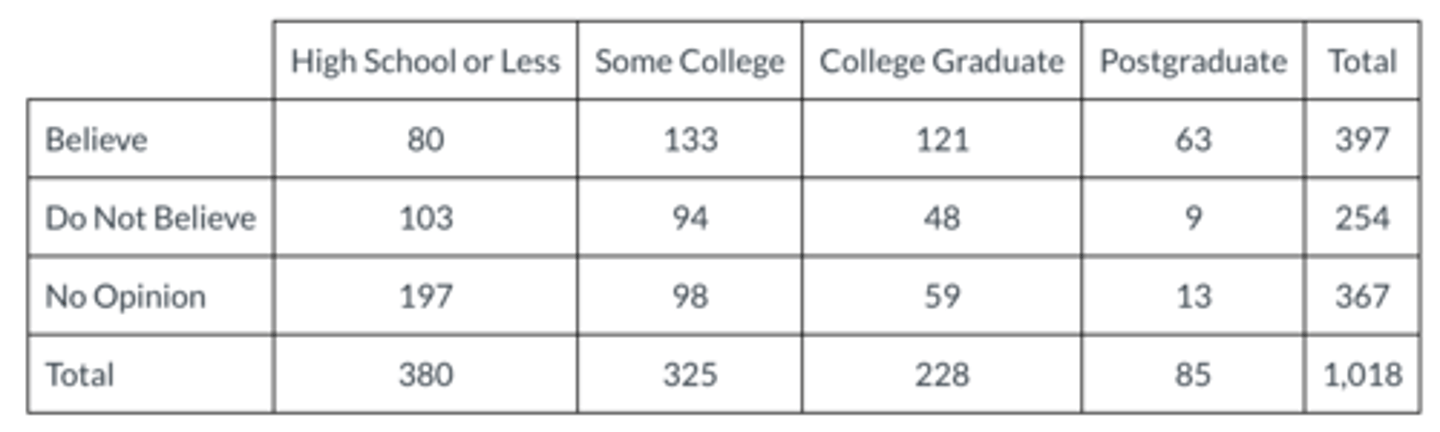
What proportion of the category of college graduates believe in the theory of evolution?
0.5307
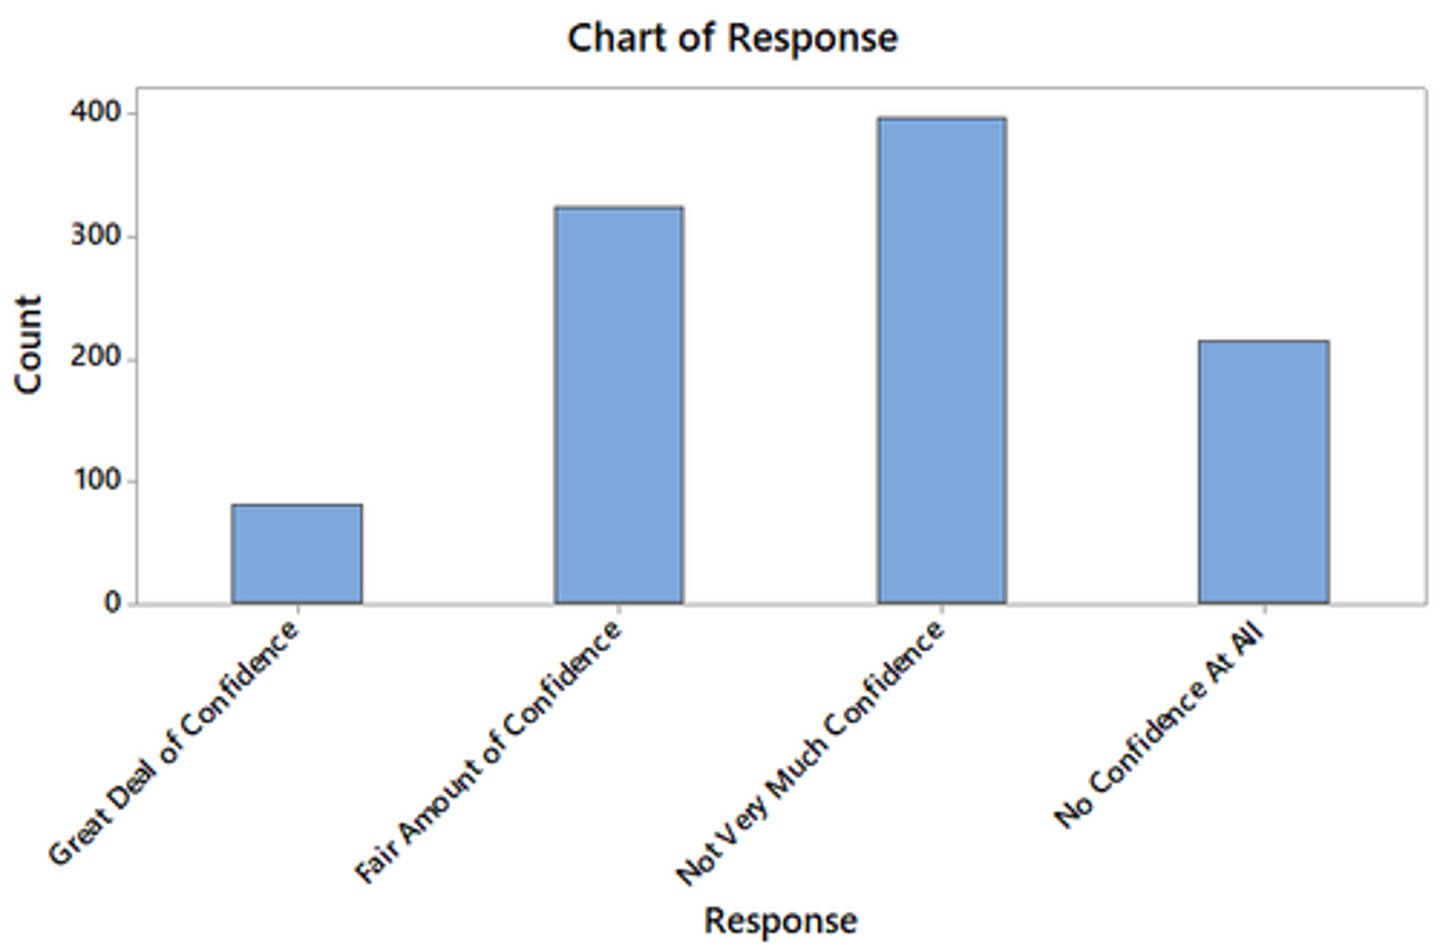
In a survey conducted by the Gallup organization September 6-9, 2012, 1,017 adults were asked,
"In general, how much trust and confidence do you have in the mass media - such as newspapers, TV, and radio - when it comes to reporting the news fully, accurately, and fairly?" 81 said that they had a "great deal" of confidence, 325 said they had a "fair amount" of confidence, 397 said they had "not very much" confidence, and 214 said they had "no confidence at all."
Sketch a bar chart of the data.
Look at the chart
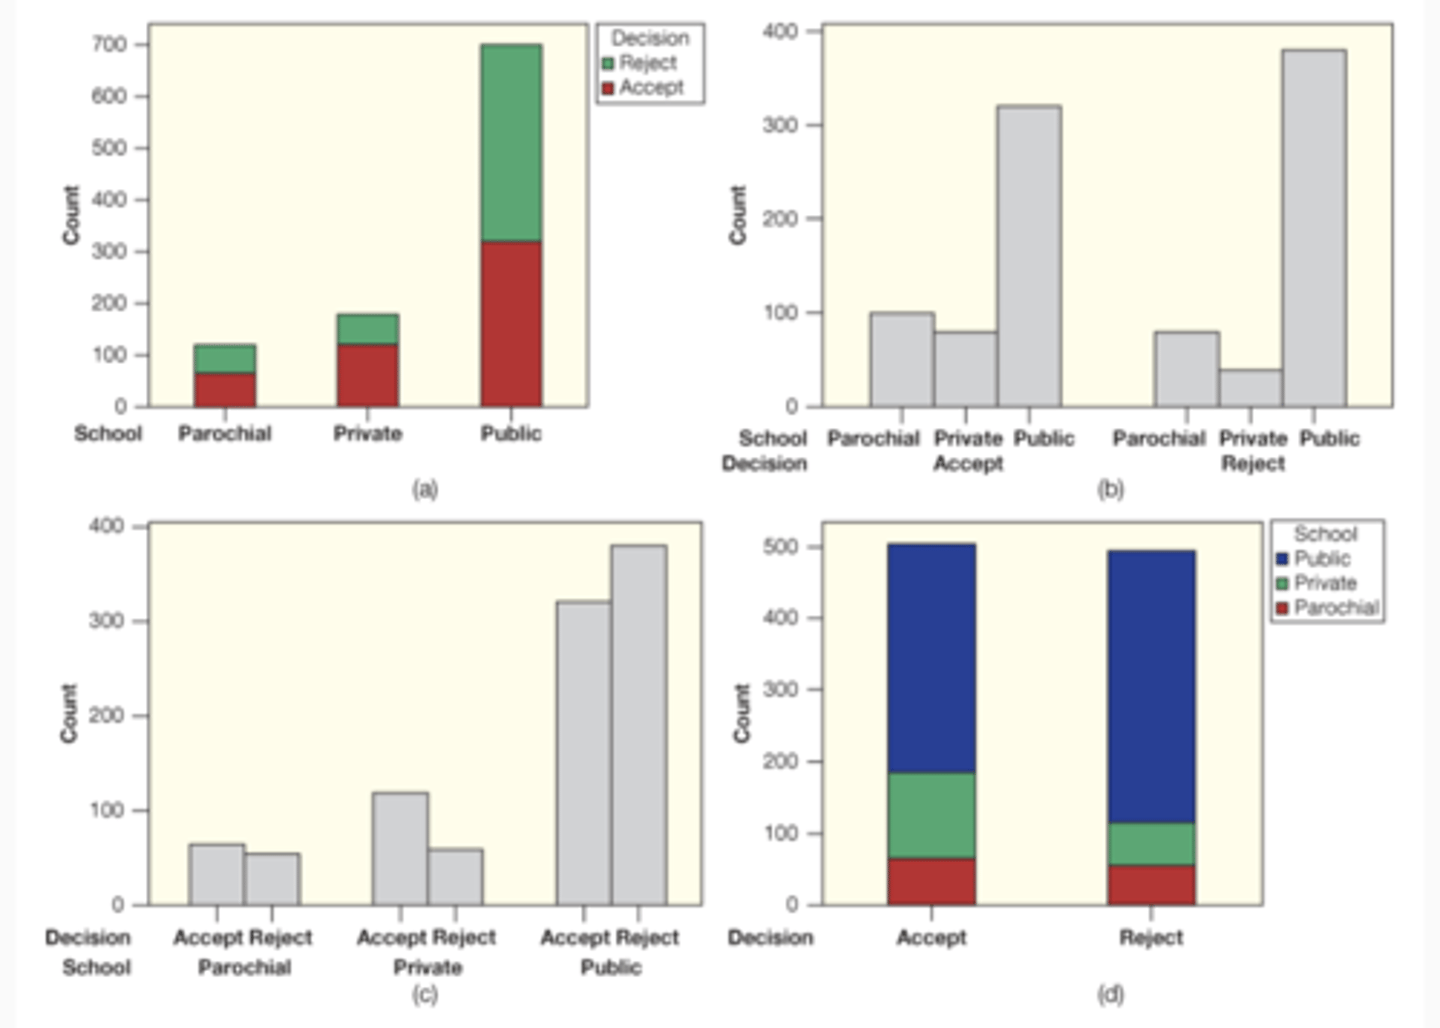
Four students were working together on a project and one of the parts involved making a graph to display the relationship in a two-way table of data with two categorical variables: college accept/reject decision and type of high school (public, private, parochial). The graphs submitted by each student are shown in the figure below. Three are from the same data, but one is inconsistent with the other three.
Which is the bogus graph?
Graph B
If a distribution is heavily left-skewed, which relationship between the mean and median is most likely?
Mean < Median
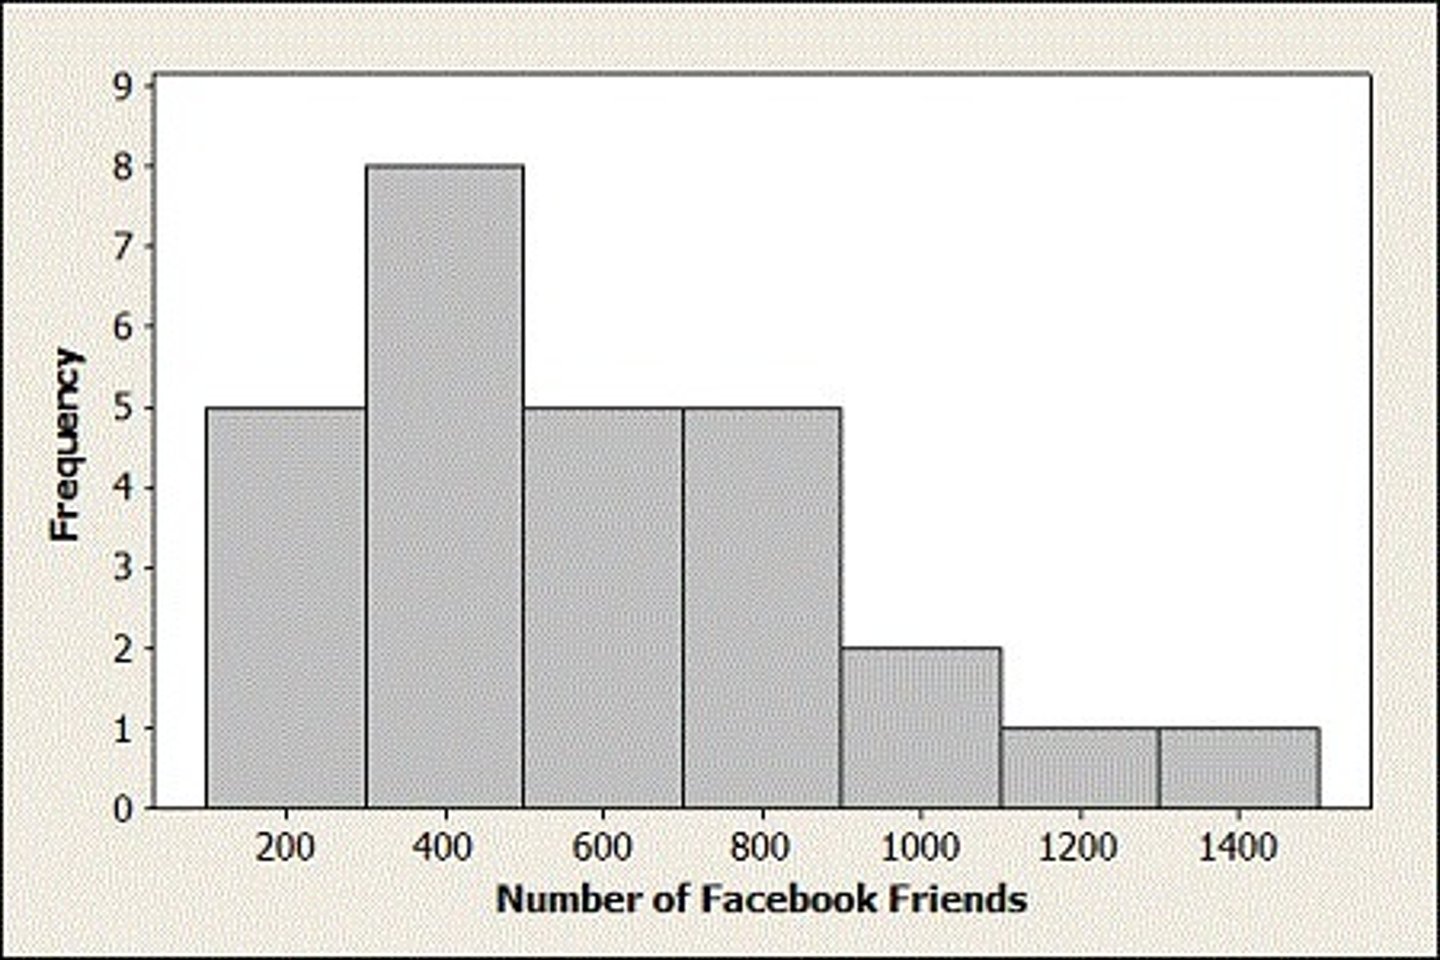
Which of the following best describes the shape of the distribution of the number of Facebook Friends?
Skewed to the Right
If a distribution is heavily right-skewed, which relationship between the mean and median is most likely?
Mean > Median
What statistic is more resistant to outliers? (Extreme data values)
Interquartile Range
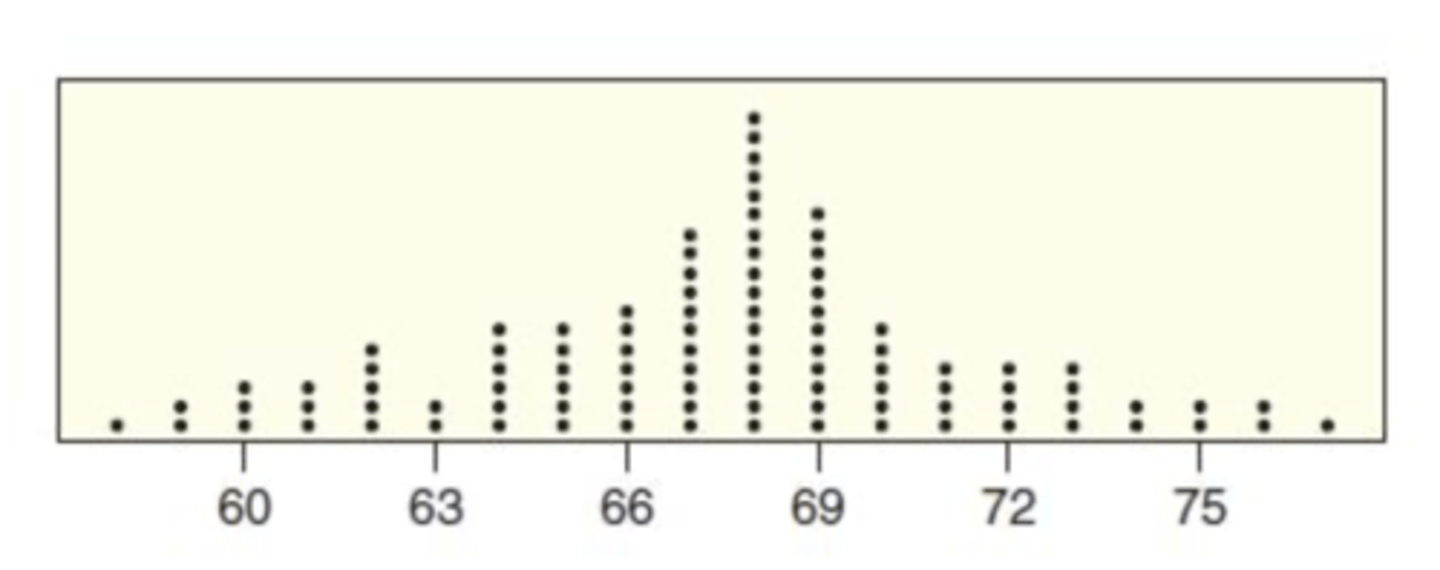
Estimate the Mean and Standard Deviation for the Data in the Dotplot
Mean = 67 Standard Deviation = 4
How do you find the Z-Score of a data value?
Value in Dataset - Mean of the data set / Standard Deviation
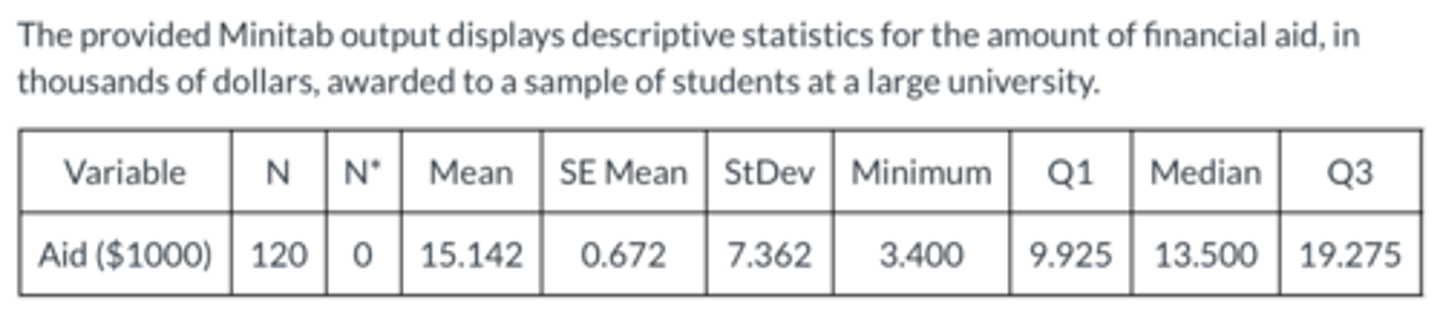
Based on the mean and median financial aid amounts displayed in the summary, which of the following most likely describes the shape of the distribution of financial aid amounts?
Slightly Skewed to the Right

Is the largest financial aid amount an outlier?
Yes
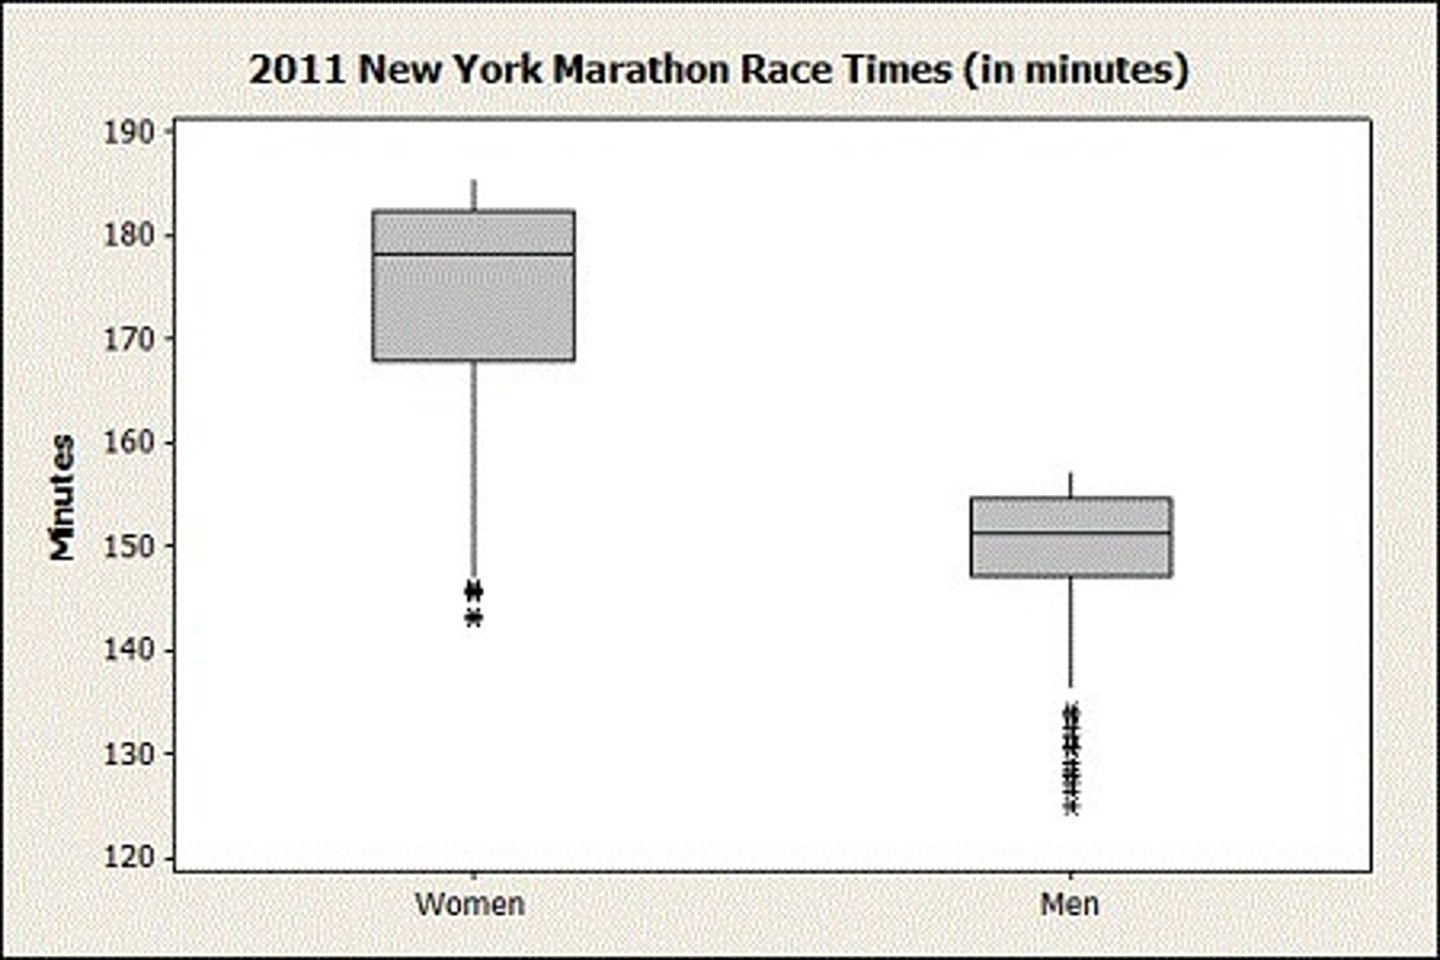
Which group has the largest spread in its race times?
Women
Which state has the most tornados per year?
Kansas
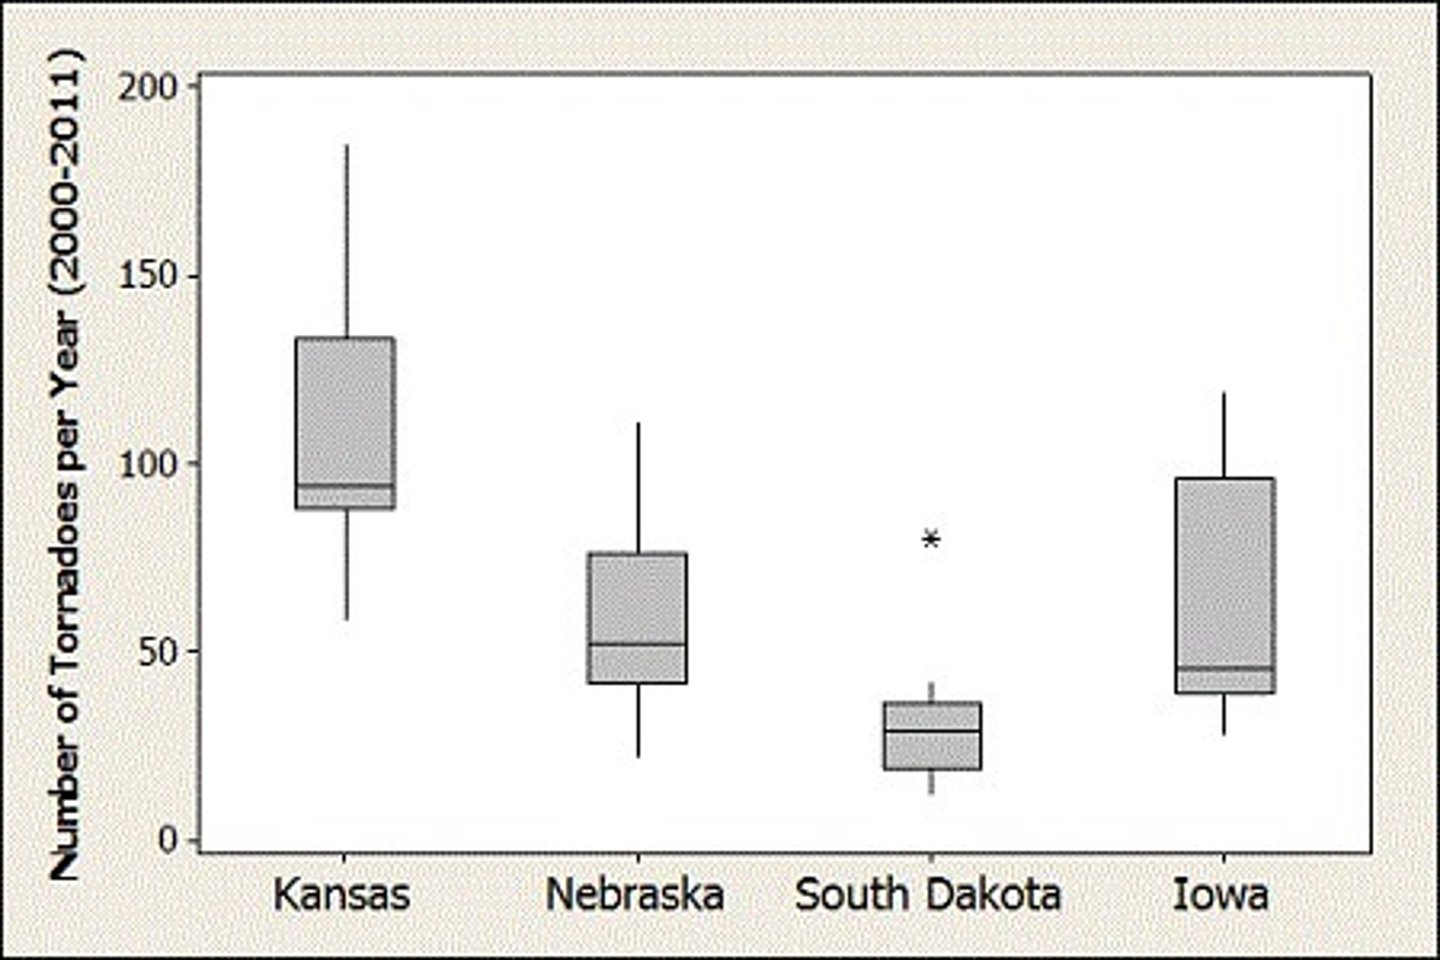
Which state has the largest range?
Kansas

Which state has the largest IQR?
Iowa

Which state has an outlier?
South Dakota
