Chapter 2: Exploring Data: Frequency Distributions and Graphs
1/14
There's no tags or description
Looks like no tags are added yet.
Name | Mastery | Learn | Test | Matching | Spaced | Call with Kai |
|---|
No analytics yet
Send a link to your students to track their progress
15 Terms
raw score
score obtained by observation or from an experiment
simple frequency distribution
scores arranged from highest to lowest, each with its frequency of occurrence
grouped frequency distribution
scores compiled into intervals of equal size. includes the frequency of scores in each interval
class interval
a range of scores in a grouped frequency distribution
abscissa
the horizontal axis of a graph
x-axis
ordinate
the vertical axis of a graph
y-axis
frequency polygon
graph of a frequency distribution of a continuous variable
points are connected by lines
histogram
graph of a frequency distribution of a continuous variable
frequencies indicated by contiguous vertical bars (bars are touching)
bar graph
graph of a frequency distribution of nominal or categorical data
bars are separated
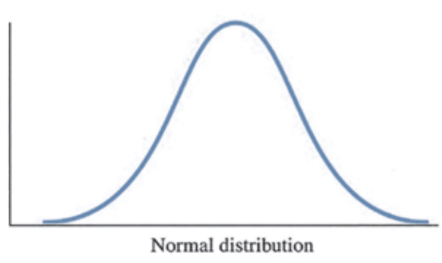
normal distribution (normal curve)
a mathematically defined, theoretical distribution or graph of observed scores with a particular shape
skewed distribution
asymmetrical distribution
may be positive or negative
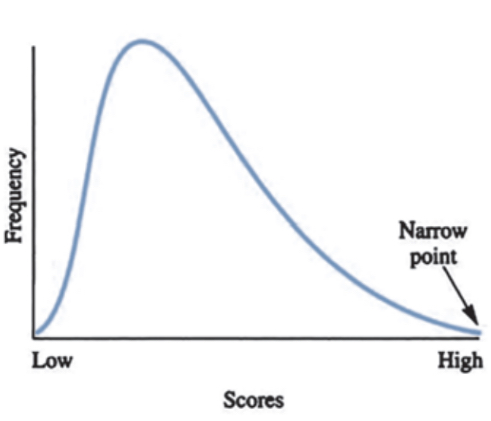
positive skew
graph with a lot of low scores
high curve, then goes low
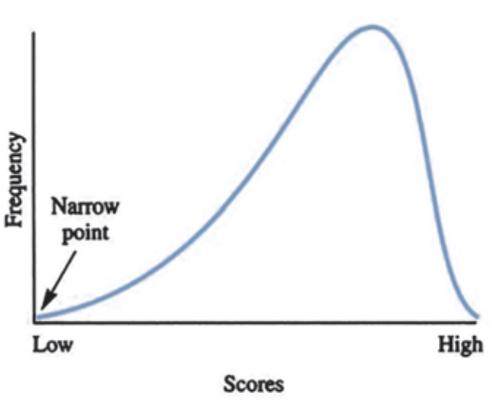
negative skew
graph with a lot of high scores
starts low, then curves high
bimodal distribution
distribution with two modes
line graph
graph that uses lines to show the relationship between two variables