ESS 2.2: Energy and Biomass in ecosystems
1/36
There's no tags or description
Looks like no tags are added yet.
Name | Mastery | Learn | Test | Matching | Spaced | Call with Kai |
|---|
No analytics yet
Send a link to your students to track their progress
37 Terms
What is an ecosystem?
All the organisms in a given area, along with the abiotic factors that they interact with.
Water cycle
Carbon cycle
Nitrogen cycle
Sulfuer cycle
Characteristics of energy
Energy cannot be recycled; it must flow through ecosystems, primarily from producers to consumers and eventually to decomposers.
First law of thermodynamics
Matter nor energy can be created nor destroyed.
Second law of thermodynamics
Energy transfer increases entropy and is less efficient. (Entropy: when energy is spread out and hard to use (Disorderly))
Why are there limits to the number of trophic levels in a food chain?
Not enough energy to make it up the food chain
How many consumers are there in relation to producers
Much fewer consumers, according to trophic levels, energy-wise: 1-10
How much energy is lost between tropic levles
90%
10% Rule: of the total biomass in a trophic
level, only about 10% can be converted into
energy at the next higher trophic level
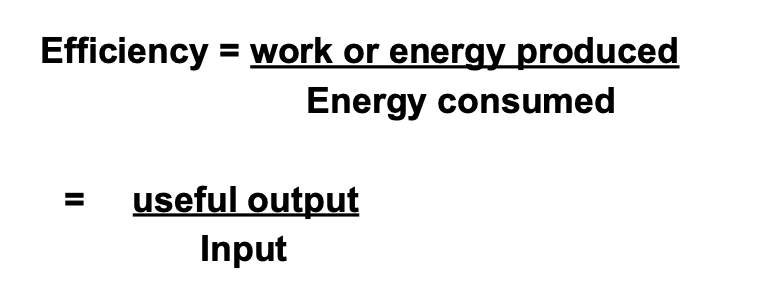
Efficiency equation
How does photosynthesis increase plant biomass
Carbon Dioxide+Water from soil + sunlight = glucose and oxygen, which are used for growth and energy.
Glucose is used to build new cells. and grow leaves.
How does cellular respiration work
Cells take glucose, which is produced through photosynthesis. and glucose is broken down to ATP and carbon dioxide. water and heat.
Systems diagram for respiration and photosynthesis
tropic levels
Producer: Make food molecules from inorganic raw materials (photosynthesis, abiotic matter→biotic matter)
primary consumers
secondary consumers
tertiary consumers
Chemosynthesis
Chemosynthesis is when organisms make food without sunlight. This process utilizes chemical reactions, typically involving inorganic molecules, to produce glucose or other organic compounds.
Where does chemosynthesis happen happen?
It often happens in deep-sea hydrothermal vents.
Food chain vs. food web
Food chain: Sequence of food transfers from producers through 1-4 levels of consumers in an ecosystem.
Food web: is a bunch of food chains that interconnect.
Why is energy lost at each level of the tropic level
lost as heat and 2nd law of thermodynamics
Productivity
the amount of biomass created by producers within a given area over a specific time period.
Plants: (Mass/unit area/per unit time)
It tells us how much energy in an ecosystem actually turns into actual living material.
GPP
Gross primary productivity: Total amount of energy captured by producers through photosynthesis
NPP
Net Primary Productivity: the amount of energy captured by producers that is available for growth and reproduction after accounting for the energy used in respiration.
Units for collecting grass
g m^-2 of Mg ha^-1
Characteristics of Energy pyramid
Always upright: energy will always decrease as you go up
The unit is kcal/m²/yr.
It shows the amount of energy available in each trophic level, and the flow of energy in a ecosystem over time (Rate)
Characteristics of a biomass pyramid
Not always upright
It’s a snapshot in time (shows standing crop: stored biomass at one point)
Shows the total mass of all living organic matter at each trophic level at a specfic moment in time.
(Units: gm^2) Grams per square meter
Characteristics of a numbers pyramid
Not always upright
shows the total number of organisms at each trophic level at one time
Can be inverted
Represents the total number of individuals at each trophic level.
Strengths and weaknesses of a number pyramid
Strengths:
Simple method of understanding community structure
Useful for comparing changes in a number of individuals over time
Weaknesses:
All organisms are included regardless of size (biomass)
Some organisms are at more than one trophic level
Strenghts and weakness of biomas spyramid
Strengths:
Useful for comparing ecosystems: Allows comparison of standing crop between ecosystems
Shows stored organic matter: (Gives a clear picture of how much living material is present.)
Weaknesses:
Only shows biomass at one point in time
doesn't account for seasonal variations.
Does not reflect number of organisms
Strengths and weaknesses of energy pyramid
Strengths:
Most accurate, as it shows all the accurate energy availibe
It is not just for one moment in time; it takes available energy flow over time into account and can illustrate seasonal changes.
Weaknesses:
Difficult to measure accurately
It’s difficult to assign species to a specific trophic level, especially decomposers and detritivores.
Sources of energy loss
Respiration
Heat
Excretion (Shit)
Uneaten biomass
Biocides
Chemical substances used to control harmful organisms in agriculture and pest management, including PCB (industrial chemical), DDT (insecticide), and mercury (heavy metal released because of coal burning, and mining).
Bioaccumulation
An increased concentration of a chemical within an organism over time
Biomagnification
The accumulation of persistent chemicals in the living tissues of consumers in food chains that leads to higher concentrations at each trophic level.
Persistence
The length of time a chemical remains in the environment
Similarities and Differences between bioaccumulation and biomagnification
Similarities:
Both involve a buildup of toxic materials
usually are a buildup of non-biodegradable pollutants (DDT/Mercury)
Both cause harm to organisms and their respective environments.
Both occur in aquatic food chains.
Differences:
Bioaccumulation
occurs in a single organism
Toxic accumulates and increases over time
Example: fish absorbs mercury from water and food
Biomagnification:
Occurs between trophic levels
toxic concentrations of chemicals increase as you go up trophic levels.
Results from predators eating too much contaminated prey
Occurs