AAQ
1/22
There's no tags or description
Looks like no tags are added yet.
Name | Mastery | Learn | Test | Matching | Spaced |
|---|
No study sessions yet.
23 Terms
Research methods (part a)
Experimental, has confounding variable
Experiment
Non-experimental- just describe behavior, they can’t explain behavior, can’t be used to establish a causal relationship because of a third variable
Correlational study
Case study
Naturalistic observation
Meta-analysis
Design options (don’t use these terms by themselves, connect them to non-experimental or experimental)
Cross-sectional
Longitudinal
Experiment
goal is to test a hypothesis and establish a causal relationship between independent and dependent variables
independent variable- what is being manipulated
dependent variable- what is being measured
has an experimental group which receives the independent variable and a control group which is the group that gets the placebo
Random assignment used- assigning people randomly to control or experimental group
Random selection- people randomly selected for the study
Should demonstrate reliability, validity, & operational definition
How to know if it’s an experiment
Does the research deliberately change or manipulate one variable to observe its effect on another
Does the researcher use random assignment?
Does the research control other variables that could influence the outcome, either by keeping other variables constant or by using a control group?
Correlational study
examines the relationship between two variables without manipulating them
correlation is not causation
Case study
examines an individual group of people, event, or situation to provide detailed information and insight into the topic of interest
not always generalizable since they have a small sample size
Naturalistic observation
researcher observes individuals in a real world setting, the goal being to try and gather authentic data by observing people in their environments
Meta-analysis
a statistical technique that combines the results of multiple studies on the same topic to reach a conclusion
a study of studies
Cross-sectional
when research compares different groups of people at one single point in time
Longitudinal
studies the same group of people over a long period of time, observing how the group changes over time
State the operational definition(part b)
The operational definition allows other researchers to replicate the study or research, the operational definitions are generally quantifiable and specific, so everyone can see exactly what was done and how it was done
state how the variable is measured
The operational definition of [insert variable] is [insert the operational definition]
ex. the operational definition of intelligence is the score on the test
Describe the meaning of the identified statistic (part c)
They can ask for the mean, median, mode, range, standard deviation, percentile rank, skewness, correlation coefficients, effect size, or statistical significance
show how the statistic connects with the research
Mean
average, might be affected by outliers so look out for data that might be misleading due to having outliers
regression towards the mean- when outliers are followed by results that are closer to the average
ex. you do amazing on one basketball game but then go back to average, suggesting the amazing performance was luck
Mode
most helpful when looking at categorical data
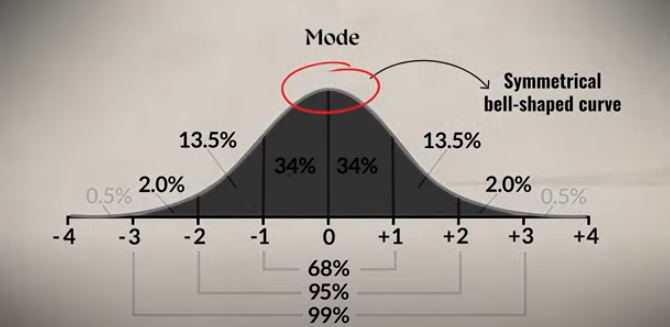
Symmetrical distribution
mean,median, and mode all coincide at the center point
Right skew positive
mode is at peak of the distribution, median to the right of that, and mean to the right of that
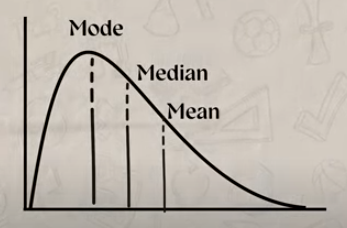
Left skew negative
mode at peak again, median to the left of that, mean left of that
Standard deviation
average distance from mean for a data set
Percentile rank
the percentage of scores at or below a particular score
tells you what percentage of the population has a score that’s the same or lower than yours
ex. 73rd percentile for height means 73% of people your age are shorter or equal in height to you while 27% are as tall or taller than you
Correlational coefficients
used with correlational studies
correlations allow us to make predictions on what will happen in a study
correlation does not mean causation
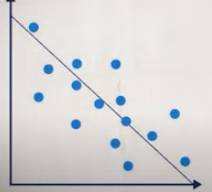
the closer this value is to -1 or 1, the stronger the relationship between the 2 variables
Correlation range coefficient between 0 and 1 indicates that as one variable increases, the other increases too (positive correlation), when plotted it’s an upward trend
Correlation range coefficient between 0 and -1 indicates that as one variable increases, the other decreases (negative/inverse relationship), appears as downward trend when plotted
there’s also no correlation where the data points will be scattered randomly
positive is right picture negative is left picture

P-value
provides insight to statistical significance of a study
statistical significance tells us whether that difference is real or just due to chance
shows if results matter
ranges 0 to 1
less than or = to .05, results statistically significant, so the results are not caused by luck
smaller the p value stronger the evidence against the null hypothesis
larger the p value the more due to chance
Effect size
tells us the strength of the relationship between variables
how meaningful the effect is in real world terms
large effect size means large difference between 2 groups
small effect size means more minor difference
ex. p value of .05 so therapy has an effect, effect size 0.2 so the effect is small
shows how much the effects matter in real life
Identify one ethical guideline used (part d)
ethical guidelines you can choose are
the research received approval from an institutional review board (IRB)
informed consent was obtained from all adult participants
informed assent was collected from participants younger than 18
participants were protected from harm, or the study posed no potential harm
researchers ensured the confidentiality or anonymity of participant data
participants were allowed to withdraw from the study any time, even after it began
a full debriefing was provided to participants at the end of the study
Explain the extent to which the research findings may or may not be generalizable using specific and relevant evidence from the study
generalizability is the extent that the study can be broadly applied to the “larger population that is being studied”
figure out who is represented and not represented
say whether or not it is generalizable and then explain
the point depends how you explain it
Explain how at least one of the research findings supports or refutes the psychological concept or hypothesis of the study
state what the researcher found and explain how the results support or refutes the hypothesis/ concept that the aaq is talking about
say if it supports or refute hypothesis/concept, then explain