Types of Maps
1/9
There's no tags or description
Looks like no tags are added yet.
Name | Mastery | Learn | Test | Matching | Spaced | Call with Kai |
|---|
No analytics yet
Send a link to your students to track their progress
10 Terms
Reference maps are what?
Boring
Thematic maps tell a what?
Story
Choropleth map
Uses colors and shading to represent quantifiable data, and shows density.
Dot map
Dots that represent a value in its approximate location
Graduated symbol
Feature symbols proportional in size to the actual value of data
Isoline map
Connects areas of equal value with lines, often used for weather.
Cartogram map
distort the appearance of the places on the map to represent their value.
Topographic Map
Shows direction and distance specially in the form of elevation
Mercator Map
This map tries to create a map that is accurate but is still inaccurate in places
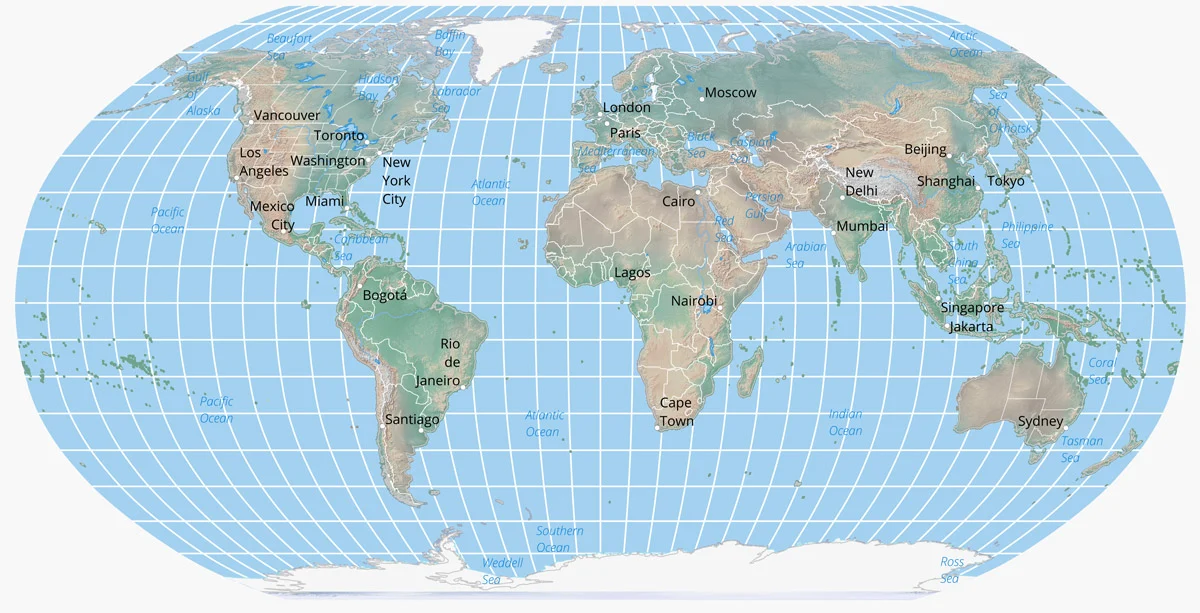
What is a Robinson map?
A map that shows the entire world at once